Review
. 2024 Jan 1;108(1):45-71.
doi: 10.1097/TP.0000000000004624. Epub 2023 Dec 13.

The Molecular Phenotype of Kidney Transplants: Insights From the MMDx Project

Affiliations
Review

The Molecular Phenotype of Kidney Transplants: Insights From the MMDx Project

Philip F Halloran et al. Transplantation. .

Abstract

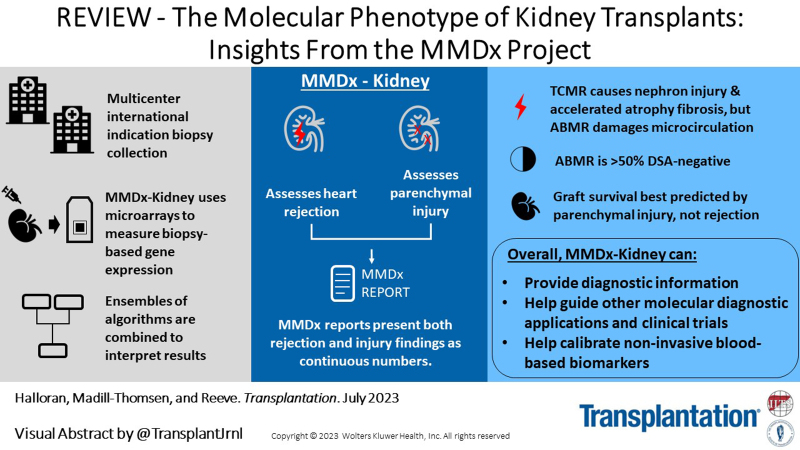
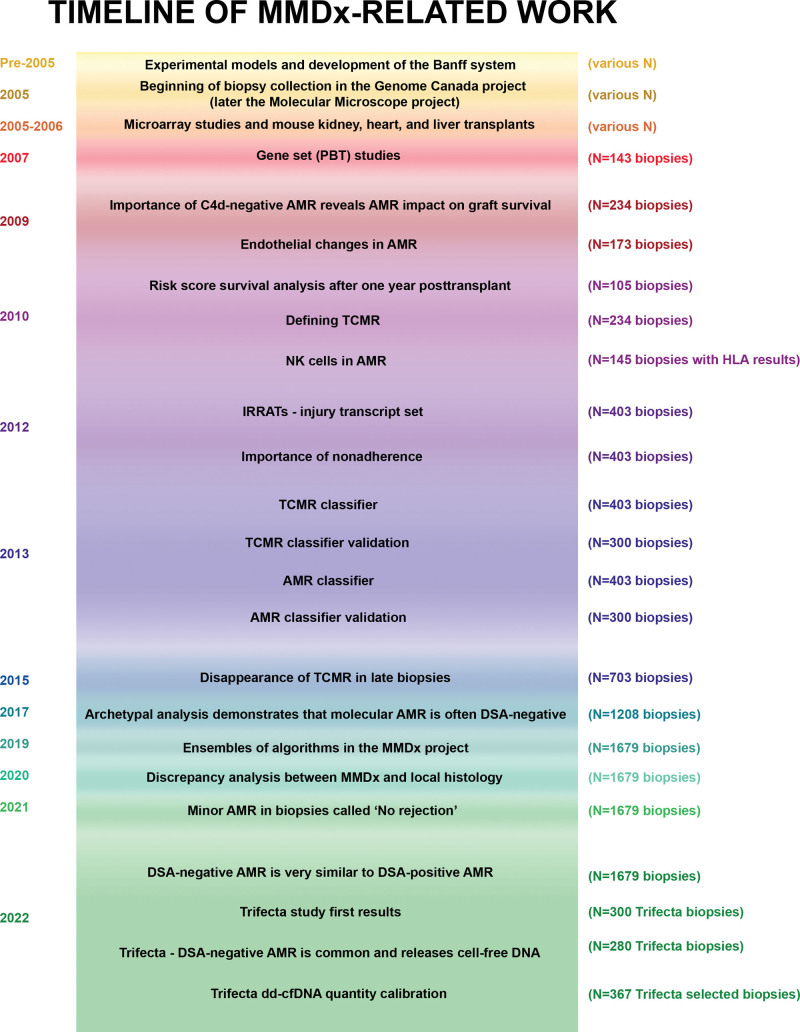
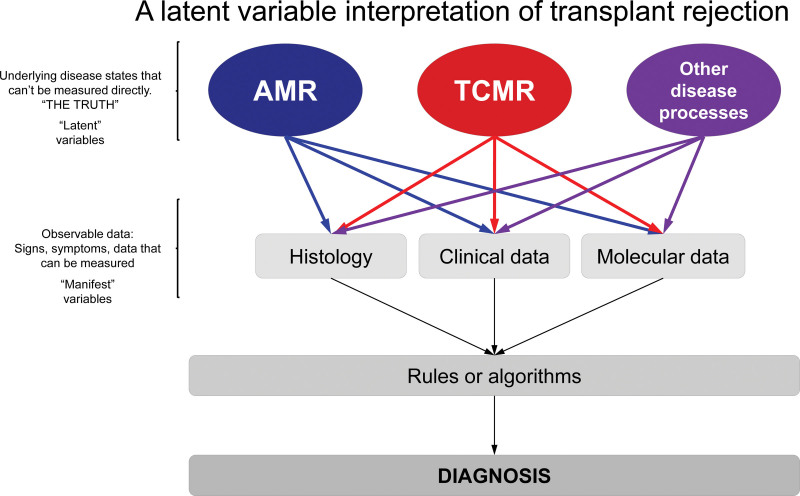
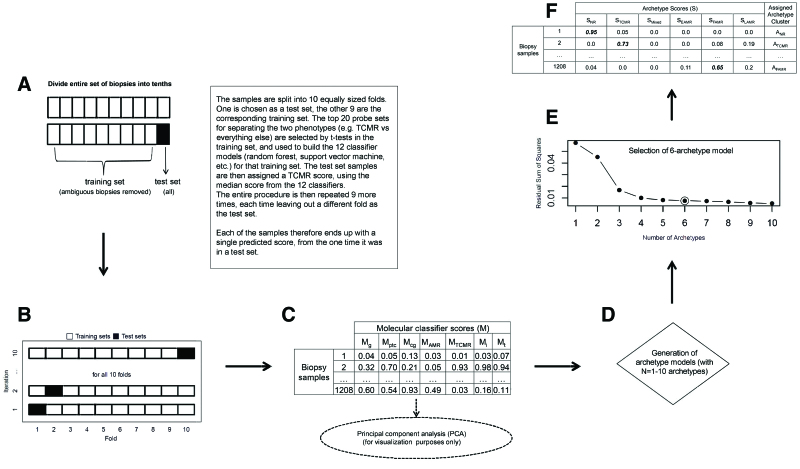
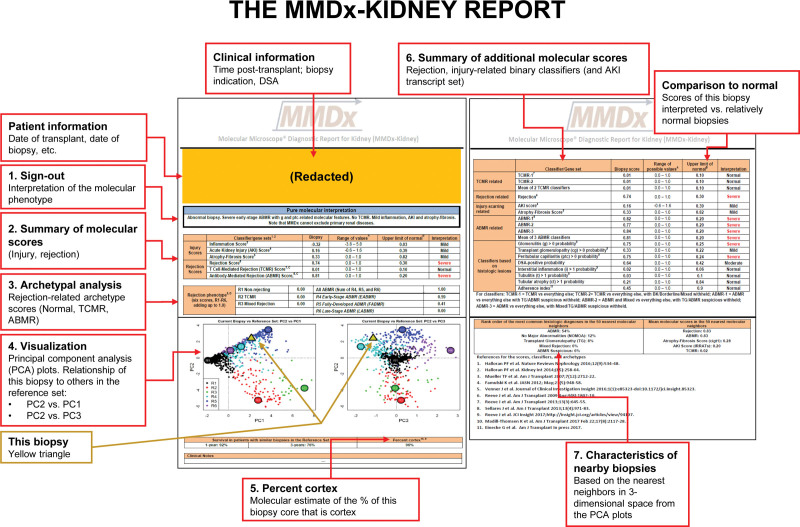
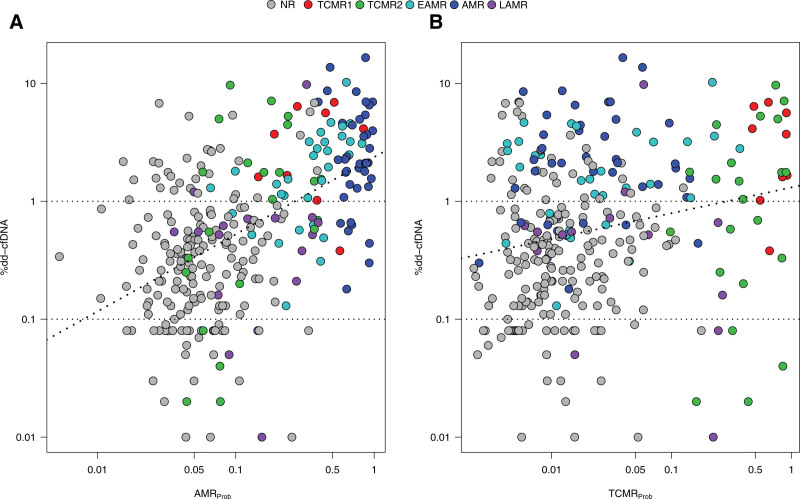
This review outlines the molecular disease states in kidney transplant biopsies as documented in the development of the Molecular Microscope Diagnostic System (MMDx). These states include T cell-mediated rejection (TCMR), antibody-mediated rejection (AMR), recent parenchymal injury, and irreversible atrophy-fibrosis. The MMDx project, initiated through a Genome Canada grant, is a collaboration involving many centers. MMDx uses genome-wide microarrays to measure transcript expression, interprets the results using ensembles of machine learning algorithms, and generates a report. Experimental studies in mouse models and cell lines were extensively used to annotate molecular features and interpret the biopsy results. Over time, MMDx revealed unexpected aspects of the disease states: for example, AMR is usually C4d-negative and often DSA-negative, and subtle "Minor" AMR-like states are frequent. Parenchymal injury correlates with both reduced glomerular filtration rate and increased risk of graft loss. In kidneys with rejection, injury features, not rejection activity, are the strongest predictors of graft survival. Both TCMR and AMR produce injury, but TCMR induces immediate nephron injury and accelerates atrophy-fibrosis, whereas AMR induces microcirculation and glomerular damage that slowly leads to nephron failure and atrophy-fibrosis. Plasma donor-derived cell-free DNA levels correlate strongly with AMR activity, acute kidney injury, and in a complex way with TCMR activity. Thus, the MMDx project has documented the molecular processes that underlie the clinical and histologic states in kidney transplants, and provides a diagnostic tool that can be used to calibrate biomarkers, optimize histology interpretation, and guide clinical trials.


Figures

None
Graphical abstract
FIGURE 1.
FIGURE 1.
Timeline of work done over the course of the MMDx-Kidney project. AMR, antibody-mediated rejection; dd-cfDNA, donor-derived cell-free DNA; DSA, donor-specific antibody; IRRAT, injury- and rejection-associated transcript; MMDx, Molecular Microscope Diagnostic System; NK, natural killer; TCMR, T cell–mediated rejection.
FIGURE 2.
FIGURE 2.
Latent variable interpretation of transplant rejection. True disease states are “latent variables” that can seldom be known with absolute certainty. Observable measurements (“manifestations”: histologic, clinical, and molecular data) of the underlying diseases are used to assign a diagnosis. The Banff system uses histologic lesions + DSA + C4d (step 1) to make diagnoses using consensus rules/expert opinion (step 2). MMDx measures gene expression (step 1) to assign disease states/probabilities (step 2) using: (A) scores from supervised methods—classifiers based on correlations/associations between gene expression and histologic diagnoses/lesion scores, and (B) unsupervised methods combining scores from (A) and gene set (PBT) scores. Once in place, both Banff and MMDx require only 1 type of data to assign diagnoses in new samples—histology/DSA for Banff, and gene expression for MMDx. AMR, antibody-mediated rejection; DSA, donor-specific antibody; MMDx, Molecular Microscope Diagnostic System; PBT, pathogenesis-based transcript; TCMR, T cell–mediated rejection.
FIGURE 3.
FIGURE 3.
Classifier algorithm flowchart. A, Ten-fold cross-validation is illustrated, with each of the 10 folds shown as they are used in both the training and test sets. B and C, How the base classifiers (TCMR, AMR, i > 1, t > 1, g > 0, cg > 0, ptc > 0) were developed. For each of the 7 base classifiers: (B) 10-fold cross-validation is performed, randomly splitting the 1208 biopsies into 10 folds of equal or near-equal size. For each of 10 iterations, 1 fold is left out as a test set (black box), and a classifier is developed using the remaining 9 folds (white boxes) as the training set. All aspects of classifier development, including probe set selection, are carried out from scratch within the training set samples at each iteration. The top 20 (by P value) differentially expressed probe sets comparing the binary phenotypes within the training set are selected as input features for the classifier. Twelve different classifier algorithms are developed in each training set, generating 12 scores for each test set sample (1 for each classifier algorithm). The median of these 12 is used as each test set sample’s final score. This process is repeated over all 10 iterations, resulting in each biopsy being in a test set once and receiving a single value. C, This is repeated for each of the 7 base classifiers, resulting in a 1208 × 7 matrix of classifier test set scores. D–F, The archetypal analysis. These data are used as the input for both the principal component analysis (used for visualizing the multivariate distribution) and the archetypal analysis. D, We generated 10 archetype models (with n = 1–10 archetypes). The residual sum of squares decreases with increasing numbers of archetypes (scree plot in E). We selected 6 archetypes (circled point in E) as the final archetypal model. F, All biopsy samples are assigned a score for each of the 6 archetypes, and cluster assignments are made based on the highest score within that biopsy. The tables included show what typical data look like but do not represent actual results. AMR, antibody-mediated rejection; cg, transplant glomerulopathy; EAMR, early-stage AMR; FAMR, fully developed AMR; g, glomerulitis; i, interstitial inflammation; LAMR, late-stage AMR; M, molecular classifier scores; NR, no rejection; ptc, peritubular capillaritis; S, archetype score; t, tubulitis; TCMR, T cell–mediated rejection.
FIGURE 4.
FIGURE 4.
Relationship between PBT scores, histopathologic lesions, histologic diagnosis, and classifier predictions. Biopsies for cause (N = 143) were sorted based on the CAT1 score (from lowest to highest). According to this order, scores for all PBTs (CAT1, CAT2, GRIT1, GRIT2, KT1, and KT2) are illustrated for each individual biopsy for cause. The panel above the graph illustrates the relationship of the PBT scores to the histologic diagnosis of ATN, the interstitial infiltrate (i score), tubulitis (t score), intimal arteritis (v score), and the probability of rejection (%) predicted from a classifier. Biopsies were sorted based on the CAT1 score, and the relationship between PBT scores, diagnosis, and classifier predictions are shown. ATN, acute tubular necrosis; CAT, cytotoxic T lymphocyte-associated transcripts; GRIT, IFNG-inducible transcripts; i, interstitial infiltrate; KT, kidney transcripts; PBT, pathogenesis-based transcript set; t, tubulitis; v, intimal arteritis.
FIGURE 5.
FIGURE 5.
Landscapes of molecular rejection in kidney transplant biopsy populations shown as volcano plots.,, Each transcript is shown as a point on the plot, colored by its annotation (if the annotation is available). Fold change of each transcript is shown on the y-axis, and association along the x-axis. Most significant transcripts will appear in the top right corner of each plot. The molecular landscapes of (A) all rejection, (B) TCMR, and (C) AMR. AMR, antibody-mediated rejection; TCMR, T cell–mediated rejection.
FIGURE 6.
FIGURE 6.
Visualizing archetypal groups in 1679 kidney transplant biopsies. The 1679 biopsies are shown distributed by their rejection classifiers scores in PCA and colored by their archetype assignment, with y-axis PC2 and x-axis (A) PC1 or (B) PC3. (A, rejection increases with PC1, whereas PC2 separates TCMR from AMR). B, PC3 separates AMR stages but does not separate TCMR1 and TCMR2. AMR, antibody-mediated rejection; EAMR, early-stage AMR; FAMR, fully developed AMR; LAMR, late-stage AMR; PCA, principal component analysis; TCMR, T cell–mediated rejection.
FIGURE 7.
FIGURE 7.
Venn diagram Type 1 vs Type 2 AMR. Characteristics of type 1 AMR are summarized on the left (blue) side of the Venn diagram, whereas characteristics of type 2 AMR are summarized on the right (purple) side. Features common to both type 1 and type 2 AMR are in the center. AMR, antibody-mediated rejection; DSA, donor-specific antibody; ptc, peritubular capillaritis.
FIGURE 8.
FIGURE 8.
The MMDx-Kidney report. Numbered items on the report are as follows: (1) The biopsy results are summarized by an expert reader, with comments on unusual features. This remains a necessary step because some biopsies have multiple or ambiguous features or rare phenotypes. (2) The molecular scores are summarized for the inflammatory disturbance, AKI (IRRAT), atrophy-fibrosis (the ci-classifier), and the all-rejection, TCMR, and AMR classifiers. (3) The archetype scores are summarized. Archetype scores are proportions, unlike binary classifier scores. Thus, a biopsy assigned to a particular archetype rejection cluster can have nearly as high a score in a second archetype but is only assigned to 1 group based on its highest (“dominant”) archetype score. (4) The rejection classifier scores are used to locate the position of the new biopsy (triangle) in relationship to the biopsies in the locked, N = 1208 reference set, which are colored by their rejection archetype states and shown in PCA plots: PC2 versus PC1 (left panel) and PC2 versus PC3 (right panel). (5) The percent cortex is estimated by NPHS2 (podocin) expression. Low %cortex (<10%) can affect some scores, eg, inflammation, cg-classifier, and late-stage AMR. (6) Details of selected rejection and injury scores of interest are presented and compared to relatively normal biopsies. (7) The characteristics of this biopsy are compared to its nearest neighbors in the reference set. AKI, acute kidney injury; AMR, antibody-mediated rejection; cg, transplant glomerulopathy; IRRAT, injury- and rejection-associated transcript; MMDx, Molecular Microscope Diagnostic System; PCA, principal component analysis; TCMR, T cell–mediated rejection.
FIGURE 9.
FIGURE 9.
Venn diagram showing the relationship between the molecular TCMR score and the agreement among 3 pathologists (“A,” “B,” and “C”) in the 245 biopsy subset. Numbers in italics show the average molecular TCMR score in the biopsies. Numbers with no parentheses are the intersections of the number of biopsies diagnosed as TCMR by the 3 pathologists. One hundred seventy-one biopsies were called no TCMR by all 3 pathologists (mean TCMR score of 0.007, numbers outside of the diagram). Biopsies with either i2t2 TCMR or mixed rejection were considered TCMR. Isolated v-lesion TCMRs were not counted as TCMR. AMR, antibody-mediated rejection; TCMR, T cell–mediated rejection.
FIGURE 10.
FIGURE 10.
Attributed causes of graft failure in the biopsy-for-cause population—60 losses in 315 patients with follow-up. Distribution of the attributed causes of failure. Failures that could not be attributed due to missing clinical information are not represented (N = 4). AMR, antibody-mediated rejection; PVN, polyoma virus nephropathy.
FIGURE 11.
FIGURE 11.
Genes associated with DSA-positive AMR. Scatterplots showing (A) fold change in DSA-negative mAMR biopsies versus no rejection biopsies (y-axis) plotted against fold change in DSA-positive mAMR biopsies versus no rejection biopsies (x-axis); (B) P values for the same class comparisons. AMR, antibody-mediated rejection; DSA, donor-specific antibody.
FIGURE 12.
FIGURE 12.
UMAP projections of 1679 biopsies. All 1679 indication kidney transplant biopsy specimens, shown using UMAP, colored by (A) assigned rejection-based archetypal class, (B) increasing DSAProb classifier score, and (C) increasing AMRProb score. Biopsy samples with low probability of molecular rejection are located toward the bottom of Component 2 in all panels. Biopsy samples with rejection are located toward the upper region of Component 2, with AMR on the left and TCMR on the right of Component 1. AMR, antibody-mediated rejection; DSA, donor-specific antibody; TCMR, T cell–mediated rejection.
FIGURE 13.
FIGURE 13.
Bar plots showing the mean scores for molecular or histologic variables in each rejection archetypal analysis cluster in 1679 biopsies. Scores shown are injury-related, that is, (A) IRRAT and (B) lowGFRProb classifier scores, atrophy-fibrosis related, that is, (C) ci-lesion scores or (D) ci > 1Prob classifier scores, (E) related to arteritis, that is, cv-lesion score, or (F) related to underhyalinosis, that is, ah lesion score. AKI, acute kidney injury; EAMR, early-stage antibody-mediated rejection; FAMR, fully developed antibody-mediated rejection; GFR, glomerular filtration rate; IRRAT, injury- and rejection-associated transcript; LAMR, late-stage antibody-mediated rejection; NR, no rejection; TCMR, T cell–mediated rejection.
FIGURE 14.
FIGURE 14.
Moving average plots showing the proportion of biopsies assigned to particular diagnostic categories and selected molecular scores over time posttransplant (d). Biopsies are categorized according to (A) MMDx sign-outs or (B) archetypal analysis clusters within all 1679 biopsies. (C) Standardized scores from 1526 biopsies are shown (1679 biopsies with low-cortex samples removed = 1526). As there are large differences in mean scores between scores, all scores were standardized to a mean of 0.0 before plotting. The y-axis is in standard deviation units. Biopsies sorted by ascending time of biopsy posttransplant. A line for histologic ci-lesions is shown for comparison to the molecular scores. Window size for averaging is 100 biopsies. AMR, antibody-mediated rejection; EAMR, early-stage AMR; FAMR, fully developed AMR; LAMR, late-stage AMR; MMDx, Molecular Microscope Diagnostics System; TCMR, T cell–mediated rejection.
FIGURE 15.
FIGURE 15.
Various relationships between molecular, histological, and clinical variables and graft survival postbiopsy., (A) Survival shown per archetype group in 1679 biopsies. B–D, Relative variable importance in random survival forest analysis in (B) all biopsies (N = 1679), (C) biopsies with molecular TCMR (N=175), and (D) biopsies with molecular pure AMR (N = 321). E–H, Association with survival within MMDx pure molecular AMR samples. Graft survival is shown in relation to: (E) DSA status (DSA-positive versus DSA-negative) and (F) AMRProb score (expression above or below the median). For comparison, we show the impact of 2 strong predictors of graft loss: (G) the molecular AKI score (IRRAT score) and (H) the molecular atrophy-fibrosis score (ci > 1Prob, expression above or below the median). AKI, acute kidney injury; AMR, antibody-mediated rejection; DSA, donor-specific antibody; IRRAT, injury- and rejection-associated transcript; TCMR, T cell–mediated rejection.
FIGURE 16.
FIGURE 16.
Relationships between %dd-cfDNA, molecular archetype groups, and the AMRProb and TCMRProb classifier scores in N = 300 samples. Dots represent biopsies and corresponding paired blood sample %dd-cfDNA results, colored by archetype cluster assignments. Regression lines (dashed) show the relationship between the (A) AMRProb and (B) TCMRProb classifier scores and %dd-cfDNA. Spearman correlations with dd-cfDNA were stronger for AMRProb (0.52, P = 6E-22) than TCMRProb (0.22, P = 9E-5). AMR, antibody-mediated rejection; dd-cfDNA, donor-derived cell-free DNA; EAMR, early-stage AMR; LAMR, late-stage AMR; NR, no rejection; TCMR, T cell–mediated rejection.
FIGURE 17.
FIGURE 17.
Schematic diagram representing the relationships between sources of injury and response to injury in kidney transplant biopsies based on injury analyses in MMDx. Interplay between sources of injury, pre-existing limitations such as aging, and response to injury by the nephron. There are 2 routes to irreversible nephron shutdown, namely, direct epithelial injury and glomerulus injury with secondary nephron failure. Epithelial injury should trigger the response-to-wounding, which involves epithelium, matrix, and microcirculation, and evokes innate immunity. Failure to mount a response to wounding and adopting a “PC3”-related response (eg, PARD3) with minimal inflammation leads to failure to recover. Many sources of injury (separate from and including rejection) interact with the nephron epithelium, producing AKI. In this instance, the epithelium can be repaired and the organ can recover, or progress to nephron failure. Alternatively, aging and/or AMR can contribute to glomerular disease and AMR can additionally affect the microcirculation, affecting the glomerulus and again causing nephron shutdown, which eventually leads to CKD. If this occurs, a loss of nephrons and end-stage renal disease may occur. Different sources of injury may interact to cause many forms of injury, and injury itself predicts the graft survival while the rejection status does not. Thus, defining the heterogeneity within biopsy injury is an important part of clinical management. AKI, acute kidney injury; AMR, antibody-mediated rejection; CKD, chronic kidney disease; MMDx, Molecular Microscope Diagnostics System; TCMR, T cell–mediated rejection.

References

    1. Hariharan S, Israni AK, Danovitch G. Long-term survival after kidney transplantation. N Engl J Med. 2021;385:729–743. - PubMed
    1. Nankivell BJ, Kuypers DR. Diagnosis and prevention of chronic kidney allograft loss. Lancet. 2011;378:1428–1437. - PubMed
    1. Tait BD, Susal C, Gebel HM, et al. Consensus guidelines on the testing and clinical management issues associated with HLA and non-HLA antibodies in transplantation. Transplantation. 2013;95:19–47. - PubMed
    1. Gupta G, Moinuddin I, Kamal L, et al. Correlation of donor-derived cell-free DNA with histology and molecular diagnoses of kidney transplant biopsies. Transplantation. 2022;106:1061–1070. - PubMed
    1. Xiao H, Gao F, Pang Q, et al. Diagnostic Accuracy of donor-derived cell-free DNA in renal-allograft rejection: a meta-analysis. Transplantation. 2021;105:1303–1310. - PubMed