. 2023 Apr;53(5):2095-2105.
doi: 10.1017/S0033291721003846. Epub 2021 Sep 24.

Disrupted state transition learning as a computational marker of compulsivity

Affiliations

Disrupted state transition learning as a computational marker of compulsivity

Paul B Sharp et al. Psychol Med. 2023 Apr.

Abstract

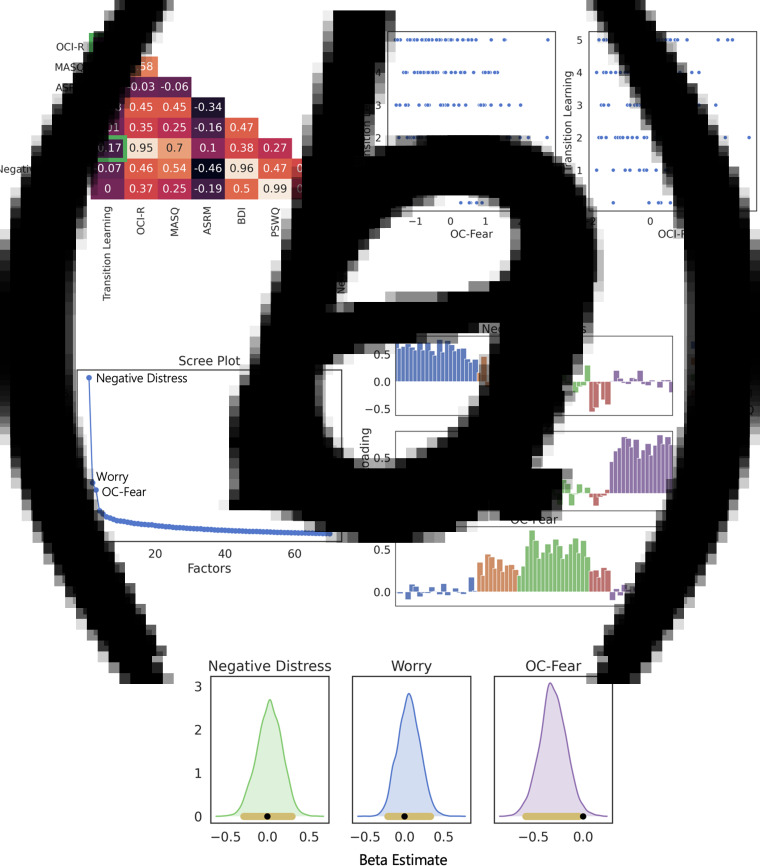
Background: Disorders involving compulsivity, fear, and anxiety are linked to beliefs that the world is less predictable. We lack a mechanistic explanation for how such beliefs arise. Here, we test a hypothesis that in people with compulsivity, fear, and anxiety, learning a probabilistic mapping between actions and environmental states is compromised.

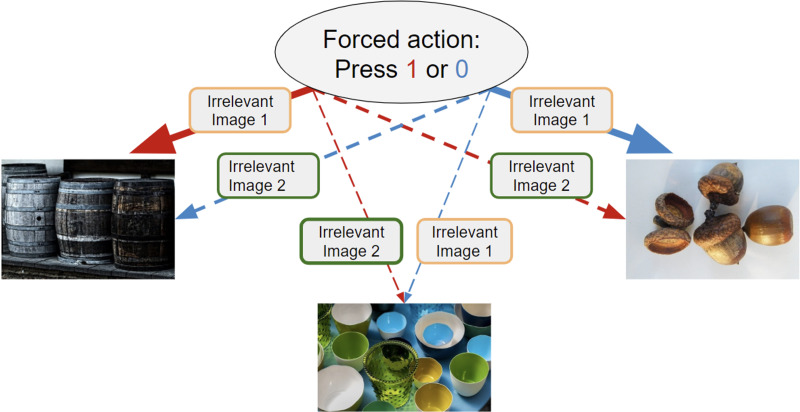
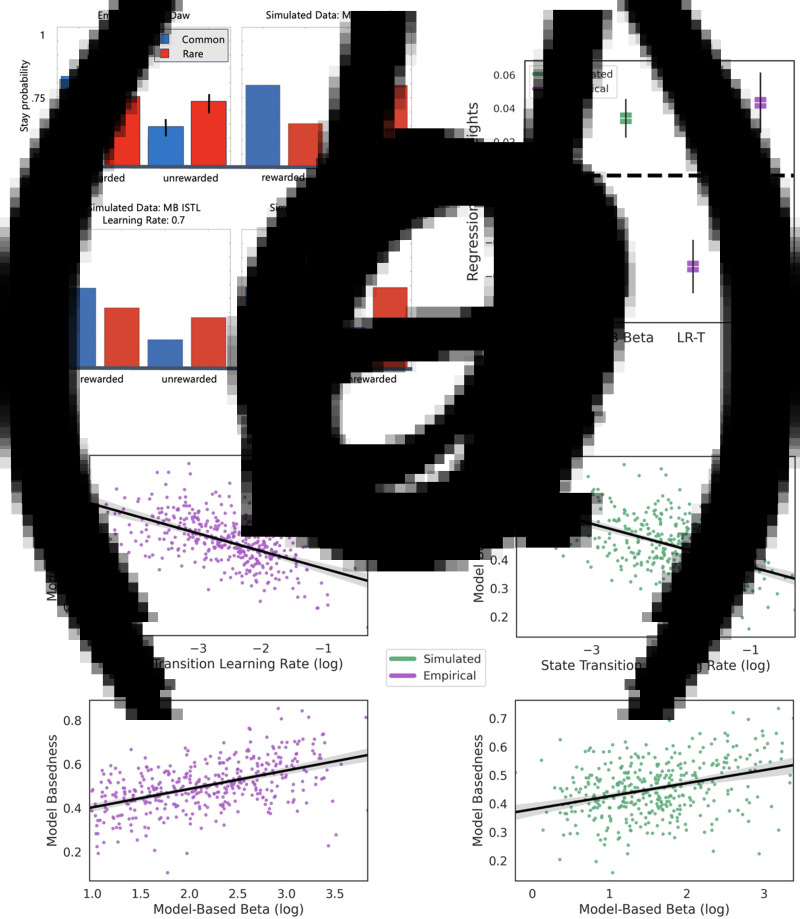
Methods: In Study 1 (n = 174), we designed a novel online task that isolated state transition learning from other facets of learning and planning. To determine whether this impairment is due to learning that is too fast or too slow, we estimated state transition learning rates by fitting computational models to two independent datasets, which tested learning in environments in which state transitions were either stable (Study 2: n = 1413) or changing (Study 3: n = 192).

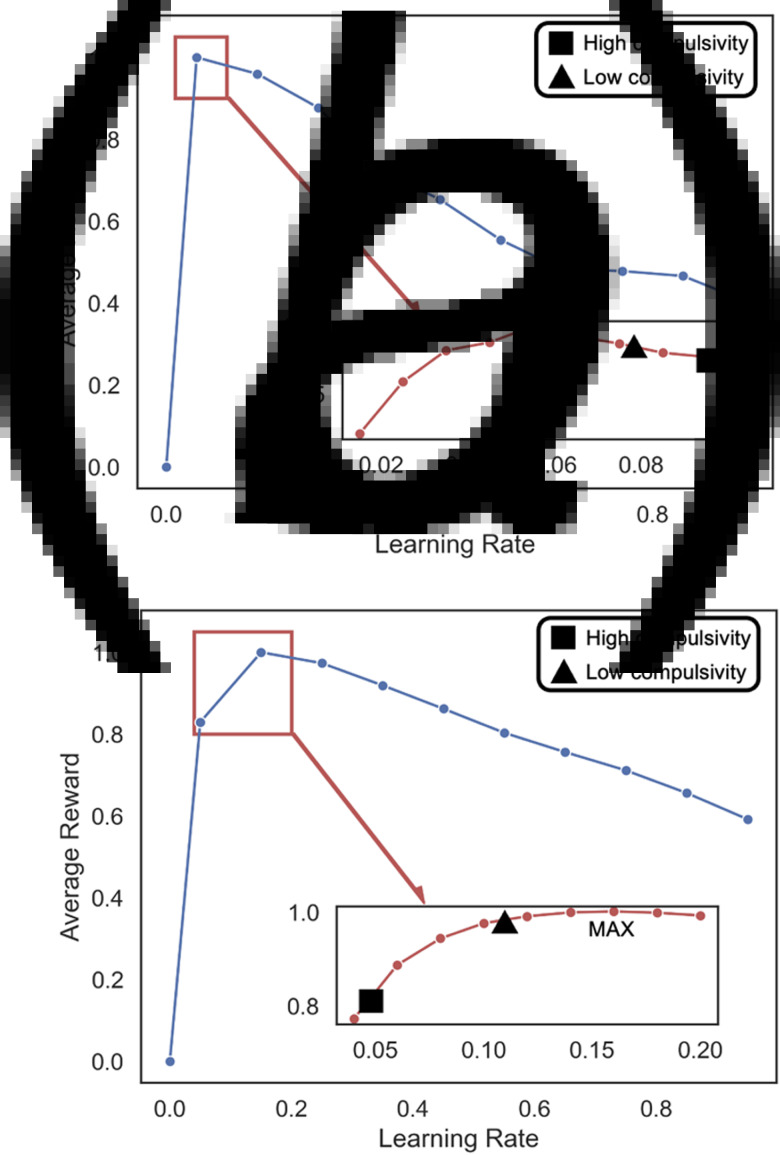
Results: Study 1 established that individuals with higher levels of compulsivity are more likely to demonstrate an impairment in state transition learning. Preliminary evidence here linked this impairment to a common factor comprising compulsivity and fear. Studies 2 and 3 showed that compulsivity is associated with learning that is too fast when it should be slow (i.e. when state transition are stable) and too slow when it should be fast (i.e. when state transitions change).

Conclusions: Together, these findings indicate that compulsivity is associated with a dysregulation of state transition learning, wherein the rate of learning is not well adapted to the task environment. Thus, dysregulated state transition learning might provide a key target for therapeutic intervention in compulsivity.

Keywords: Anxiety; compulsivity; computational modelling; model-based learning; transdiagnostic.


Conflict of interest statement

None.

Figures

Fig. 1.
Fig. 1.
Study 1: one-step revaluation task learning phase. Participants played a one-step revaluation task where two actions could each lead to three possible states. Depicted here is the learning phase wherein participants were instructed to take an action (pressing either 1 or 0), and observe to which of three possible states (each denoted by an emotionally-neutral image) their action led. Each action led to each of the three images with different probabilities. The red arrows above symbolize transitions from action 1, and blue arrows from action 0. The thick arrow indicates the common transition, occurring 5/10 times (per action), the middle-thickness dashed arrow indicates the uncommon transition, occurring 3/10 times, and the thinnest dashed arrows the rarest transitions, occurring 2/10 times. Participants chose each action 10 times, and saw an ‘irrelevant’ image of either neutral or emotional valence presented before the outcome state. The instructions clarified these additional images were irrelevant and should be ignored. Irrelevant images were displayed for 500 msec. Analyses revealed a lack of a role of these irrelevant images on the relationship between psychopathology and state transition learning.
Fig. 2.
Fig. 2.
Study 1: transition learning and psychopathology. (a) Correlations between psychopathology dimensions, transdiagnostic factors, and choice behavior. The left plot comprises correlations between psychopathology dimensions (denoted by their associated questionnaire's abbreviation), transdiagnostic factors derived from exploratory factor analysis, and how well participants learned state transitions. We outline in green the two significant associations involving transition learning in the task, and plot the raw data comprising these correlations in the middle and right plots (p < 0.05). (b) Exploratory factor analysis of psychopathology dimensions. Left is the scree plot showing that variance explained plateaus after the first three factors. The eigenvalues for the three components were 16.70, 5.50, and 4.70 for the Negative Distress, Worry, and OC-Fear factors, respectively. The bottom bar plots show the composition of each of these factors in terms of the factor loading of each individual question from all five questionnaires used. Each questionnaire is denoted by a different color. Note, the dataset met both the Bartlett's test of sphericity (p ≤ 0.001) and Kaiser-Meyer-Olkin test of sampling adequacy (KMO = 0.83). (c) Posterior density plots estimating the effects of the three latent psychopathology factors on transition learning. The black bar denotes the ROPE and the yellow bar the 95% HDI. Only the OC-Fear components has the ROPE entirely outside its HDI. The width of the ROPE was defined as 10% of the standard deviation of the posterior distribution (i.e.±0.01).
Fig. 3.
Fig. 3.
Study 2: state transition learning rate and model-based behavior in the two-step task. (a) A high state transition learning rate can produce behavior resembling compromised model-based control. The plots show the proportion of times a participant (real or simulated) engaged the same action they deployed in the preceding trial (‘Stay probability’) conditioned on whether or not one's prior action was followed by a common or rare state transition and whether reward was administered. The behavioral signature of model-basedness is shown in the top right plot (Simulated Data: MB Typical). The deviation of Daw et al.'s real data (top left panel) from this signature was deemed to reflect reduced utilization of intact transition matrix knowledge when making decisions, relative to a competing model-free system. The bottom row depicts simulations of the ISTL algorithm which gradually learns the transition matrix from experienced state prediction errors. The bottom left plot shows that the same qualitative pattern found in Daw et al.'s empirical data (top left) can emerge due to a fast transition learning rate, even in the absence of a putative model-free system. (b) Model-basedness as a function of transition learning rate and model-based β in empirical data. Model-basedness quantifies the degree to which participants complied with the behavioral signature of model-based choice as shown in panel A (e.g. switching after a rare transition was rewarded; see Methods). The top subplot reflects how model-basedness inversely covaries with state transition learning rate whereas the bottom subplot shows the positive relationship between model-basedness and model-based β. Both were generated using a subsample of participants with high (>2.5) model-based control. (c) Model-basedness as a function of transition learning rate and model-based β in simulated data. As a post-predictive check, we simulated the data using the winning ISTL model and best-fitting parameters, which generated the same effects as the empirical data in (c). (d) Regression weights of computational parameters in explaining model-basedness.
Fig. 4.
Fig. 4.
Compulsivity-associated state transition learning rates are suboptimal. (a) Compulsivity is associated with sub-optimally fast state transition learning in a stable environment (Study 2). We simulated agents that played the exact same task as described in Gillan et al. (2016) and plot the min-max normalized average reward. We instantiated agents with a model-based β weight that maximized reward earned but was still within the tail of the empirical range, using a selection procedure for extreme values in skewed distributions (Rousseeuw & Hubert, 2011). We set all other parameters to their group-fitted medians for distributions that were highly skewed (z-score >4, which was the lowest among statistically significant z-scores), and group-fitted means otherwise. Agents played the game 100 000 times with different state transition learning rates [sampling from (0,1) in increments of 0.1; main plot], and 1 000 000 times within a region of interest around the optimal and empirical learning rates (denoted by red box) for increased precision. The low- and high-compulsivity groups included participants scoring <–1 and >1 on the standardized scale of compulsivity factor derived in Gillan et al. (2016). Medians from each group (due to their skew) are plotted on the inset plots. (b) Compulsivity is associated with sub-optimally slow state transition learning in a changing environment (Study 3). Plots were generated using the procedure described in panel A, here applied to the Study 3 model.

References

    1. Altman, E. G., Hedeker, D., Peterson, J. L., & Davis, J. M. (1997). The Altman self-rating mania scale. Biological Psychiatry, 42(10), 948–955. - PubMed
    1. Alvares, G. A., Balleine, B. W., & Guastella, A. J. (2014). Impairments in goal-directed actions predict treatment response to cognitive-behavioral therapy in social anxiety disorder. PLoS ONE, 9(4), e94778. - PMC - PubMed
    1. Anwyl-Irvine, A. L., Massonnié, J., Flitton, A., Kirkham, N., & Evershed, J. K. (2020). Gorilla in our midst: An online behavioral experiment builder. Behavior Research Methods, 52(1), 388–407. - PMC - PubMed
    1. Bandura, A. (1978). Reflections on self-efficacy. Advances in Behavior Research and Therapy, 1(4), 237–269.
    1. Beck, A. T., Steer, R. A., & Brown, G. K. (1996). Beck depression inventory-II. San Antonio, 78(2), 490–498.

Publication types