. 2023 Jun 12;15(11):4667-4684.
doi: 10.18632/aging.204793. Epub 2023 Jun 12.

Identification of novel genes associated with exercise and calorie restriction effects in skeletal muscle

Affiliations

Identification of novel genes associated with exercise and calorie restriction effects in skeletal muscle

Jae Sook Kang et al. Aging (Albany NY). .

Abstract

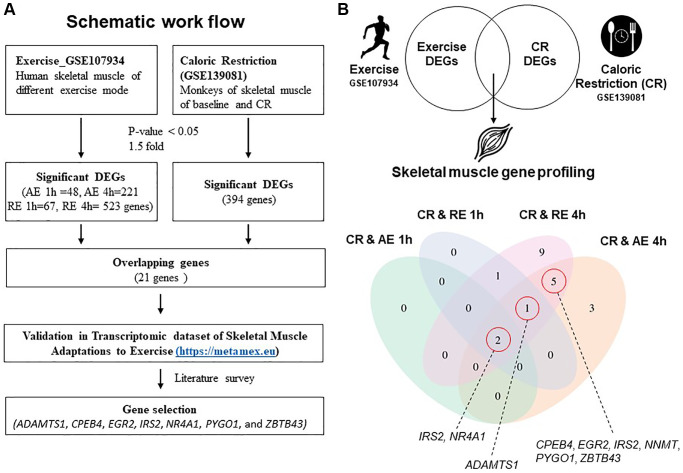
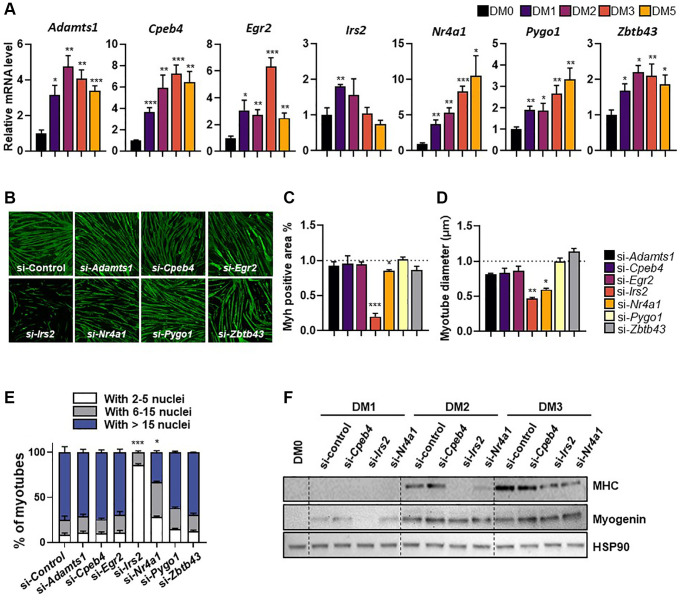
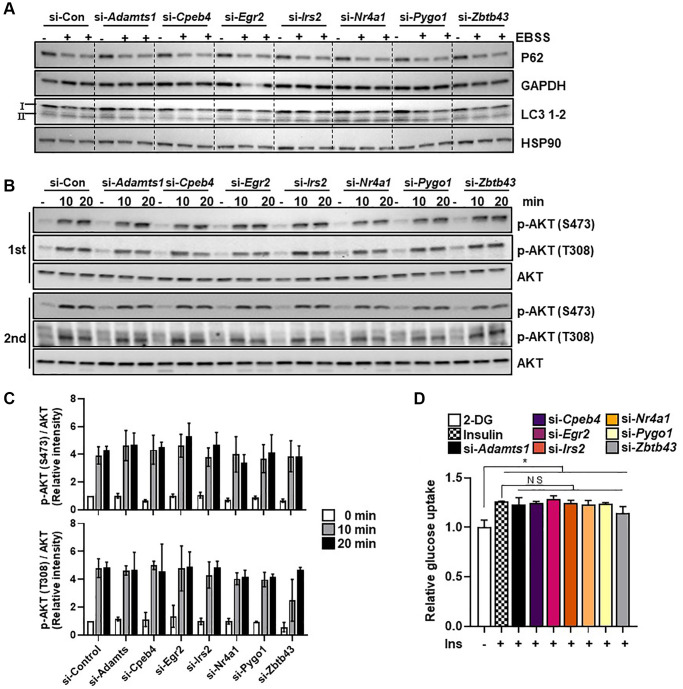
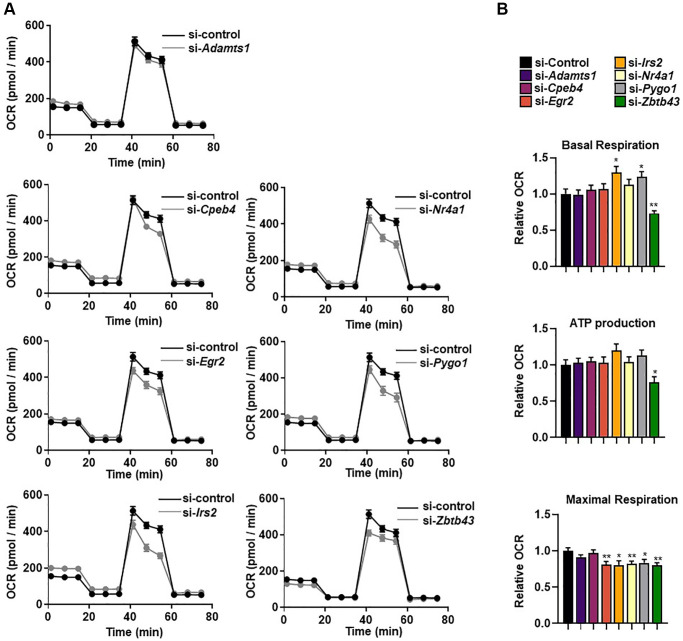
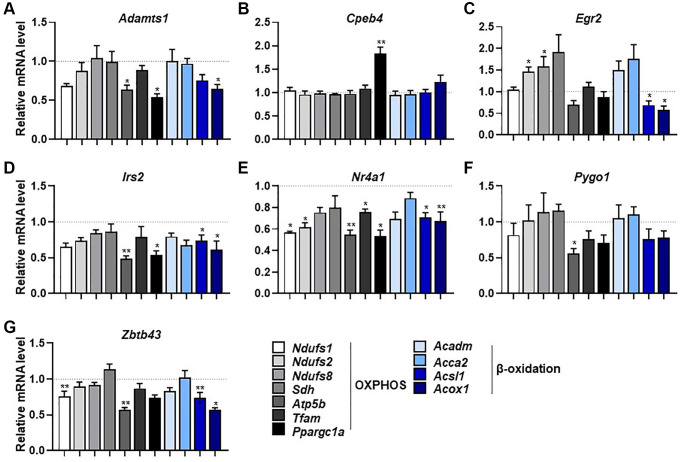
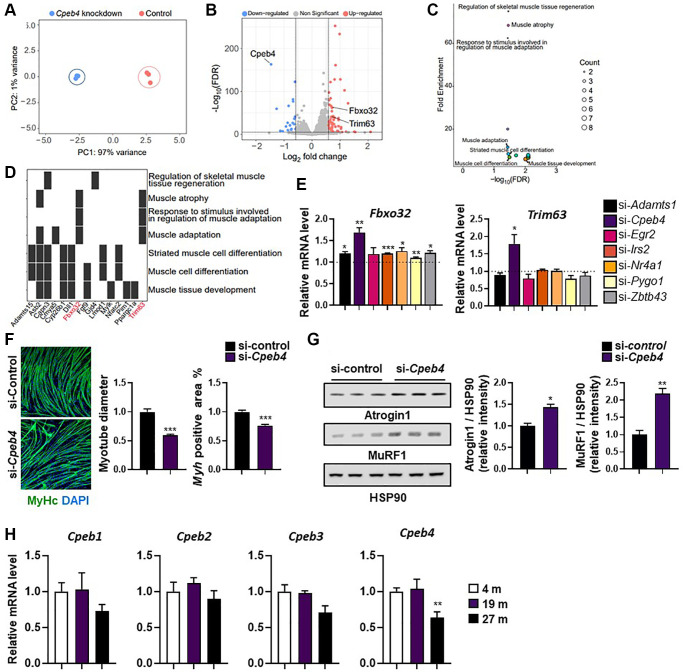
Exercise and caloric restriction (CR) significantly increase longevity across a range of species and delay aging-related losses in organ function. Although both interventions enhance skeletal muscle function, the molecular mechanisms underlying these associations are unknown. We sought to identify genes regulated by CR and exercise in muscle, and investigate their relationship with muscle function. To do this, expression profiles of Gene Expression Omnibus datasets obtained from the muscle tissue of calorie-restricted male primates and young men post-exercise were analyzed. There were seven transcripts (ADAMTS1, CPEB4, EGR2, IRS2, NR4A1, PYGO1, and ZBTB43) that were consistently upregulated by both CR and exercise training. We used C2C12 murine myoblasts to investigate the effect of silencing these genes on myogenesis, mitochondrial respiration, autophagy, and insulin signaling, all of which are processes affected by CR and exercise. Our results show that in C2C12 cells, Irs2 and Nr4a1 expression were critical for myogenesis, and five genes (Egr2, Irs2, Nr4a1, Pygo1, and ZBTB43) regulated mitochondrial respiration while having no effect on autophagy. Cpeb4 knockdown increased the expression of genes involved in muscle atrophy and induced myotube atrophy. These findings suggest new resources for studying the mechanisms underlying the beneficial effects of exercise and calorie restriction on skeletal muscle function and lifespan extension.

Keywords: calorie restriction; exercise; insulin sensitivity; mitochondrial respiration; muscle atrophy; myogenesis.


Conflict of interest statement

CONFLICTS OF INTEREST: The authors declare no conflicts of interest related to this study.

Figures

Figure 1
Figure 1
Schematic workflow and gene profiling in skeletal muscle. (A) Schematic workflow of analysis using GSE107934 and GSE139081 datasets. (B) Significantly regulated genes from exercise and CR presented in a Venn diagram. Abbreviations: AE: aerobic exercise; CR: caloric restriction; DEG: differentially expressed gene; RE: resistance exercise.
Figure 2
Figure 2
Expression patterns of selected genes during differentiation of C2C12 myotubes. (A) Relative gene expression of target genes in differentiating C2C12 cells at 0-, 1-, 2-, 3-, and 5-days post-induction. mRNA levels were normalized to 36b4 mRNA levels, as measured by qPCR analysis. The data are represented as mean ± SEM. Statistically significant differences are denoted as *p < 0.05, **p < 0.01, ***p < 0.005 vs. DM0. (B) Representative images of myosin heavy chain (MHC; green) immunostaining in myoblasts transfected with target genes and differentiated for 5 days. (C) Quantification of myotube myosin-positive (Myh+) areas, (D) myotube diameter, and (E) fusion index. (F) Western blot showing expression of MHC and myogenin, differentiation markers, during differentiation (0-, 1-, 2-, and 3-days). The data are represented as mean ± SEM. Statistically significant differences are denoted as *p < 0.05, **p < 0.01, ***p < 0.005 vs. si-Con.
Figure 3
Figure 3
Selected genes do not regulate starvation-induced autophagy. (A) C2C12 myotube cells were transfected with selected genes or control siRNAs and exposed to EBSS for 6 h to induce autophagy. The autophagy markers LC3B-1/2 and P62 were measured in protein extracts using western blot analysis; GAPDH and HSP90 were used as loading controls. (B) The insulin signaling molecules p-AKT and AKT (C) were quantified using western blot analysis and densitometry (n = 3). (D) Glucose uptake in C2C12 myotubes transfected with selected genes (n = 3). All data are represented as mean ± SEM. Statistically significant differences are denoted as *p < 0.05, **p < 0.01, ***p < 0.005.
Figure 4
Figure 4
Selected genes regulate mitochondrial respiration. (A) The real-time oxygen consumption rate (OCR) of selected gene-transfected C2C12 myotubes was determined using a Seahorse XFe96 analyzer. (B) The area under the curve (AUC) values of basal respiration, ATP-linked respiration, and maximal mitochondrial respiration. OCRs were normalized to total cellular protein. All data are represented as mean ± SEM. Statistically significant differences are denoted as *p < 0.05, **p < 0.01, ***p < 0.005.
Figure 5
Figure 5
Selected genes regulate mitochondrial respiration and β-oxidation-associated gene expression. (AG) mRNA expression of mitochondrial respiration-related genes (Ndufs1, Ndufs2, Ndufs8, Sdh, Atp5b, Tfam, and Ppargc1a) and β-oxidation-related genes (Acadm, Acca2, Acsl1, and Acox1) measured by qPCR in C2C12 myotubes with knockdown of selected genes (n = 3). All data are represented as mean ± SEM. Statistically significant differences are denoted as *p < 0.05, **p < 0.01, ***p < 0.005.
Figure 6
Figure 6
Knockdown of Cpeb4 induces atrophy in C2C12 myotubes. (A) Principal component analysis (PCA) of RNA-seq datasets from C2C12 myotubes for control and Cpeb4-knockdown cells. (B) Volcano plot of differential expression analysis. (C) Summarized gene ontology terms related to biological processes. (D) Functional annotation clustering using Database for Annotation, Visualization, and Integrated Discovery. (E) mRNA expression of genes related to muscle wasting (Fbxo32, Trim63), measured by qPCR. (F) Representative image of myosin-stained Cpeb4 knockdown (si-Cpeb4) or control siRNA-treated (si-control) myotubes differentiated for 5 days. Quantification of myotube diameter and myosin-positive (Myh+) area. (G) Western blot showing expression of atrophy-related protein levels (Atrogin-1 (Fbxo32) and MuRF-1 (Trim63)) and quantification of target protein expression relative to HSP90 using densitometry analysis (n = 3). (H) Relative mRNA level of different Cpeb isoforms (Cpeb1–4) in the tibialis anterior muscle in young (4-month-old) and aged mice (19- and 27-month-old; (n = 4, 5). All data are represented as mean ± SEM. Statistically significant differences are denoted as *p < 0.05, **p < 0.01, ***p < 0.005.

References

    1. Mahmoudi S, Xu L, Brunet A. Turning back time with emerging rejuvenation strategies. Nat Cell Biol. 2019; 21:32–43. 10.1038/s41556-018-0206-0 - DOI - PMC - PubMed
    1. Balasubramanian P, Howell PR, Anderson RM. Aging and Caloric Restriction Research: A Biological Perspective With Translational Potential. EBioMedicine. 2017; 21:37–44. 10.1016/j.ebiom.2017.06.015 - DOI - PMC - PubMed
    1. McGee SL, Hargreaves M. Exercise adaptations: molecular mechanisms and potential targets for therapeutic benefit. Nat Rev Endocrinol. 2020; 16:495–505. 10.1038/s41574-020-0377-1 - DOI - PubMed
    1. Saito Y, Chikenji TS, Matsumura T, Nakano M, Fujimiya M. Exercise enhances skeletal muscle regeneration by promoting senescence in fibro-adipogenic progenitors. Nat Commun. 2020; 11:889. 10.1038/s41467-020-14734-x - DOI - PMC - PubMed
    1. Severinsen MCK, Pedersen BK. Muscle-Organ Crosstalk: The Emerging Roles of Myokines. Endocr Rev. 2020; 41:594–609. 10.1210/endrev/bnaa016 - DOI - PMC - PubMed

Publication types

Substances