A Photomodulable Bacteriophage-Spike Nanozyme Enables Dually Enhanced Biofilm Penetration and Bacterial Capture for Photothermal-Boosted Catalytic Therapy of MRSA Infections
- PMID: 37310410
- PMCID: PMC10460864
- DOI: 10.1002/advs.202301694
A Photomodulable Bacteriophage-Spike Nanozyme Enables Dually Enhanced Biofilm Penetration and Bacterial Capture for Photothermal-Boosted Catalytic Therapy of MRSA Infections
Abstract
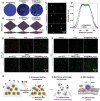
Nanozymes, featuring intrinsic biocatalytic effects and broad-spectrum antimicrobial properties, are emerging as a novel antibiotic class. However, prevailing bactericidal nanozymes face a challenging dilemma between biofilm penetration and bacterial capture capacity, significantly impeding their antibacterial efficacy. Here, this work introduces a photomodulable bactericidal nanozyme (ICG@hMnOx ), composed of a hollow virus-spiky MnOx nanozyme integrated with indocyanine green, for dually enhanced biofilm penetration and bacterial capture for photothermal-boosted catalytic therapy of bacterial infections. ICG@hMnOx demonstrates an exceptional capability to deeply penetrate biofilms, owing to its pronounced photothermal effect that disrupts the compact structure of biofilms. Simultaneously, the virus-spiky surface significantly enhances the bacterial capture capacity of ICG@hMnOx . This surface acts as a membrane-anchored generator of reactive oxygen species and a glutathione scavenger, facilitating localized photothermal-boosted catalytic bacterial disinfection. Effective treatment of methicillin-resistant Staphylococcus aureus-associated biofilm infections is achieved using ICG@hMnOx , offering an appealing strategy to overcome the longstanding trade-off between biofilm penetration and bacterial capture capacity in antibacterial nanozymes. This work presents a significant advancement in the development of nanozyme-based therapies for combating biofilm-related bacterial infections.
Keywords: antibacterial therapy; bacterial capture; biofilm penetration; nanozyme; nature-inspired nanostructures.
© 2023 The Authors. Advanced Science published by Wiley-VCH GmbH.
Conflict of interest statement
The authors declare no conflict of interest.
Figures


Similar articles
-
Bacteriophage infection drives loss of β-lactam resistance in methicillin-resistant Staphylococcus aureus.Elife. 2025 Jul 10;13:RP102743. doi: 10.7554/eLife.102743. Elife. 2025. PMID: 40637714 Free PMC article.
-
Deciphering the dynamics of methicillin-resistant Staphylococcus aureus biofilm formation: from molecular signaling to nanotherapeutic advances.Cell Commun Signal. 2024 Mar 22;22(1):188. doi: 10.1186/s12964-024-01511-2. Cell Commun Signal. 2024. PMID: 38519959 Free PMC article. Review.
-
Multi-enzymatic biomimetic cerium-based MOFs mediated precision chemodynamic synergistic antibacteria and tissue repair for MRSA-infected wounds.J Nanobiotechnology. 2025 May 20;23(1):364. doi: 10.1186/s12951-025-03349-3. J Nanobiotechnology. 2025. PMID: 40394650 Free PMC article.
-
Efficacy Evaluation and Mechanism Study of Nonantibiotic Nanoplatform for Clearing MRSA.Mol Pharm. 2025 Jul 7;22(7):3836-3847. doi: 10.1021/acs.molpharmaceut.5c00097. Epub 2025 Jun 6. Mol Pharm. 2025. PMID: 40478174
-
Interventions for the eradication of meticillin-resistant Staphylococcus aureus (MRSA) in people with cystic fibrosis.Cochrane Database Syst Rev. 2018 Jul 21;7(7):CD009650. doi: 10.1002/14651858.CD009650.pub4. Cochrane Database Syst Rev. 2018. Update in: Cochrane Database Syst Rev. 2022 Dec 13;12:CD009650. doi: 10.1002/14651858.CD009650.pub5. PMID: 30030966 Free PMC article. Updated.
Cited by
-
Near infrared II excitation nanoplatform for photothermal/chemodynamic/antibiotic synergistic therapy combating bacterial biofilm infections.J Nanobiotechnology. 2023 Nov 24;21(1):446. doi: 10.1186/s12951-023-02212-7. J Nanobiotechnology. 2023. PMID: 38001486 Free PMC article.
-
Stimuli-responsive nanozymes for wound healing: From design strategies to therapeutic advances.Mater Today Bio. 2025 Jul 2;33:102046. doi: 10.1016/j.mtbio.2025.102046. eCollection 2025 Aug. Mater Today Bio. 2025. PMID: 40688673 Free PMC article. Review.
-
Intelligent ROS therapy driven by iron-based nanozyme with controllable catalytic activity for infected wound healing.J Nanobiotechnology. 2025 Jun 19;23(1):456. doi: 10.1186/s12951-025-03495-8. J Nanobiotechnology. 2025. PMID: 40537805 Free PMC article.
-
Procedural Promotion of Multiple Stages in the Wound Healing Process by Graphene-Spiky Silica Heterostructured Nanoparticles.Int J Nanomedicine. 2023 Nov 10;18:6585-6599. doi: 10.2147/IJN.S426552. eCollection 2023. Int J Nanomedicine. 2023. PMID: 38026527 Free PMC article.
-
Recent Progress and Prospect of Metal-Organic Framework-Based Nanozymes in Biomedical Application.Nanomaterials (Basel). 2024 Jan 23;14(3):244. doi: 10.3390/nano14030244. Nanomaterials (Basel). 2024. PMID: 38334515 Free PMC article. Review.
References
-
- a) Sauer K., Stoodley P., Goeres D. M., Hall‐Stoodley L., Burmølle M., Stewart P. S., Bjarnsholt T., Nat. Rev. Microbiol. 2022, 20, 608; - PMC - PubMed
- b) Karygianni L., Ren Z., Koo H., Thurnheer T., Trends Microbiol. 2020, 28, 668; - PubMed
- c) Flemming H.‐C., van Hullebusch E. D., Neu T. R., Nielsen P. H., Seviour T., Stoodley P., Wingender J., Wuertz S., Nat. Rev. Microbiol. 2023, 21, 70. - PubMed
-
- Ciofu O., Moser C., Jensen P. Ø., Høiby N., Nat. Rev. Microbiol. 2022, 20, 621. - PubMed
Publication types
MeSH terms
Substances
Grants and funding
- 2022YFB3203801/National Key Research and Development Program of China
- 2022YFB3203804/National Key Research and Development Program of China
- 2022YFB3203800/National Key Research and Development Program of China
- 32071374/National Natural Science Foundation of China
- 32201161/National Natural Science Foundation of China
- 21XD1422100/Program of Shanghai Academic Research Leader under the Science and Technology Innovation
- 22TS1400700/Explorer Program of Science and Technology Commission of Shanghai Municipality
- LR22C100001/Zhejiang Provincial Natural Science Foundation of China
- LQ21H300004/Zhejiang Provincial Natural Science Foundation of China
- GF22H168862/Zhejiang Provincial Natural Science Foundation of China
- SHSMU-ZDCX20210900/Innovative Research Team of High-Level Local Universities in Shanghai
- 00004F1RCYJ2209/Hangzhou Medical College Qiuzhen Talent Project
- KYZD202205/Basic Scientific Research Funds of Department of Education of Zhejiang Province
- 2021438429/Health Bureau of Zhejiang Province/General Program
- 2023ZF122/Zhejiang Traditional Chinese Medicine Science and Technology Program
- 2021C03041/Zhejiang Provincial Key Scientific Project
- JCTD-2020-08/CAS Interdisciplinary Innovation Team
LinkOut - more resources
Full Text Sources
Medical
