. 2023 May;22(5):1129-1176.
doi: 10.1007/s43630-023-00369-6. Epub 2023 Jun 13.

Changes in tropospheric air quality related to the protection of stratospheric ozone in a changing climate

Affiliations

Changes in tropospheric air quality related to the protection of stratospheric ozone in a changing climate

S Madronich et al. Photochem Photobiol Sci. 2023 May.

Abstract

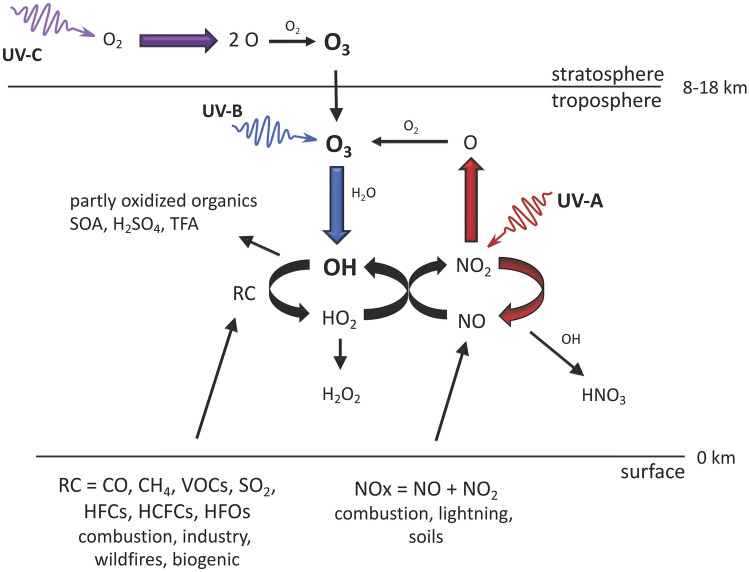
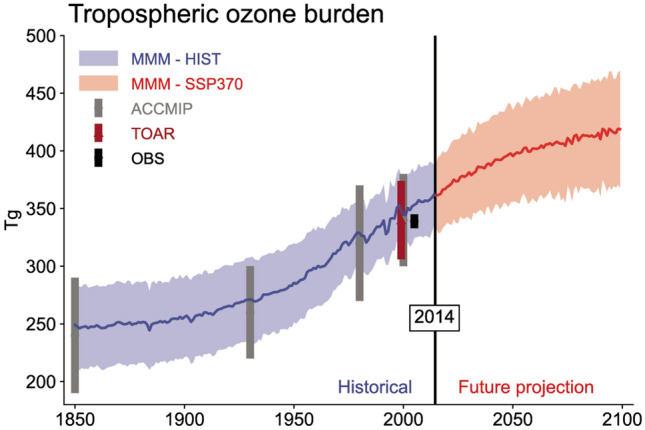
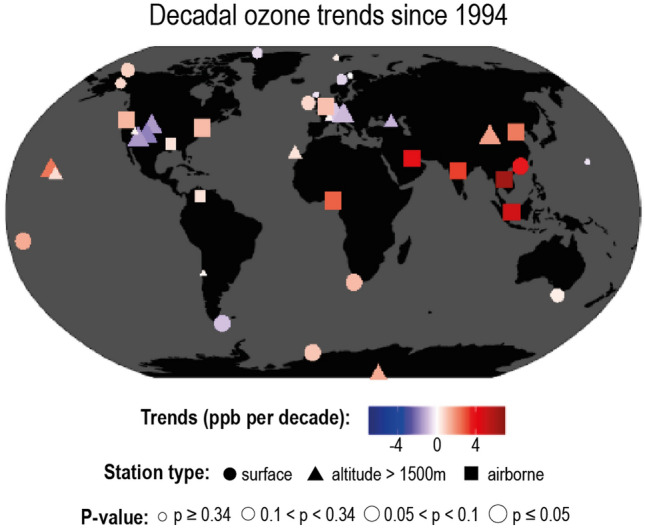
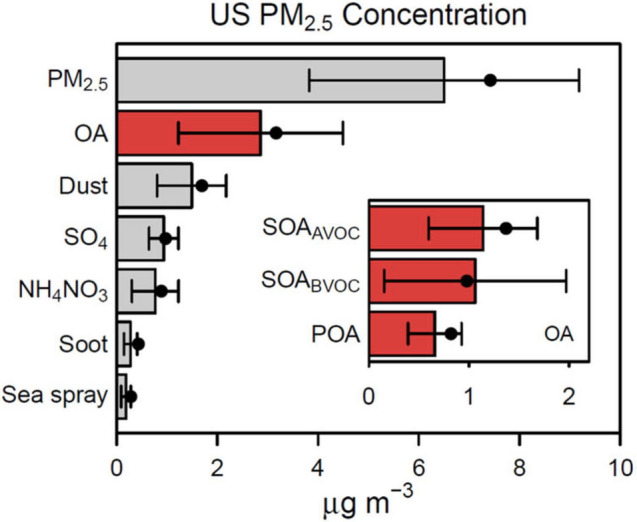
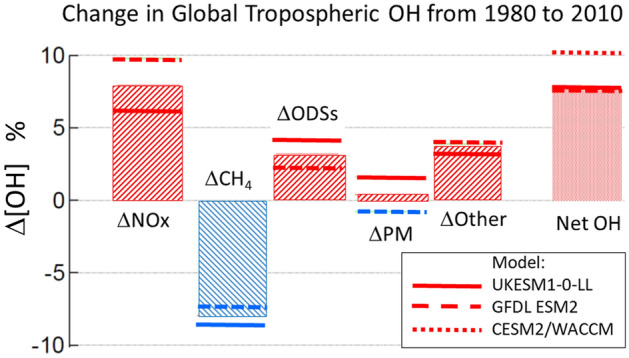
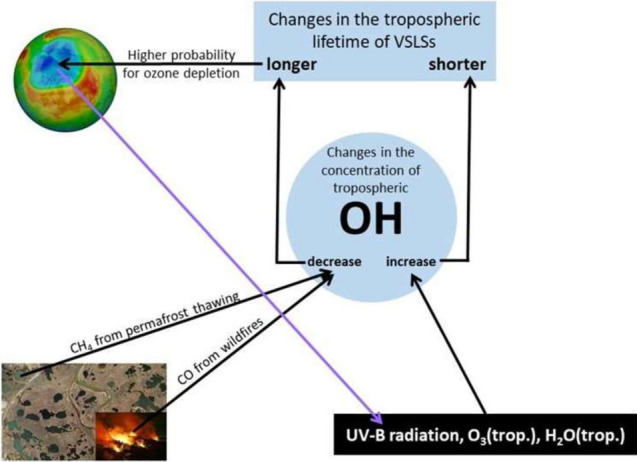
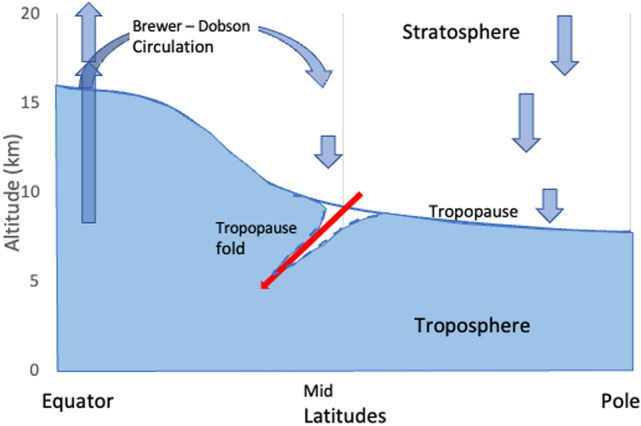
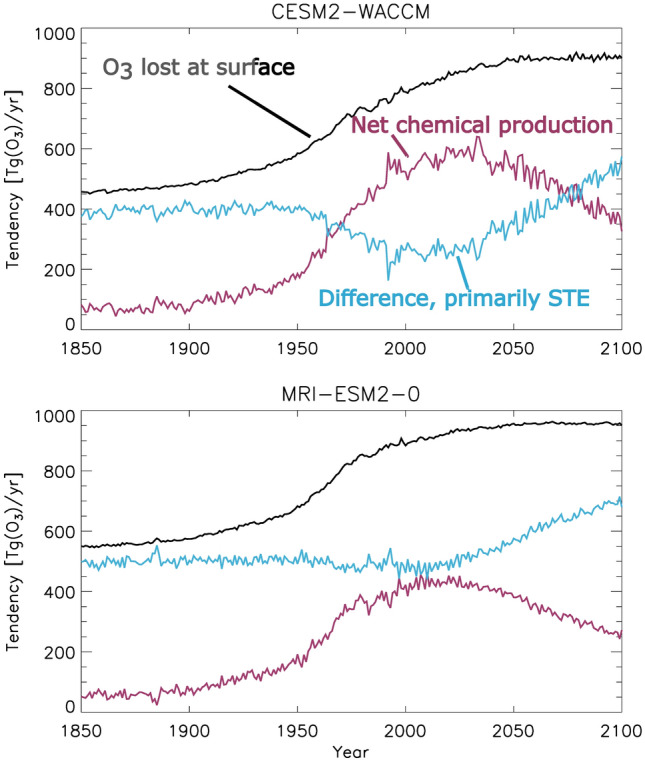
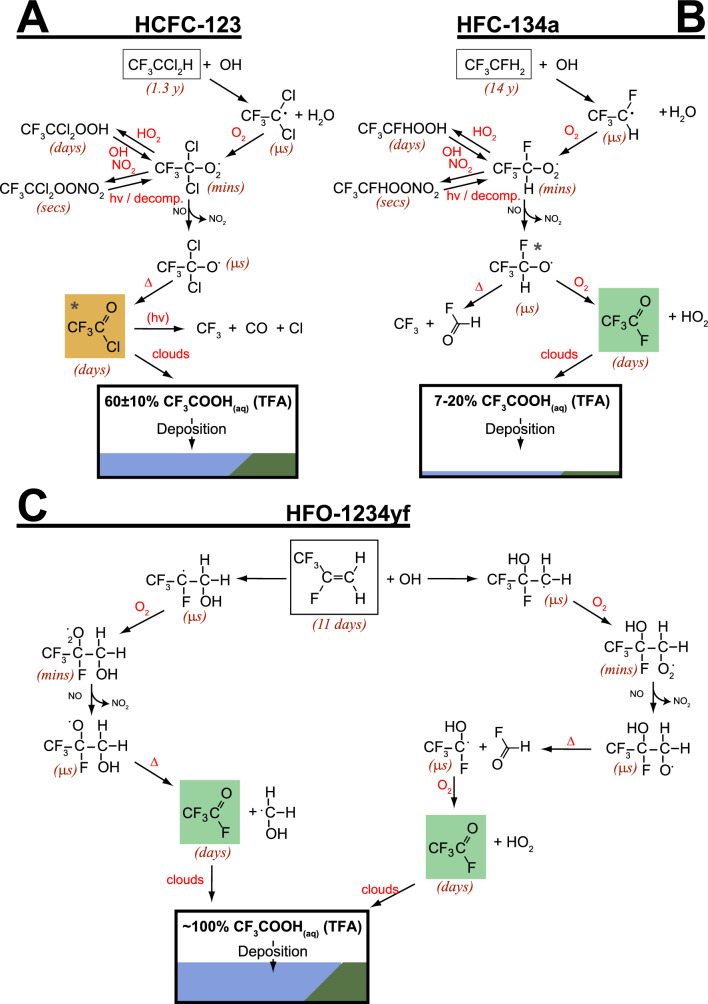
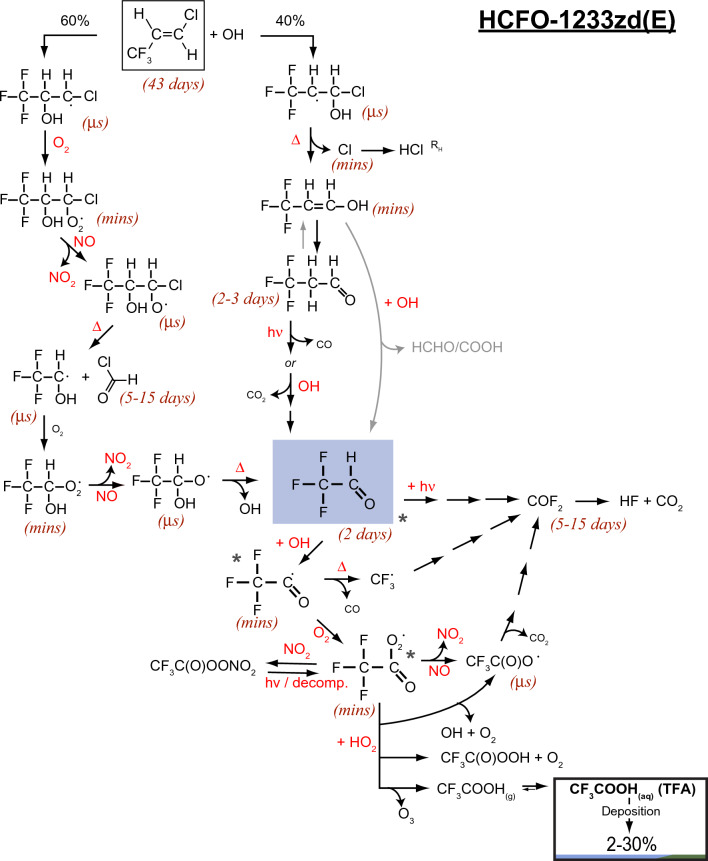
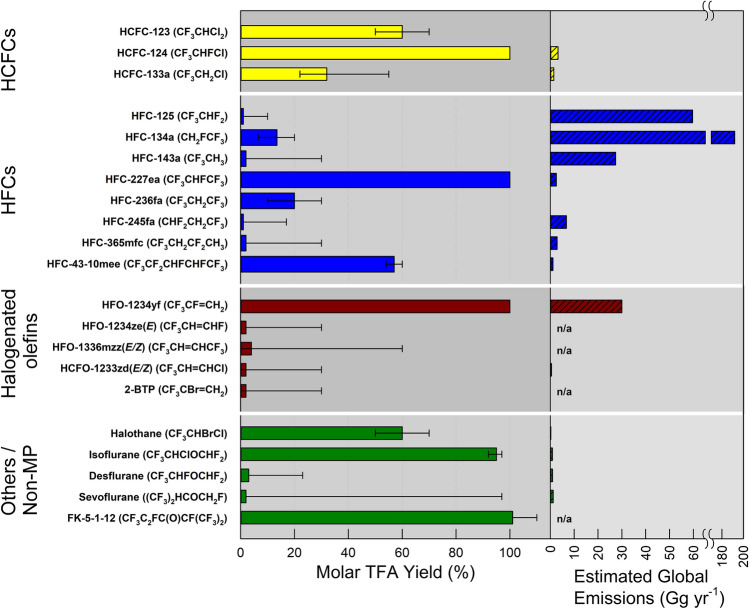
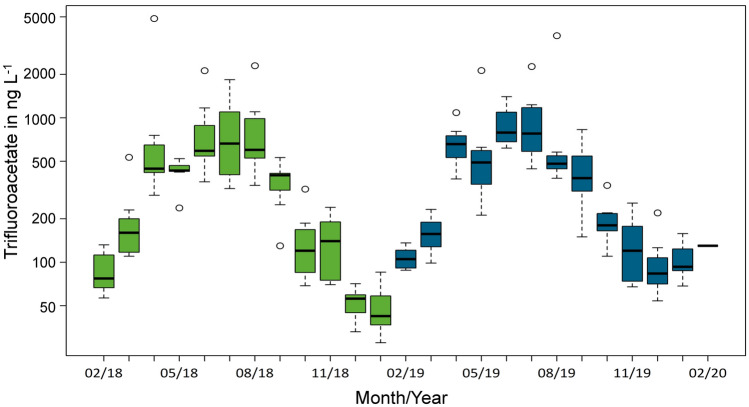
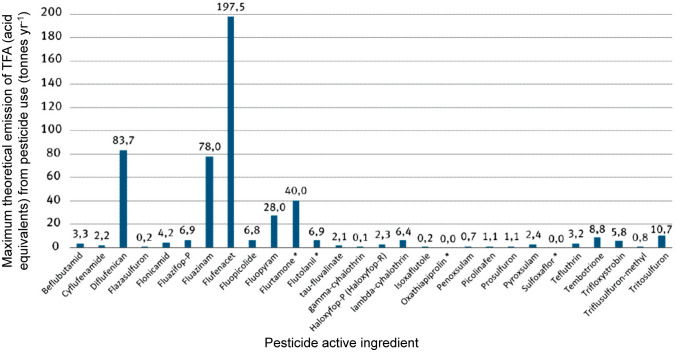
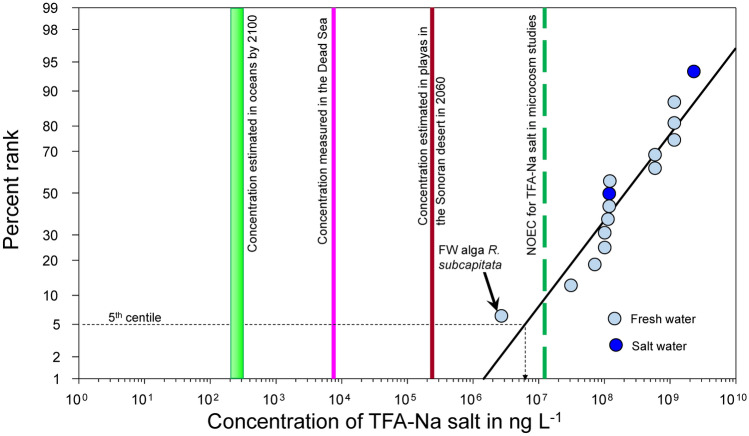
Ultraviolet (UV) radiation drives the net production of tropospheric ozone (O3) and a large fraction of particulate matter (PM) including sulfate, nitrate, and secondary organic aerosols. Ground-level O3 and PM are detrimental to human health, leading to several million premature deaths per year globally, and have adverse effects on plants and the yields of crops. The Montreal Protocol has prevented large increases in UV radiation that would have had major impacts on air quality. Future scenarios in which stratospheric O3 returns to 1980 values or even exceeds them (the so-called super-recovery) will tend to ameliorate urban ground-level O3 slightly but worsen it in rural areas. Furthermore, recovery of stratospheric O3 is expected to increase the amount of O3 transported into the troposphere by meteorological processes that are sensitive to climate change. UV radiation also generates hydroxyl radicals (OH) that control the amounts of many environmentally important chemicals in the atmosphere including some greenhouse gases, e.g., methane (CH4), and some short-lived ozone-depleting substances (ODSs). Recent modeling studies have shown that the increases in UV radiation associated with the depletion of stratospheric ozone over 1980-2020 have contributed a small increase (~ 3%) to the globally averaged concentrations of OH. Replacements for ODSs include chemicals that react with OH radicals, hence preventing the transport of these chemicals to the stratosphere. Some of these chemicals, e.g., hydrofluorocarbons that are currently being phased out, and hydrofluoroolefins now used increasingly, decompose into products whose fate in the environment warrants further investigation. One such product, trifluoroacetic acid (TFA), has no obvious pathway of degradation and might accumulate in some water bodies, but is unlikely to cause adverse effects out to 2100.


Conflict of interest statement

The authors have no conflicts of interest.

Figures

Fig. 1
Fig. 1
Simplified schematic of tropospheric photochemistry. UV-C radiation (100–280 nm) in the stratosphere generates ozone, O3, some of which is transported to the troposphere. UV-B radiation initiates tropospheric chemistry by photo-dissociating O3 and generating highly reactive hydroxyl radicals (OH). These react with many compounds emitted by human activities and natural processes, e.g., carbon monoxide, methane, volatile organic compounds including halocarbons, and others, all generalized in the figure as RC (reduced compounds). By removing these compounds, the concentration of OH controls the self-cleaning capacity of the atmosphere. Nitrogen oxides (NOx = NO + NO2) catalyze the photo-oxidation by regenerating OH via reaction of NO with HO2. This coupling of the NOx and HOx (OH + HO2) cycles also leads to autocatalytic production of O3, often in amounts larger than lost initially via its UV-B photolysis, since NOx and HOx molecules can cycle many times before being removed. The cycles are terminated by reaction with OH to make nitric acid, (HNO3) or by reaction of HO2 to inorganic or organic peroxides, e.g., hydrogen peroxide (H2O2). Other products, depending on the reduced compounds being oxidized by OH, could include partly oxidized organics, secondary organic aerosols (SOA), sulfuric acid (H2SO4), and trifluoroacetic acid (TFA)
Fig. 2
Fig. 2
Global tropospheric ozone (Tg) estimated by multi-model assessments (MMM, ACCMIP, TOAR) and observations (OBS, for the year 2000). Future projections are for one Shared Socioeconomic Pathway (SSP370 scenario). From IPCC 2021 Ch. 6 [11]
Fig. 3
Fig. 3
Regional and local trends in tropospheric ozone at the surface and lower atmosphere. From IPCC 2021 Ch. 6 [11]
Fig. 4
Fig. 4
Composition of PM2.5 over the contiguous United States calculated with a chemistry-transport model. Particles produced by UV photochemical reactions (secondary aerosols) include sulfate (SO4), ammonium nitrate (NH4NO3) and secondary organic aerosols (SOA) from anthropogenic or biogenic precursors (SOAAVOC and SOABVOC, respectively), and account for more than half of the total PM2.5, compared to directly emitted particles (primary aerosols) such as dust, soot, and sea spray. VOC, volatile organic compounds. From Pye et al. [46]
Fig. 5
Fig. 5
Sites at which air pollution can affect interactions mediated by olfactory or visual cues between plants and their associated community. A Effects of pollutants on signal-emitting organisms. B The degradation of VOCs by air pollutants and formation of reaction products and secondary organic aerosol (SOA). C Effects on the signal receiving organisms, e.g., pollinating insects. In addition, exposure to air pollution can influence the interactions between herbivores and plants. D From [134], reproduced with permission
Fig. 6
Fig. 6
Relative change in global concentrations of tropospheric OH from 1980 to 2020, estimated with three different Earth System Models (ESMs). The net change in OH (rightmost column) has contributions from increased emissions of nitrogen oxides and other precursors of tropospheric ozone (ΔNOx); increased emissions of methane (ΔCH4); accumulation of ozone-depleting substances now regulated under the Montreal Protocol (ΔODSs); emissions of particulate matter and its precursors (ΔPM); and other undifferentiated changes attributed to underlying climate change (e.g., water vapor), as well as interactions among these separate factors (ΔOther) (modified from [141])
Fig. 7
Fig. 7
Interacting effects of UV-B radiation and climate change on tropospheric concentrations of OH and on the lifetime of very-short-lived substances (VSLSs). Effects of climate change include more frequent wildfires and thawing of permafrost soils with the formation of thermokarst lakes, which are important sources of CO and CH4, respectively. Increased emissions of CO and CH4 tend to decrease the tropospheric OH concentration, which in turn results in longer lifetime of VSLSs and, thus, a higher probability of stratospheric ozone depletion
Fig. 8
Fig. 8
Schematic of the circulation of air into the stratosphere and its return. The general circulation is slow relative to movements in the troposphere. Tropopause folds (shown with a dotted blue line) occur sporadically and inject stratospheric air into the troposphere
Fig. 9
Fig. 9
Drivers of tropospheric ozone concentration (redrawn with permission and assistance from Guang Zeng from Fig. 13, in [158]). The deposition amount is directly related to the concentration of O3 at the surface of the Earth. The two panels represent the output of different chemistry–climate models considered in the study. STE, stratospheric–tropospheric exchange
Fig. 10
Fig. 10
Atmospheric degradation pathways and corresponding yields of TFA for HFCF-123 (A), HFC-134a (B) and HFO-1234yf (C) representing three generations of important CFC replacements. Approximate atmospheric lifetimes for the chemical species involved are indicated in parenthesis. Species marked by an asterisk have significant competing fates in the atmosphere [205, 206]
Fig. 11
Fig. 11
Atmospheric degradation of HCFO-1233zd. The OH-initiated oxidation of the product, CF3CHO, is a minor source of TFA. Based on [207] and [208]
Fig. 12
Fig. 12
Yields of TFA from selected individual chlorofluorocarbon (CFC) replacement compounds, and their estimated global emissions. Also included are selected compounds not under the purview of the Montreal Protocol and Amendments. Error bars represent both experimental uncertainties and upper and lower yield ranges due to competing reaction channels that depend on environmental conditions. Yields of TFA from individual compounds are estimated based on evaluations of the available literature as described in Online Resource SI Sect. 4. Note split scale for the emission for HFC-134a, which is much higher than those of other compounds
Fig. 13
Fig. 13
Concentration of trifluoroacetate in composite precipitation samples from eight sites in Germany from February 2018 to February 2020. The y-axis is on a binary logarithmic scale (log2) and the solid horizontal bar is the median, the box indicates the upper and lower quartiles, the whiskers the upper of lower quartile – or + the interquartile range × 1.5, and the data symbols are the outliers. From Fig. 27 in [220]
Fig. 14
Fig. 14
Maximum possible annual emissions of TFA from plant protection products in Germany for active ingredients that can theoretically form TFA. Data based on mean sales volume of each of the active substances over the three years 2016, 2017 and 2018 (Figure from [259])
Fig. 15
Fig. 15
A log-probability cumulative frequency plot of no observed effect concentrations (NOEC) of trifluoroacetic acid salt compared to various environmental concentrations in water. The dashed vertical green line indicates the NOEC for TFA-Na salt in microcosms is a toxicology-based criterion
None
None
None

References

    1. Tang X, Madronich S, Wallington T, Calamari D. Changes in tropospheric composition and air quality. Journal of Photochemistry and Photobiology B-Biology. 1998;46:83–95. doi: 10.1016/S1011-1344(98)00187-0. - DOI - PubMed
    1. Solomon KR, Tang X, Wilson SR, Zanis P, Bais AF. Changes in tropospheric composition and air quality due to stratospheric ozone depletion. Photochemical & Photobiological Sciences. 2003;2:62–67. doi: 10.1039/B211086E. - DOI - PubMed
    1. Wilson SR, Solomon KR, Tang X. Changes in tropospheric composition and air quality due to stratospheric ozone depletion and climate change. Photochemical & Photobiological Sciences. 2007;6:301–310. doi: 10.1039/B700022G. - DOI - PubMed
    1. Tang X, Wilson SR, Solomon KR, Shao M, Madronich S. Changes in tropospheric composition and air quality due to stratospheric ozone depletion and interactions with changes in climate. Photochemical & Photobiological Sciences. 2011;10:280–291. doi: 10.1039/C0PP90039G. - DOI - PubMed
    1. Madronich S, Shao M, Wilson SR, Solomon KR, Longstreth JD, Tang XY. Changes in air quality and tropospheric composition due to depletion of stratospheric ozone and interactions with changing climate: Implications for human and environmental health. Photochemical & Photobiological Sciences. 2015;14:149–169. doi: 10.1039/c4pp90037e. - DOI - PubMed

LinkOut - more resources