. 2023 Jun 27;95(25):9581-9588.
doi: 10.1021/acs.analchem.3c01085. Epub 2023 Jun 13.

DiffN Selection of Tandem Mass Spectrometry Precursors

Affiliations

DiffN Selection of Tandem Mass Spectrometry Precursors

Tyler S Larson et al. Anal Chem. .

Abstract

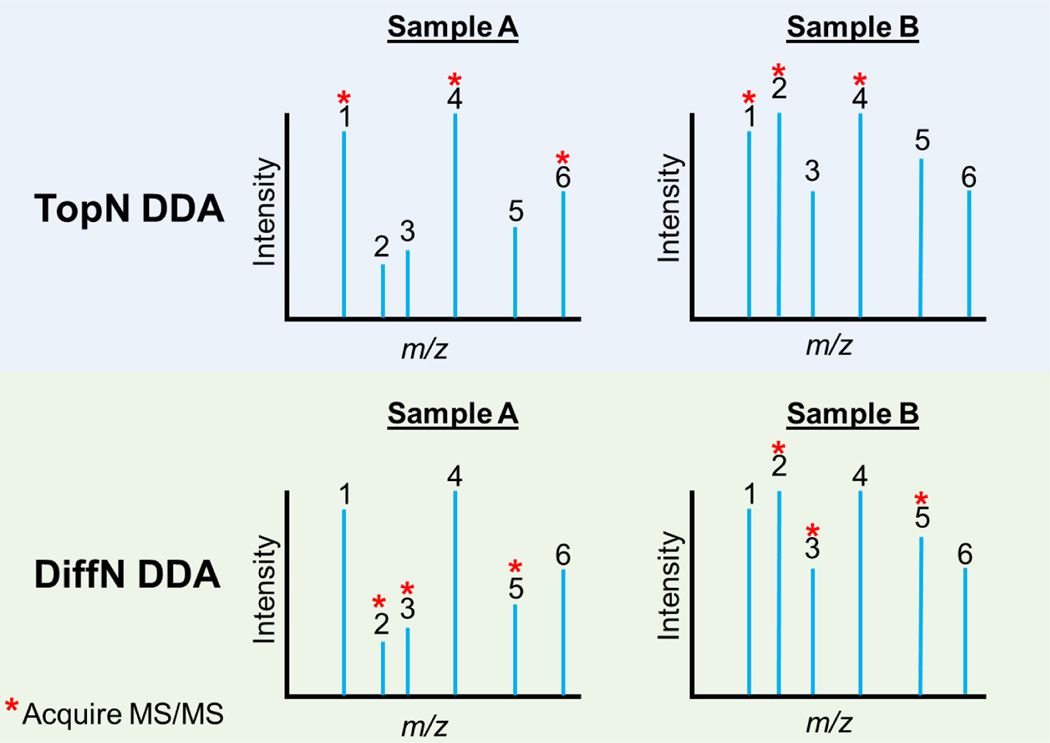
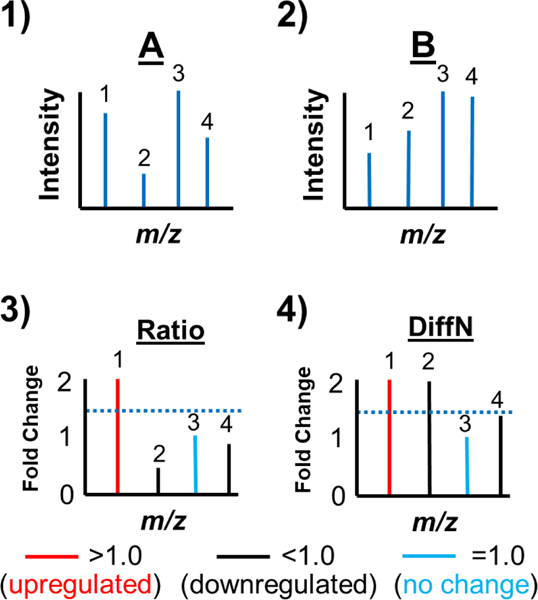
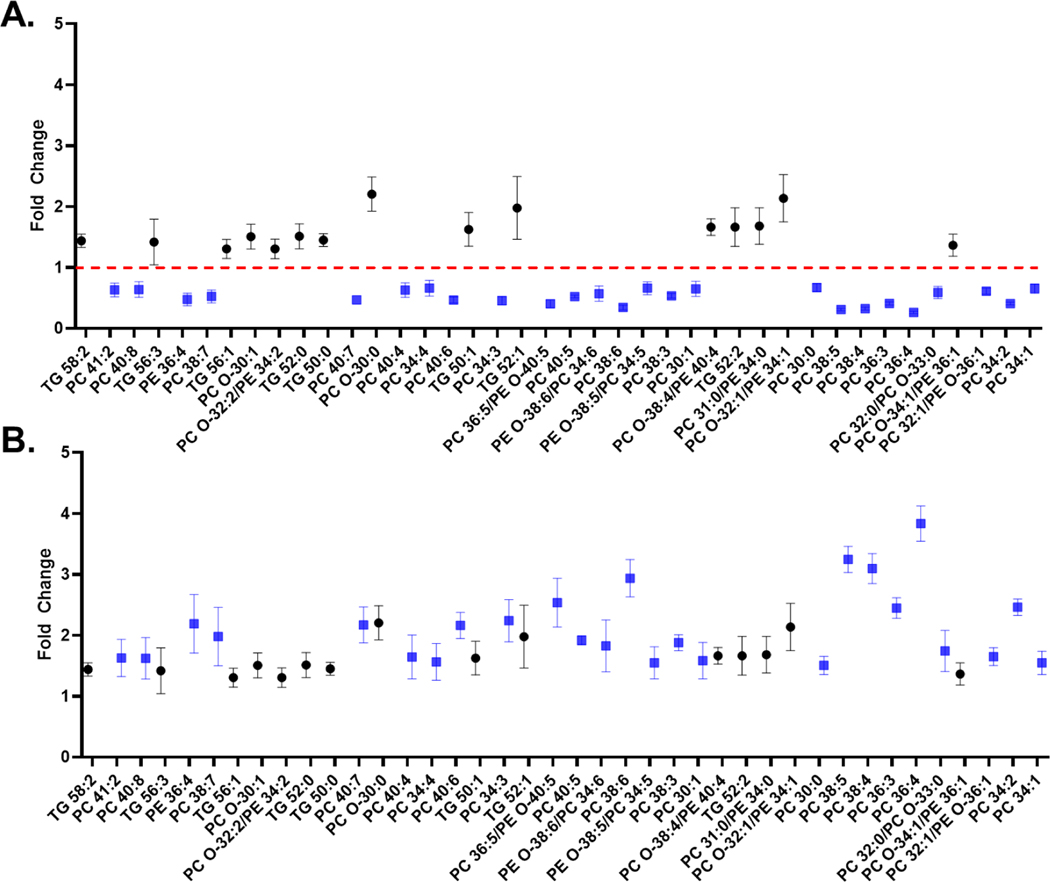
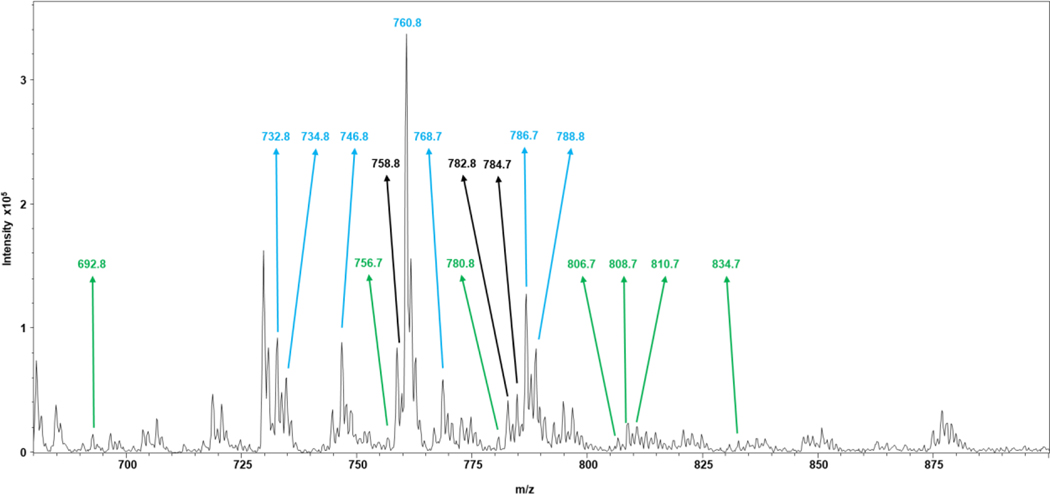
Current data-dependent acquisition (DDA) approaches select precursor ions for tandem mass spectrometry (MS/MS) characterization based on their absolute intensity, known as a TopN approach. Low-abundance species may not be identified as biomarkers in a TopN approach. Herein, a new DDA approach is proposed, DiffN, which uses the relative differential intensity of ions between two samples to selectively target species undergoing the largest fold changes for MS/MS. Using a dual nano-electrospray (nESI) ionization source which allows samples contained in separate capillaries to be analyzed in parallel, the DiffN approach was developed and validated with well-defined lipid extracts. A dual nESI source and DiffN DDA approach was applied to quantify the differences in lipid abundance between two colorectal cancer cell lines. The SW480 and SW620 lines represent a matched pair from the same patient: the SW480 cells from a primary tumor and the SW620 cells from a metastatic lesion. A comparison of TopN and DiffN DDA approaches on these cancer cell samples highlights the ability of DiffN to increase the likelihood of biomarker discovery and the decreased probability of TopN to efficiently select lipid species that undergo large fold changes. The ability of the DiffN approach to efficiently select precursor ions of interest makes it a strong candidate for lipidomic analyses. This DiffN DDA approach may also apply to other molecule classes (e.g., other metabolites or proteins) that are amenable to shotgun analyses.


Figures

Figure 1.
Figure 1.
Graphical representation of precursor ion selection for MS/MS analysis using (top) a TopN DDA approach or (bottom) the DiffN DDA approach. In TopN, Samples A and B are analyzed sequentially (e.g., separate chromatographic separations or separated direct infusions) and the most abundant species are selected for MS/MS (here, peaks 1, 4 and 6 in Sample A and 1, 2, and 4 in Sample B). TopN may miss low abundance species with higher fold changes (here, peaks 3 and 5). In DiffN, Samples A and B are analyzed in parallel. Species with the largest differential abundances are targeted for MS/MS (here, peaks 2, 3, and 5).
Figure 2.
Figure 2.
Workflow for DiffN MS/MS precursor ion selection. In steps 1 and 2, mass spectra for Samples A and B are acquired. Next, each peak in the two mass spectra is normalized to the internal standard intensity. In step 3 a Ratio Spectrum is generated where the normalized mass spectrum of Sample A is divided by the normalized mass spectrum of Sample B. Next, each value in the Ratio Spectrum with a fold change <1.0 is changed to its reciprocal value to generate a DiffN Spectrum (step 4). Finally, MS/MS spectra are acquired for each of the N selected peaks in the DiffN Spectrum.
Figure 3.
Figure 3.
Comparison of the fold-changes of each lipid species between 2.0 μg/mL and 1.0 μg/mL BLE determined by normalizing to the sum of the internal standards (●), normalizing to each class-specific internal standard (), and normalizing to the sum of all internal standards (), excluding the class of the lipid being normalized (e.g., when normalizing PC lipids, the PC class specific IS was excluded from the sum). There is no statistical difference in fold changes for any method of normalization. Species are plotted in order of increasing abundance with the lowest abundance species on the left and the highest abundance species on the right.
Figure 4.
Figure 4.
(A) Ratio spectrum displaying the fold-change of identified lipid species in the SW620 extract divided by the corresponding lipid species in the SW480 extract. (B) The DiffN spectrum, which plots the reciprocal of all fold changes in the ratio spectrum that were less than 1.0. All lipids were normalized to the sum of the internal standard intensities before determining the fold changes. Blue squares (■) represent lipids in the Ratio spectrum with a fold change <1.0, and black circles (●) represent lipids with a fold change >1.0. Lipids are ordered in terms of relative abundance with the lowest abundance species on the far left of the plot and the highest abundance species on the right of the plot.
Figure 5.
Figure 5.
Mass spectrum obtained from a lipid extract of the SW620 cell line. The m/z values selected by the TopN approach are annotated in blue, the DiffN approach in green, and both approaches in black. Only lipid species in the cells were used in the peak picking process, with m/z values of the internal standards omitted from the selection.

References

    1. Hu C; van der Heijden R; Wang M; van der Greef J; Hankemeier T; Xu G. Analytical Strategies in Lipidomics and Applications in Disease Biomarker Discovery. Journal of Chromatography B: Analytical Technologies in the Biomedical and Life Sciences. September 15, 2009, pp 2836–2846. 10.1016/j.jchromb.2009.01.038. - DOI - PubMed
    1. Cheng D; Jenner AM; Shui G; Cheong WF; Mitchell TW; Nealon JR; Kim WS; McCann H; Wenk MR; Halliday GM; Garner B. Lipid Pathway Alterations in Parkinson’s Disease Primary Visual Cortex. PLoS One 2011, 6 (2). 10.1371/journal.pone.0017299. - DOI - PMC - PubMed
    1. Butler LM; Perone Y; Dehairs J; Lupien LE; de Laat V; Talebi A; Loda M; Kinlaw WB; Swinnen JV Lipids and Cancer: Emerging Roles in Pathogenesis, Diagnosis and Therapeutic Intervention. Adv. Drug Deliv. Rev 2020, 159, 245–293. 10.1016/j.addr.2020.07.013. - DOI - PMC - PubMed
    1. Guijas C; Montenegro-Burke JR; Warth B; Spilker ME; Siuzdak G. Metabolomics Activity Screening for Identifying Metabolites That Modulate Phenotype. Nat. Biotechnol 2018, 36 (4), 316–320. 10.1038/nbt.4101. - DOI - PMC - PubMed
    1. Dunn WB; Broadhurst DI; Atherton HJ; Goodacre R; Griffin JL Systems Level Studies of Mammalian Metabolomes: The Roles of Mass Spectrometry and Nuclear Magnetic Resonance Spectroscopy. Chem. Soc. Rev 2011, 40 (1), 387–426. 10.1039/b906712b. - DOI - PubMed

Publication types