. 2023 Mar;33(3):463-477.
doi: 10.1101/gr.277372.122. Epub 2023 Mar 27.

A sheep pangenome reveals the spectrum of structural variations and their effects on tail phenotypes

Affiliations

A sheep pangenome reveals the spectrum of structural variations and their effects on tail phenotypes

Ran Li et al. Genome Res. 2023 Mar.

Abstract

Structural variations (SVs) are a major contributor to genetic diversity and phenotypic variations, but their prevalence and functions in domestic animals are largely unexplored. Here we generated high-quality genome assemblies for 15 individuals from genetically diverse sheep breeds using Pacific Biosciences (PacBio) high-fidelity sequencing, discovering 130.3 Mb nonreference sequences, from which 588 genes were annotated. A total of 149,158 biallelic insertions/deletions, 6531 divergent alleles, and 14,707 multiallelic variations with precise breakpoints were discovered. The SV spectrum is characterized by an excess of derived insertions compared to deletions (94,422 vs. 33,571), suggesting recent active LINE expansions in sheep. Nearly half of the SVs display low to moderate linkage disequilibrium with surrounding single-nucleotide polymorphisms (SNPs) and most SVs cannot be tagged by SNP probes from the widely used ovine 50K SNP chip. We identified 865 population-stratified SVs including 122 SVs possibly derived in the domestication process among 690 individuals from sheep breeds worldwide. A novel 168-bp insertion in the 5' untranslated region (5' UTR) of HOXB13 is found at high frequency in long-tailed sheep. Further genome-wide association study and gene expression analyses suggest that this mutation is causative for the long-tail trait. In summary, we have developed a panel of high-quality de novo assemblies and present a catalog of structural variations in sheep. Our data capture abundant candidate functional variations that were previously unexplored and provide a fundamental resource for understanding trait biology in sheep.


Figures

Figure 1.
Figure 1.
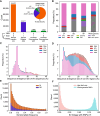
Quality assessment of 15 de novo assemblies produced by HiFi sequencing. (A) PCA plot showing the representation of the genetic diversity of domestic sheep by the 15 samples used for HiFi sequencing. The African Dorper sheep cluster with the European breeds as this breed is developed by crossing European Dorset Horn with the African Blackhead Persian sheep, resulting in its close genetic relationship with European breeds. (B) Repeat content of the 15 de novo assemblies. (C) The difference in chromosome length between the 15 new assemblies and the reference genome (REF, ARS-UI_Ram_v2.0). (D) Number of filled gaps by the different assemblies. (E) Cumulative length of contigs (Nx). In the x-axis, 50% measures the N50 across the new assemblies. HiFi sequencing depth for each assembly is shown with the dashed line referring to the reference genome. Assemblies with higher Nx values are more contiguous. (F) BUSCO completeness for the 15 new assemblies.
Figure 2.
Figure 2.
Structural variation discovery in sheep. (A) Illustration and number of different SV types. The red lines indicate the reference sequence and the blue lines represent the nonreference sequence. (B) An example of a divergent allele of 50,757 bp containing a MYADM gene. (C) An example of a multiallelic variation. (D) The number of SVs per sample. (E) Pangenome growth curve generated by integrating SVs from each individual. Variants were merged starting with FRI1 followed by iteratively adding unique calls from additional samples. (F) Length distribution of different types of SVs.
Figure 3.
Figure 3.
Inference of derived state for SVs using takin and goat as outgroups. (A) Each SV is assigned to a derived state of either derived insertion, derived deletion, ancestral polymorphism, or indeterminate based on their presence (“1”) and absence (“0”) status in outgroup. (B) Repeat annotation in three types of dSVs. (C) Sequence divergence rate (%) of TE repeats within SV sequences. (D) Sequence divergence rate (%) of TE repeats in non-SV genomic regions. (E) dSV allele frequency spectrum. (F) Linkage analysis between SVs and nearby SNPs of whole genome (±50 kb) and ovine 50K SNP chip (±500 kb). Those SVs with MAF > 0.01 were used for linkage analysis.
Figure 4.
Figure 4.
The distribution of LD (r2) between SVs and nearby SNPs in domestic sheep, with different MAF ranges for SVs. (A) Density distribution of LD between SVs and nearby SNPs. (B) Contour density plots of LD between SVs and nearby SNPs. For each SV, the maximum r2 with nearby SNPs (±50 kb) on either side together with their physical distance is recorded. The Mann–Whitney U test was used to determine the difference in SV density between standing SVs and domestication-associated (Dom-associated) SVs. Blue lines: standing SVs that are present in mouflons; red lines: domestication-associated SVs.
Figure 5.
Figure 5.
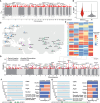
Selection signatures of SVs in domestic sheep. (A) DISV variations along the sheep genome. DISV is calculated as the derived allele frequency difference between domestic sheep and Asiatic mouflons. The top selected SVs belong to the top 1% signals from both DISV and FST-SV. (B) Distribution of the mean FST of the SNPs (FST-SNP) surrounding selected SVs as compared with all SVs in 5-kb window. The dotted line indicates the top 1% cutoff of FST-SNP distributions. (C) Geographical distribution of the 45 breeds/populations (for the breed codes, see Supplemental Table S1). The Dorper sheep from South Africa and the white Suffolk from Australia are not shown. (D) Genome-wide distribution of global FST for each SV across assigned breeds/populations. (E) The most stratified dSVs correspond to five genes associated with sheep morphology. (F) A 1.4-kb domestication-associated insertion downstream from IRF2BP2. (G) A 1.8-kb domestication-associated insertion downstream from RXFP2.
Figure 6.
Figure 6.
Selective SVs associated with the long-tail trait. (A) Population branch statistic (PBS) values of long fat-tailed versus short fat-tailed sheep breeds based on dSVs and SNPs. The PBS value was calculated for SNPs using a 10-kb window size and a 5-kb step size. (B) GWAS of tail length in an East Friesian × (Hu sheep × East Friesian) hybrid population (n = 201) using a 40K SNP chip. The dotted line indicates the threshold of genome-wide significance. (C) The frequency of insertion in each breed is shown as orange in the pie chart. For the breed codes, see Supplemental Table S1. (D) The regions surrounding the insertion are highly conserved in ruminants except in sheep. (E) The carriers and noncarriers of the insertion differ in tail length. (F) RNA-seq data show the expression of the insertion in long-tailed individuals. The sequencing coverage from two RNA-seq data sets of ovine colons are shown. (G) A dual luciferase assay and a quantitative luciferase assay were used to measure the luciferase protein accumulation. The luciferase activity was measured by dual luciferase reporter assay and presented as relative LUC (firefly/Renilla luciferase). (H) Real-time PCR was used to measure the relative mRNA expression of firefly luciferase. Each experiment was repeated at least three times. Student's t-test was used to determine significance in E, G, and H. (****) P < 0.0001.
Figure 7.
Figure 7.
Selective SVs associated with the fat-tail trait. (A) Population branch statistic (PBS) values across the whole genome by comparing fat-tailed sheep to thin-tailed sheep using the mouflon sheep as an outgroup. The PBS value was calculated for SNPs using a 10-kb window size and 5-kb step size. (B) The two most differentiated regions between fat-tailed sheep and thin-tailed sheep. The left panel shows the IBH region (intergenic region between BMP2 and HAO1) and the right panel corresponds to the region surrounding PDGFD. SVs with PBS > 0.8 are highlighted by the blue dotted lines. (C) The haplotypes of mouflons and domestic sheep for the two most selective regions. Each column represents one SV and each row represents one individual. The black reverted triangles represent domestication-associated SVs exclusively found in domestic sheep but absent in wild species.

References

    1. Aires R, de Lemos L, Nóvoa A, Jurberg AD, Mascrez B, Duboule D, Mallo M. 2019. Tail Bud progenitor activity relies on a network comprising Gdf11, Lin28, and Hox13 genes. Dev Cell 48: 383–395.e8. 10.1016/j.devcel.2018.12.004 - DOI - PubMed
    1. Almarri MA, Bergström A, Prado-Martinez J, Yang F, Fu B, Dunham AS, Chen Y, Hurles ME, Tyler-Smith C, Xue Y. 2020. Population structure, stratification, and introgression of human structural variation. Cell 182: 189–199.e15. 10.1016/j.cell.2020.05.024 - DOI - PMC - PubMed
    1. Alonge M, Soyk S, Ramakrishnan S, Wang X, Goodwin S, Sedlazeck FJ, Lippman ZB, Schatz MC. 2019. RaGOO: fast and accurate reference-guided scaffolding of draft genomes. Genome Biol 20: 224. 10.1186/s13059-019-1829-6 - DOI - PMC - PubMed
    1. Alonge M, Wang X, Benoit M, Soyk S, Pereira L, Zhang L, Suresh H, Ramakrishnan S, Maumus F, Ciren D, et al. 2020. Major impacts of widespread structural variation on gene expression and crop improvement in tomato. Cell 182: 145–161.e23. 10.1016/j.cell.2020.05.021 - DOI - PMC - PubMed
    1. Audano PA, Sulovari A, Graves-Lindsay TA, Cantsilieris S, Sorensen M, Welch AE, Dougherty ML, Nelson BJ, Shah A, Dutcher SK, et al. 2019. Characterizing the major structural variant alleles of the human genome. Cell 176: 663–675.e19. 10.1016/j.cell.2018.12.019 - DOI - PMC - PubMed

Publication types

Substances

LinkOut - more resources