

Analysis of spatial perception and the influencing factors of attractions in Southwest China's ethnic minority areas: The case of Dali Bai Autonomous Prefecture
- PMID: 37310936
- PMCID: PMC10263339
- DOI: 10.1371/journal.pone.0285141
Analysis of spatial perception and the influencing factors of attractions in Southwest China's ethnic minority areas: The case of Dali Bai Autonomous Prefecture
Abstract
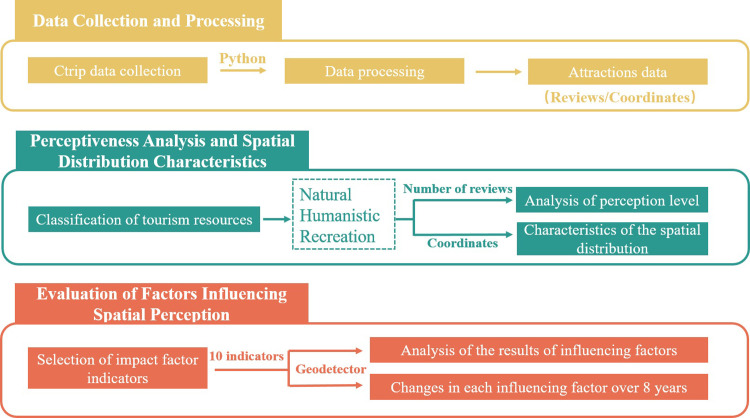
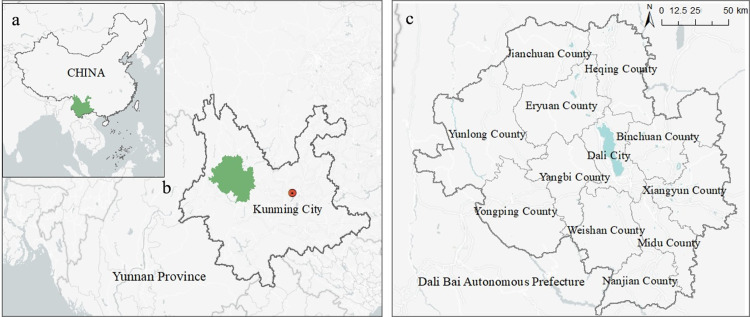
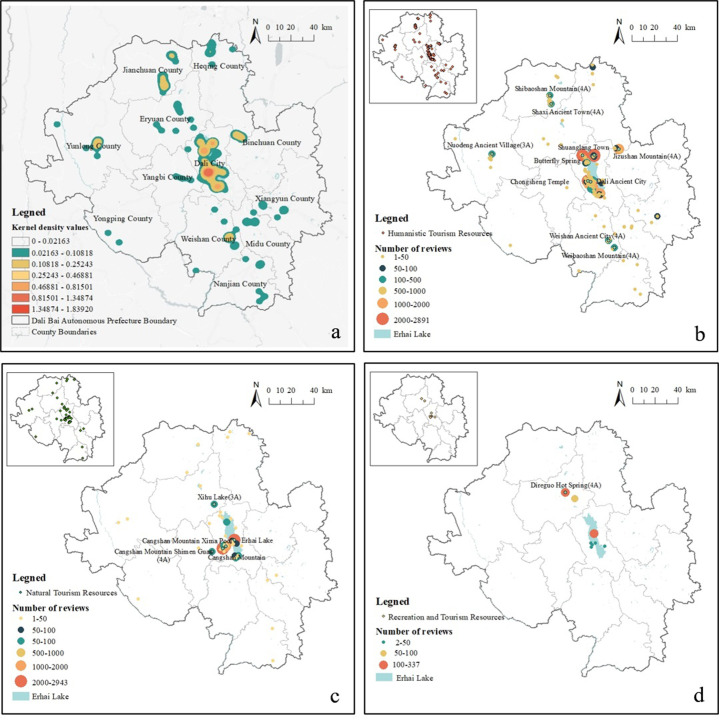
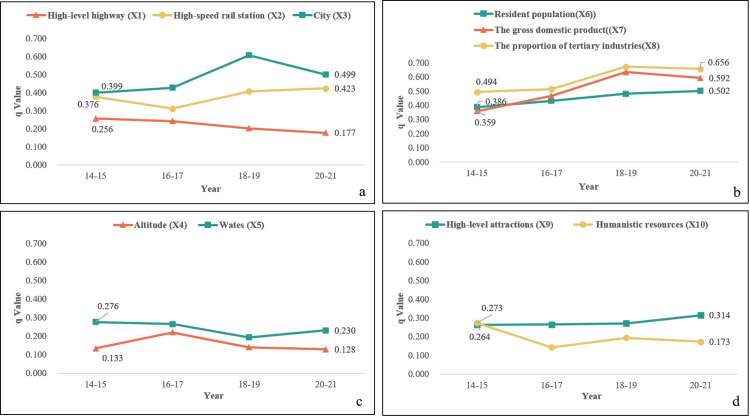
As standards of material living continue to improve and urbanization advances, an increasing number of remote ethnic minority areas are becoming tourist destinations. Understanding tourists' perceptions on a large scale is thus crucial for the development of the regional tourism industry. However, traditional research methods suffer from high costs, small sample sizes, and low efficiency, making it difficult to measure the spatial perception of remote areas on a large scale. This study constructs a research framework for spatial perception measurement of remote ethnic minority areas by collecting reviews data from Ctrip using spatiotemporal data calculation and the Geodetector model. We considered Dali Prefecture as an empirical case and analyzed tourists' perceptions of the area's attractions, the spatial distribution of the attractions, and the process of change in the explanatory power of their influencing factors over an eight-year period (2014-2021). The results indicated that the most visited attractions were concentrated in Dali City. The perception of humanistic resources (attractions) with historical value was the highest, followed by natural resources. The high perception of attractions was influenced by the level of tourism development, traffic accessibility and attractiveness, and had an increasing influence on tourists' perceptions over time. Additionally, changes in the mode of transportation from road to high-speed rail played an important role in the selection of tourist attractions. Conversely, the tourists paid relatively less attention to humanistic resources (e.g., national cultural heritage protection units and traditional villages). Our study provides a basis for the measurement of spatial perception in remote minority areas and can be used as a reference for tourism development planning in Dali Prefecture, thus promoting the sustainable development of tourism in the area.
Copyright: © 2023 Yin et al. This is an open access article distributed under the terms of the Creative Commons Attribution License, which permits unrestricted use, distribution, and reproduction in any medium, provided the original author and source are credited.
Conflict of interest statement
The authors have declared that no competing interests exist.
Figures
References
-
- Liu M, Hao W. Spatial distribution and its influencing factors of national A-level tourist attractions in Shanxi Province. Acta Geogr Sin. 2020;04: 878–888.
-
- Zha J, Dai J, Xu H, Zhao C, Tan T, Li Z. Assessing efficiency and determinants of tourist attractions based on a two-subprocess perspective: a case of Chengdu, southwestern China. J Destination Mark Manag. 2021;19: 100542. doi: 10.1016/j.jdmm.2020.100542 - DOI
-
- Cao F, Huang Z, Jin C, Xu M. Chinese national scenic areas’ tourism efficiency: multi-scale fluctuation, prediction and optimization. Asia Pac J Tourism Res. 2016;21(5): 570–595. doi: 10.1080/10941665.2015.1068190 - DOI
-
- Shinde KA. Religious theme parks as tourist attraction systems. J Herit Tourism. 2021;16(3): 281–299. doi: 10.1080/1743873X.2020.1791887 - DOI
-
- Toral SL, Martínez-Torres MR, Gonzalez-Rodriguez MR. Identification of the unique attributes of tourist destinations from online reviews. J Travel Res. 2018;57(7): 908–919. doi: 10.1177/0047287517724918 - DOI
MeSH terms
LinkOut - more resources
Full Text Sources
Research Materials
