. 2023 Jun 13;18(6):e0287094.
doi: 10.1371/journal.pone.0287094. eCollection 2023.

Soil elemental changes during human decomposition

Affiliations

Soil elemental changes during human decomposition

Lois S Taylor et al. PLoS One. .

Abstract

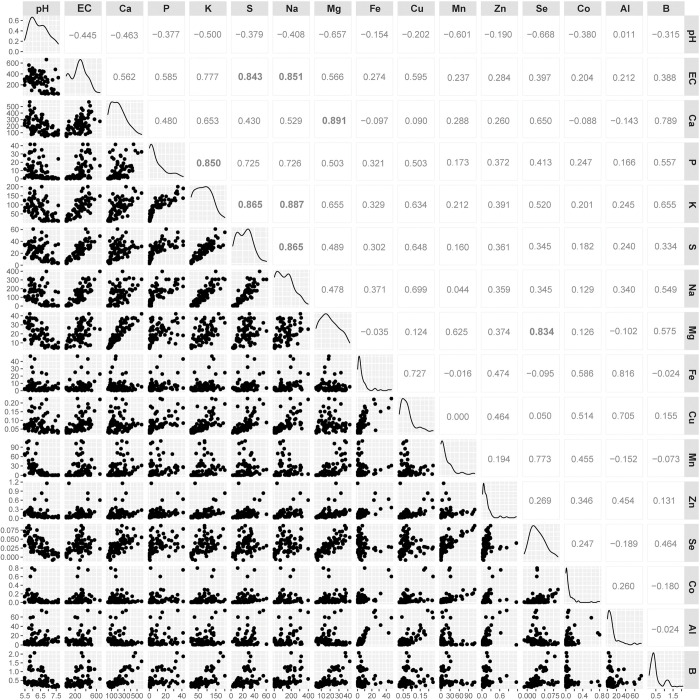
Mammalian decomposition provides pulses of organic matter to the local ecosystem creating ephemeral hotspots of nutrient cycling. While changes to soil biogeochemistry in these hotspots have been described for C and N, patterns associated with deposition and cycling of other elements have not received the same attention. The goal of our study was to evaluate temporal changes to a broad suite of dissolved elements in soils impacted by human decomposition on the soil surface including: 1) abundant mineral elements in the human body (K, Na, S, P, Ca, and Mg), 2) trace elements in the human body (Fe, Mn, Se, Zn, Cu, Co, and B), and 3) Al which is transient in the human body but common in soils. We performed a four-month human decomposition trial at the University of Tennessee Anthropology Research Facility and quantified elemental concentrations dissolved in the soil solution, targeting the mobile and bioavailable fraction. We identified three groups of elements based on their temporal patterns. Group 1 elements appeared to be cadaver-derived (Na, K, P, S) and their persistence in soil varied based upon soluble organic forms (P), the dynamics of the soil exchange complex (Na, K), and gradual releases attributable to microbial degradation (S). Group 2 elements (Ca, Mg, Mn, Se, B) included three elements that have greater concentrations in soil than would be expected based on cadaver inputs alone, suggesting that these elements partially originate from the soil exchange (Ca, Mg), or are solubilized as a result of soil acidification (Mn). Group 3 elements (Fe, Cu, Zn, Co, Al) increased late in the decomposition process, suggesting a gradual solubilization from soil minerals under acidic pH conditions. This work presents a detailed longitudinal characterization of changes in dissolved soil elements during human decomposition furthering our understanding of elemental deposition and cycling in these environments.


Conflict of interest statement

The authors have declared no competing interests exist.

Figures

Fig 1
Fig 1. Effects of decomposition on soil pH and conductivity.
Comparisons between decomposition impacted and control soils over the entire study trial for A) pH, and B) electrical conductivity (EC). Data are means (diamonds) and medians (bars) for n = 3 replicate donors. Statistically significant (p < 0.05) differences between decomposition and control soils are denoted by an asterisk.
Fig 2
Fig 2. Principal component analysis (PCA) of pH, conductivity (EC), and elemental concentrations by study day.
Points represent individual samples colored by study day, and vectors represent elements, pH, and EC. The PCA diagram shows three groups of elements. Group 1: Sodium (Na), sulfur (S), phosphorus (P), EC, and potassium (K). Group 2: Manganese (Mn), selenium (Se), boron (B), magnesium (Mg), and calcium (Ca). Group 3: Aluminum (Al), iron (Fe), cobalt (Co), copper (Cu) and zinc (Zn).
Fig 3
Fig 3. Heatmap showing scaled changes in elemental concentrations by study day.
Three distinct groups and patterns of change occur in EC and elemental concentrations. Group 1 includes sodium (Na), conductivity (EC), sulfur (S), potassium (K), and phosphorus (P); these increase by day 17 and soil concentrations persist throughout the study. Group 2 includes selenium (Se), manganese (Mn), magnesium (Mg), calcium (Ca), and boron (B); these elements also increase by day 17, however soil concentrations decline later in the trial. Group 3 includes: cobalt (Co), copper (Cu), zinc (Zn), aluminum (Al), and iron (Fe); these elements increase following day 89. Elemental concentrations are scaled to a mean of zero and standard deviation of 1 and are hierarchically clustered according to Pearson correlations.
Fig 4
Fig 4. Effects of decomposition on group 1 element abundances in soil.
Comparisons between decomposition and control soils over the entire trial for A) phosphorus, B) potassium, C) sodium, and D) sulfur. Data are means (diamonds) and medians (bars) for n = 3 replicate donors. Statistically significant (p < 0.05) differences between decomposition and control soils are denoted by asterisks.
Fig 5
Fig 5. Correlations between soil pH, EC, and elemental concentrations during human decomposition.
Pearson correlation matrix showing relationships between pH, conductivity (EC), and individual elements in decomposition-impacted soils. Diagonal panels display pH, EC, and individual elemental distributions. Pearson correlation r values are shown between pH, EC, and elements at the top of the matrix. Pearson correlation r > 0.80 are shown in large bold type. EC and elemental concentration ranges are presented in μS cm-1 (EC) and μg gdw-1 soil (elements).
Fig 6
Fig 6. Effects of decomposition on charge concentrations in soil.
Comparisons between molar charge concentrations in decomposition and control soils over the entire trial for A) calcium, B) sodium, C) potassium, and D) magnesium. Selected elements are exchangeable base cations in soil. Data are means ± standard deviations for n = 3 replicate donors.
Fig 7
Fig 7. Effects of decomposition on group 2 element abundances in soil.
Comparisons between decomposition and control soils over the entire trial for A) calcium, B) magnesium, C) manganese, D) selenium, and E) boron. Data are means (diamonds) and medians (bars) for n = 3 replicate donors. Statistically significant (p < 0.05) differences between decomposition and control soils are denoted by asterisks.
Fig 8
Fig 8. Effects of decomposition on group 3 element abundances in soil.
Comparisons between decomposition and control soils over the entire trial for A) iron, B) zinc, C) copper, D) cobalt, and E) aluminum. Data are means (diamonds) and medians (bars) for n = 3 replicate donors. Statistically significant (p < 0.05) differences between decomposition and control soils are denoted by asterisks.

References

    1. Martin C, Verheggen F. Odour profile of human corpses: a review. Forensic Chem. 2018;10: 27–36. doi: 10.1016/j.forc.2018.07.002 - DOI
    1. Miranker M, Giordano A, Spradley K. Phase II spatial patterning of vulture scavenged human remains. Forensic Sci Int. 2020;314. doi: 10.1016/j.forsciint.2020.110392 - DOI - PubMed
    1. Spradley MK, Hamilton MD, Giordano A. Spatial patterning of vulture scavenged human remains. Forensic Sci Int. 2012;219: 57–63. doi: 10.1016/j.forsciint.2011.11.030 - DOI - PubMed
    1. Amendt J, Richards CS, Campobasso CP, Zehner R, Hall MJR. Forensic entomology: applications and limitations. Forensic Sci Med Pathol. 2011;7: 379–392. doi: 10.1007/s12024-010-9209-2 - DOI - PubMed
    1. Cobaugh KL, Schaeffer SM, DeBruyn JM. Functional and structural succession of soil microbial communities below decomposing human cadavers. PLoS One. 2015;10(6):e0130201. doi: 10.1371/journal.pone.0130201 - DOI - PMC - PubMed

Publication types