. 2023 Jun 13;18(6):e0286558.
doi: 10.1371/journal.pone.0286558. eCollection 2023.

Spatial heterogeneity and infection patterns on epidemic transmission disclosed by a combined contact-dependent dynamics and compartmental model

Affiliations

Spatial heterogeneity and infection patterns on epidemic transmission disclosed by a combined contact-dependent dynamics and compartmental model

Youyuan Zhu et al. PLoS One. .

Abstract

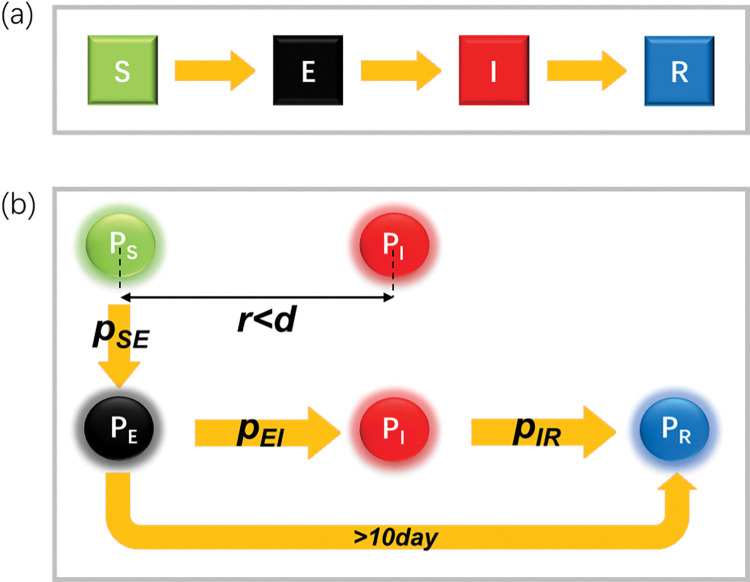
Epidemics, such as COVID-19, have caused significant harm to human society worldwide. A better understanding of epidemic transmission dynamics can contribute to more efficient prevention and control measures. Compartmental models, which assume homogeneous mixing of the population, have been widely used in the study of epidemic transmission dynamics, while agent-based models rely on a network definition for individuals. In this study, we developed a real-scale contact-dependent dynamic (CDD) model and combined it with the traditional susceptible-exposed-infectious-recovered (SEIR) compartment model. By considering individual random movement and disease spread, our simulations using the CDD-SEIR model reveal that the distribution of agent types in the community exhibits spatial heterogeneity. The estimated basic reproduction number R0 depends on group mobility, increasing logarithmically in strongly heterogeneous cases and saturating in weakly heterogeneous conditions. Notably, R0 is approximately independent of virus virulence when group mobility is low. We also show that transmission through small amounts of long-term contact is possible due to short-term contact patterns. The dependence of R0 on environment and individual movement patterns implies that reduced contact time and vaccination policies can significantly reduce the virus transmission capacity in situations where the virus is highly transmissible (i.e., R0 is relatively large). This work provides new insights into how individual movement patterns affect virus spreading and how to protect people more efficiently.


Conflict of interest statement

The authors have declared that no competing interests exist.

Figures

Fig 1
Fig 1. The classic SEIR model and the modified SEIR model.
(a) The classic SEIR model. Green, black, red, and blue squares represent susceptible, exposed, infectious, and recovered compartments, respectively. Susceptible individuals in the system successively go through these four stages. Transitions between adjacent stages occur according to certain probabilities. (b) The modified SEIR model. When the distance between the susceptible PS and PI is within the airborne transmission distance d, PS can be infected by PI and transformed into PE at the probability pSE. The latent period is within 4–10 days. During this period, PE converts with probability pEI to infectious PI that can transmit the virus. Any PE that remained unconverted to a PI after 10 days is classified as a recover PR. Meanwhile, PI could also be cured with probability pIR and transformed into PR.
Fig 2
Fig 2. Schematic diagram of the CDD model.
(a) Stochastic motion process characterized by the CDD model. The upper panel represents that the direction of motion of an agent varies within [-45°, 45°] of the original direction when there are other agents within rc. The lower panel gives an example of the change in motion state of two individuals before and after contact: i is the central agent, and the blue circle represents its contact range of radius rc. Individuals i and j fall in contact when their distance is less than rc, and the agents are in a uniform linear motion before contact. The red, green, and black solid vectors represent the velocities of i and j and the relative velocity j relative to i, respectively. The gray dashed line represents the trajectory of j relative to i. (b) The reassigned velocity vrnd that satisfies a normal distribution with a mean of v and a standard deviation of 13v. θrnd is the change in the reassigned direction (in the range of -45° to 45°), which satisfies a normal distribution with a mean of 0° and a standard deviation of 15°.
Fig 3
Fig 3. System setup of the CDD-SEIR model.
(a) Schematic diagram of a representative system obtained from the simulations. The system contains 200 particles with a box length of 1002 m and density of (100 m2)-1. PS, PE, PI and PR are represented by green, black, red and blue particles, respectively. (b) The profiles of the temporal population of PS (in green), PE (in black), PI (in red) and PR (in blue) during epidemic transmission. (c) Representative snapshots of the infection within a community at days 0, 10, 20, 30, and 40 are shown.
Fig 4
Fig 4. Contact pattern of the CDD model.
(a) The mean (blue) and median (red) of the contact time ω influenced by the velocity v of agents in the CDD model. (b) The percentages of ω in different time ranges for the velocity v of agents in the CDD model. The blue line represents ω < 0.5*rc /v, the red line represents 0.5*rc /vω < 4*rc /v, and the green line represents ω ≥ 4*rc/v. (c) The mean free time τ in the CDD model (solid line) and the CDD-NC model (dashed line) for different velocities.
Fig 5
Fig 5. Infection spreading in different pSE and the basic reproduction number R0 influenced by pSE and the velocity v of agents in the system.
The dynamic progress of the infection spreading when pSE = 1.0*10−4 (a) and pSE = 2.0*10−4 (b). Snapshots of Days 0, 20, and 40 are shown in order. (c) The influence of pSE and v of agents on R0 in the system. The points represent the calculated data, and the solid line represents the fitting curve to eliminate noise.
Fig 6
Fig 6
The basic reproduction number R0 (a), the heterogeneity variable ζ (b) and the critical velocity vc of R0 and ζ (c) influenced by five parameters (nI,0, d, pSE, pEI,Day7, and pIR) and the velocity v of agents in the system. In each plot, the results corresponding to the five values used for the parameter that changed are represented by five different colored curves. The points represent the calculated data, and the solid line represents the fitting curve to eliminate noise. The horizontal coordinates in (a) and (b) are on a logarithmic scale.
Fig 7
Fig 7
The slope k (a) and the saturated reproduction number RS (b) influenced by five parameters (nI,0, d, pSE, pEI,Day7, and pIR) in the system.
Fig 8
Fig 8. Contact time required for infection tSE at low velocity (a, v = 0.001 m/s) and medium velocity (b, v = 0.02 m/s), number of contacts between PS and PI agents before infection TSI, the mean (blue) and median (orange) of the average time per contact between PS and PI agents before infection ωSI with the probability of infection pSE compared with the contact time ω calculated by the CDD model.
At a low velocity (v = 0.001 m/s), infection tends to occur through a small number of long-term contacts.

Similar articles

Cited by

References

    1. Zhou P, Yang X-L, Wang X-G, Hu B, Zhang L, Zhang W, et al.. A pneumonia outbreak associated with a new coronavirus of probable bat origin. Nature. 2020;579(7798):270–3. doi: 10.1038/s41586-020-2012-7 - DOI - PMC - PubMed
    1. Li Q, Guan X, Wu P, Wang X, Zhou L, Tong Y, et al.. Early Transmission Dynamics in Wuhan, China, of Novel Coronavirus-Infected Pneumonia. N Engl J Med. 2020;382(13):1199–207. Epub 2020/01/30. doi: 10.1056/NEJMoa2001316 ; PubMed Central PMCID: PMC7121484. - DOI - PMC - PubMed
    1. Liu Y, Gayle AA, Wilder-Smith A, Rocklöv J. The reproductive number of COVID-19 is higher compared to SARS coronavirus. J Travel Med. 2020;27(2):taaa021. Epub 2020/02/14. doi: 10.1093/jtm/taaa021 ; PubMed Central PMCID: PMC7074654. - DOI - PMC - PubMed
    1. Liu Y, Rocklöv J. The reproductive number of the Delta variant of SARS-CoV-2 is far higher compared to the ancestral SARS-CoV-2 virus. J Travel Med. 2021;28(7):taab124. Epub 2021/08/10. doi: 10.1093/jtm/taab124 ; PubMed Central PMCID: PMC8436367. - DOI - PMC - PubMed
    1. Liu Y, Rocklöv J. The effective reproductive number of the Omicron variant of SARS-CoV-2 is several times relative to Delta. J Travel Med. 2022;29(3):taac037. Epub 2022/03/10. doi: 10.1093/jtm/taac037 ; PubMed Central PMCID: PMC8992231. - DOI - PMC - PubMed

Publication types