

Comparison of Visual Field Test Measurements With a Novel Approach on a Wearable Headset to Standard Automated Perimetry
- PMID: 37311012
- PMCID: PMC10414153
- DOI: 10.1097/IJG.0000000000002238
Comparison of Visual Field Test Measurements With a Novel Approach on a Wearable Headset to Standard Automated Perimetry
Abstract
Prcis: This study of inter-test comparability of a novel visual field application installed on an augmented-reality portable headset and Humphrey field analyzer Swedish interactive thresholding algorithm (SITA) Standard visual field test demonstrates the excellent correlation of mean deviation (MD) and mean sensitivity (MS).
Purpose: To determine the correlation between visual field testing with novel software on a wearable headset versus standard automated perimetry.
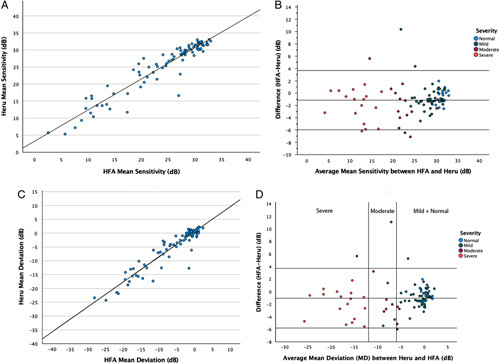
Patients and methods: Patients with and without visual field defects attributable to glaucoma had visual field testing in one eye of each patient with 2 methods: re:Imagine Strategy (Heru, Inc.) and the Humphrey field analyzer (Carl Zeiss Meditec, Inc.) SITA Standard 24-2 program. Main outcome measures included MS and MD, which were evaluated by linear regression, intraclass correlation coefficient (ICC), and Bland Altman analysis for assessment of the mean difference and limits of agreement.
Results: Measurements from 89 eyes of 89 patients (18 normal and 71 glaucomas) were compared with both instruments. Linear regression analysis demonstrated an excellent Pearson correlation coefficient of r = 0.94 for MS and r = 0.95 for MD. ICC analysis demonstrated high levels of concordance (ICC = 0.95, P < 0.001 for MS and ICC = 0.94, P < 0.001 for MD). Bland-Altman analysis determined a small mean difference between the two devices (Heru minus Humphrey) of 1.15 dB for MS and 1.06 dB for MD.
Conclusions: The Heru visual field test correlated well with SITA Standard in a population of normal eyes and eyes with glaucoma.
Copyright © 2023 The Author(s). Published by Wolters Kluwer Health, Inc.
Conflict of interest statement
Disclosure: M.A.S. is an equity holder, officer, and sits on the Board of Directors for Heru, Inc. M.D., A.N., V.L., M.C., C.A.D., R.K., and C.O.-B., are employed by or have been employed by Heru, Inc. The remaining authors declare no conflict of interest.
Figures


References
-
- Bengtsson B, Olsson J, Heijl A, et al. . A new generation of algorithms for computerized threshold perimetry, SITA. Acta Ophthalmol Scand. 1997;75:368–375. - PubMed
-
- Budenz DL, Rhee P, Feuer WJ, et al. . Sensitivity and specificity of the Swedish interactive threshold algorithm for glaucomatous visual field defects. Ophthalmology. 2002;109:1052–1058. - PubMed
-
- Wild JM, Pacey IE, O’Neill EC, et al. . The SITA perimetric threshold algorithms in glaucoma. Invest Ophthalmol Vis Sci. 1999;40:1998–2009. - PubMed
-
- Alawa KA, Nolan RP, Han E, et al. . Low-cost, smartphone-based frequency doubling technology visual field testing using a head-mounted display. Br J Ophthalmol. 2021;105:440–444. - PubMed
Publication types
MeSH terms
Grants and funding
LinkOut - more resources
Full Text Sources
Medical
Miscellaneous
