

Differential Effects of Cocaine and Morphine on the Diurnal Regulation of the Mouse Nucleus Accumbens Proteome
- PMID: 37311105
- PMCID: PMC10392613
- DOI: 10.1021/acs.jproteome.3c00126
Differential Effects of Cocaine and Morphine on the Diurnal Regulation of the Mouse Nucleus Accumbens Proteome
Abstract
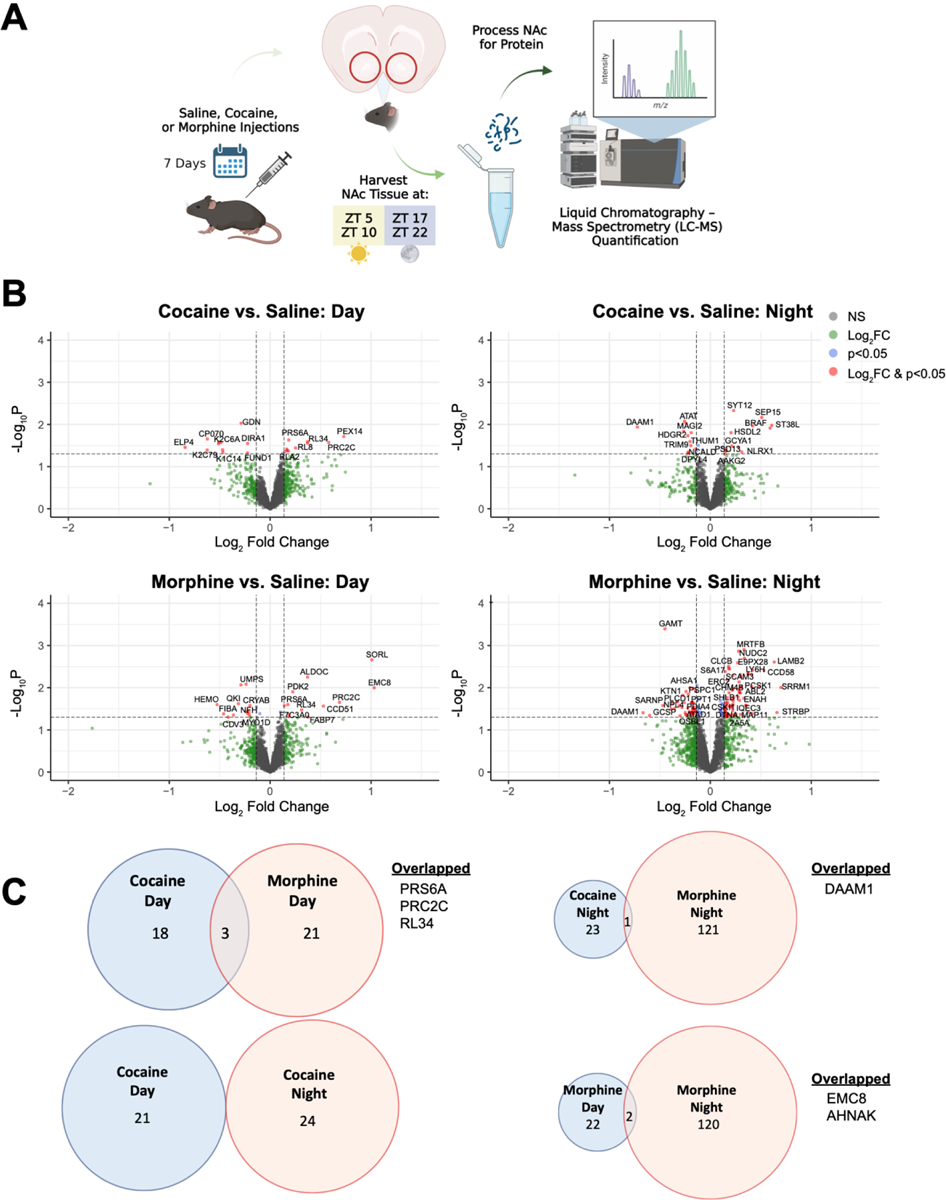
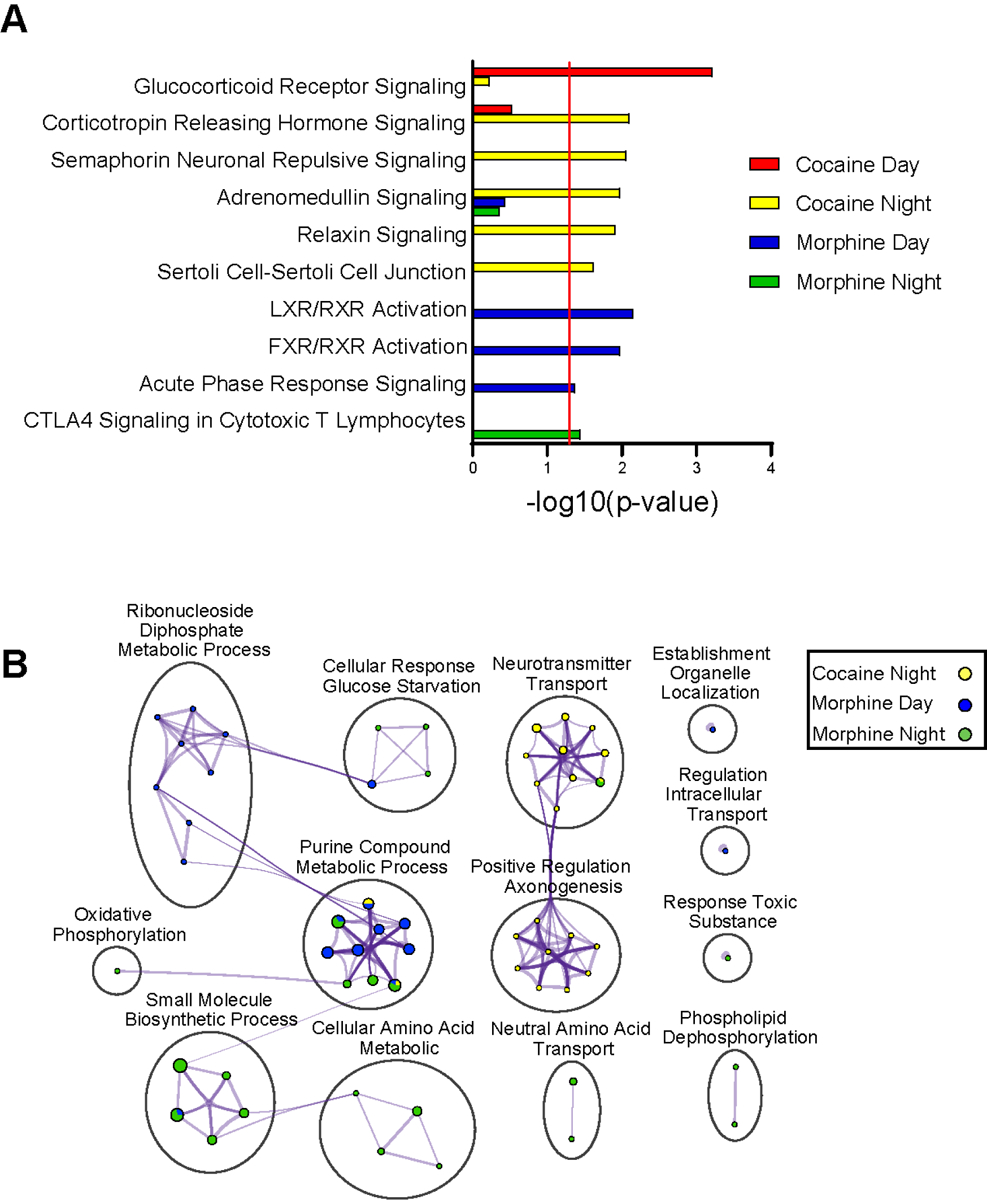
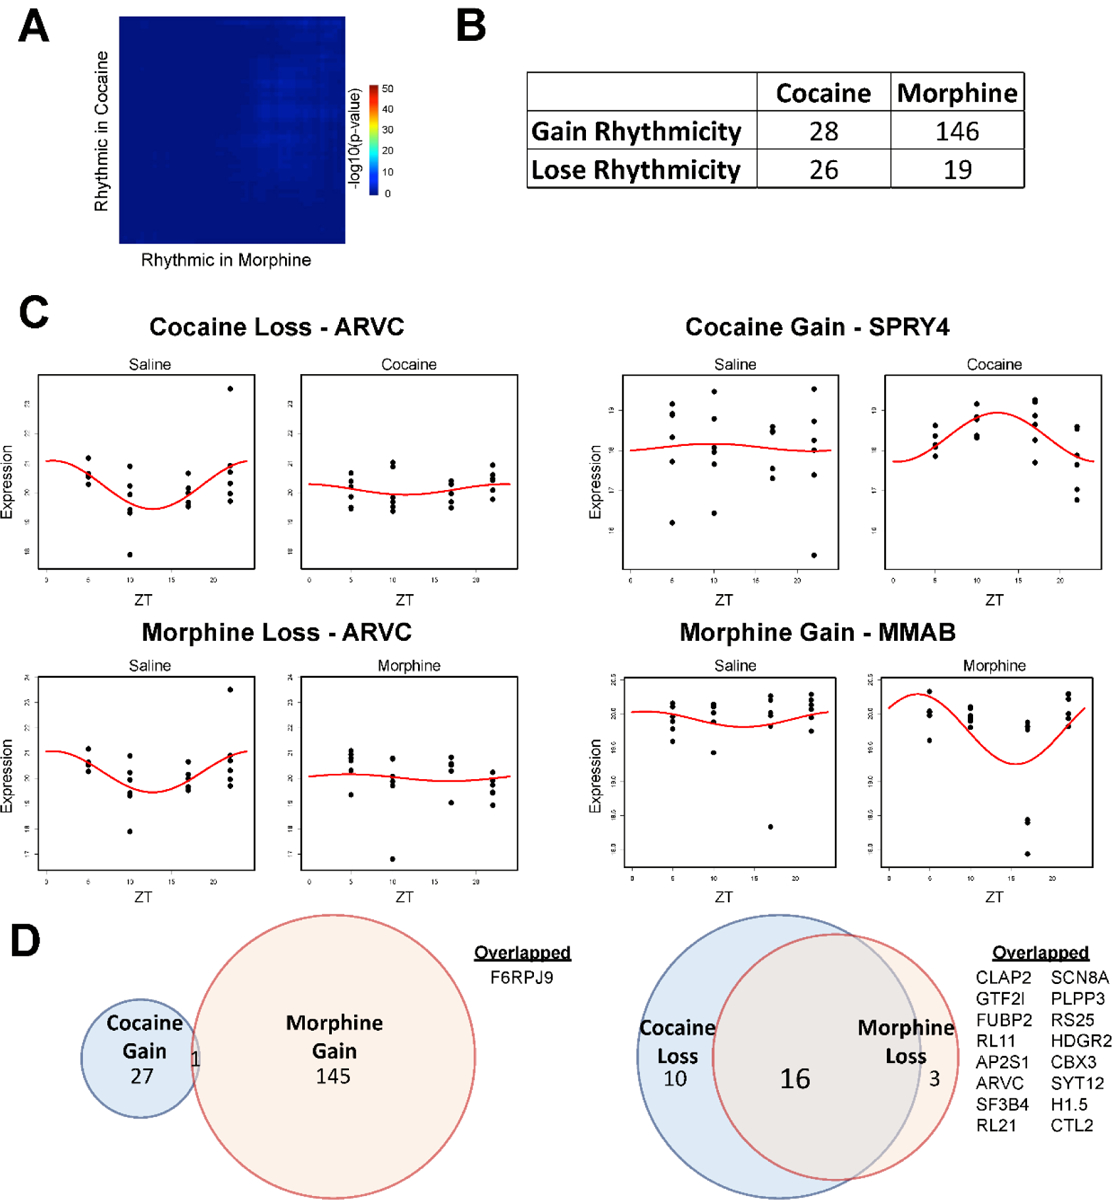
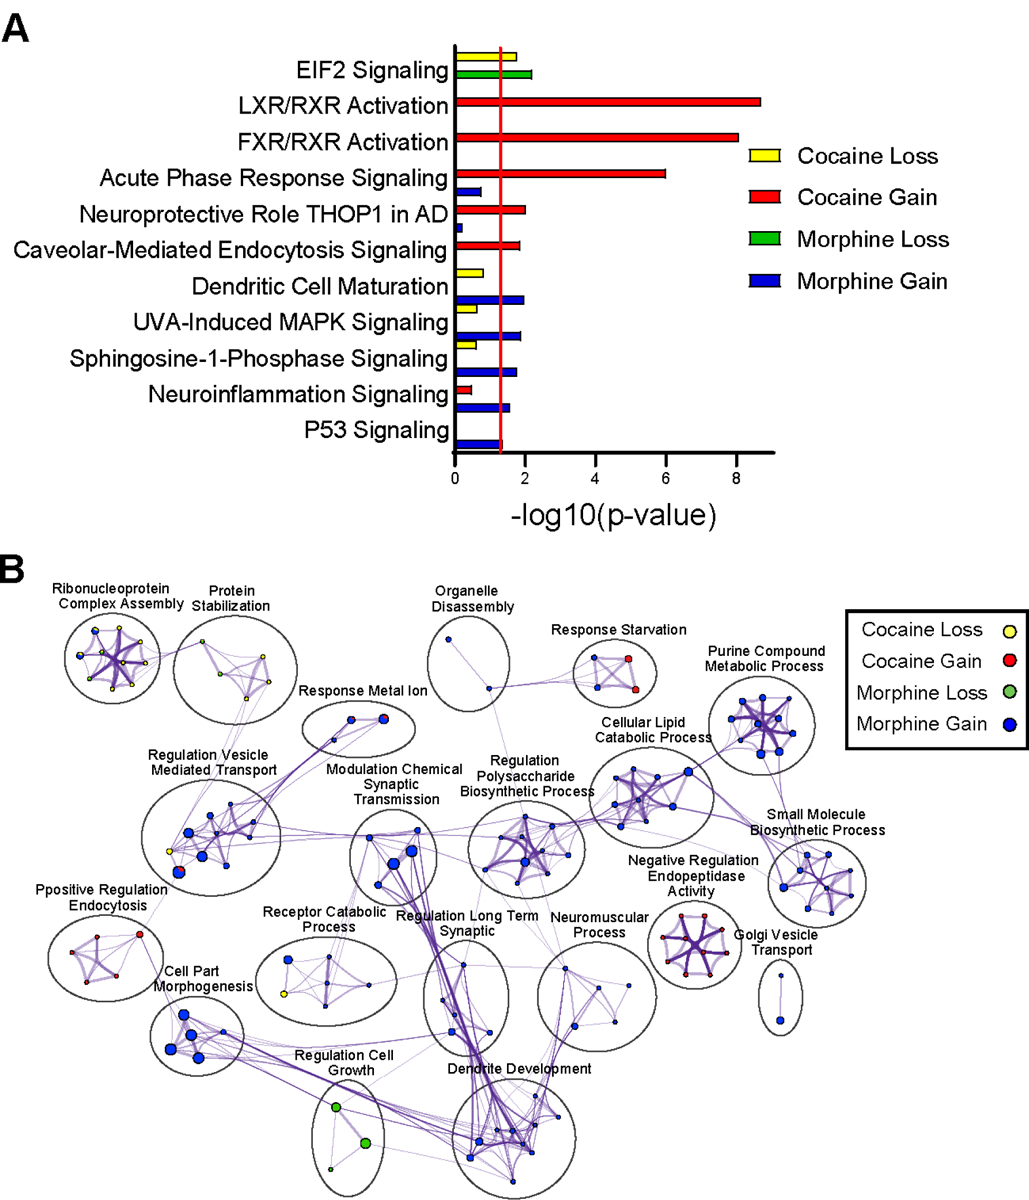
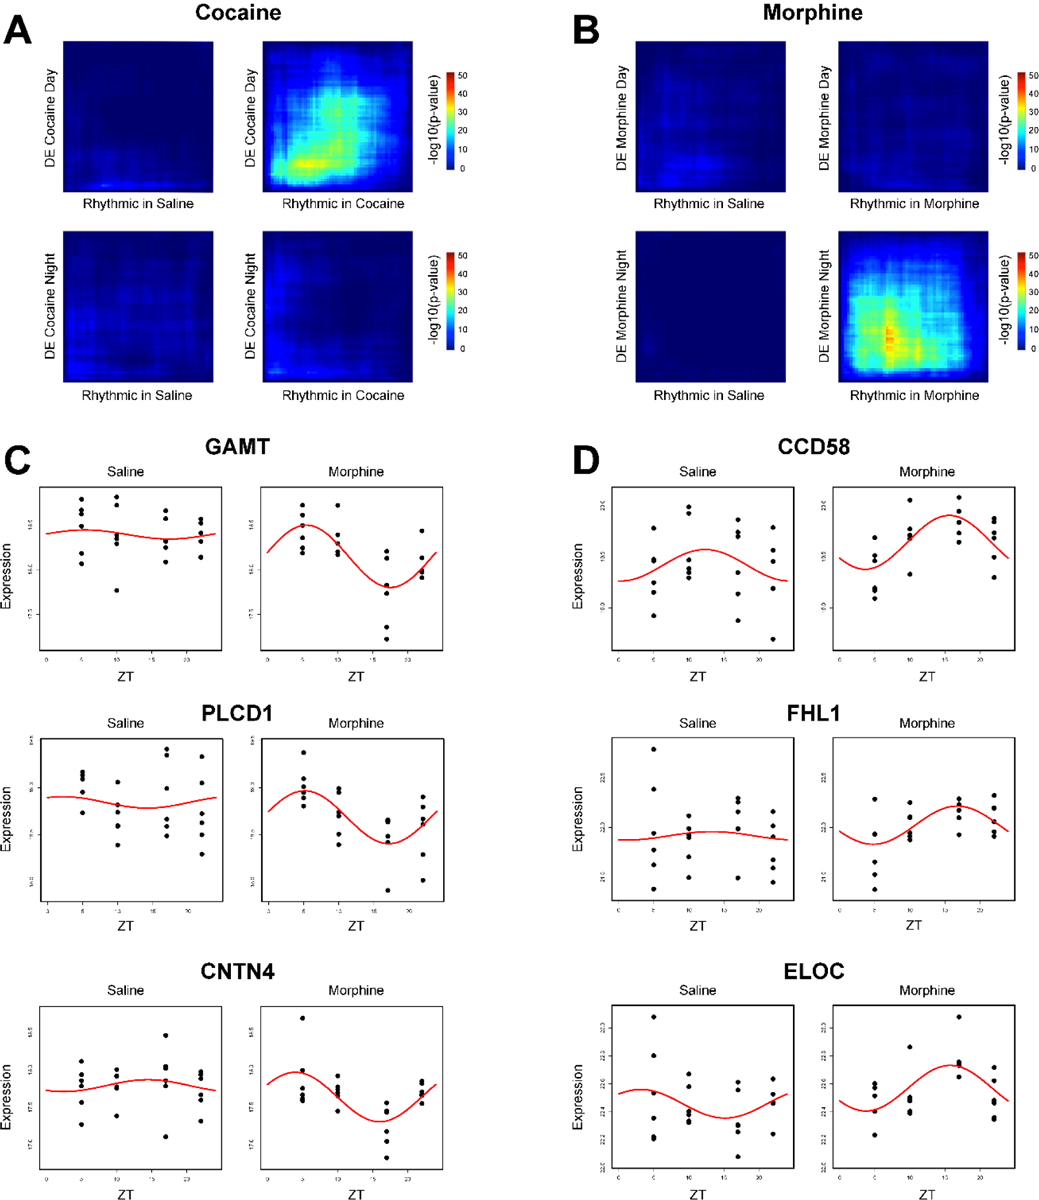
Substance use disorders are associated with disruptions in sleep and circadian rhythms that persist during abstinence and may contribute to relapse risk. Repeated use of substances such as psychostimulants and opioids may lead to significant alterations in molecular rhythms in the nucleus accumbens (NAc), a brain region central to reward and motivation. Previous studies have identified rhythm alterations in the transcriptome of the NAc and other brain regions following the administration of psychostimulants or opioids. However, little is known about the impact of substance use on the diurnal rhythms of the proteome in the NAc. We used liquid chromatography coupled to tandem mass spectrometry-based quantitative proteomics, along with a data-independent acquisition analysis pipeline, to investigate the effects of cocaine or morphine administration on diurnal rhythms of proteome in the mouse NAc. Overall, our data reveal cocaine and morphine differentially alter diurnal rhythms of the proteome in the NAc, with largely independent differentially expressed proteins dependent on time-of-day. Pathways enriched from cocaine altered protein rhythms were primarily associated with glucocorticoid signaling and metabolism, whereas morphine was associated with neuroinflammation. Collectively, these findings are the first to characterize the diurnal regulation of the NAc proteome and demonstrate a novel relationship between the phase-dependent regulation of protein expression and the differential effects of cocaine and morphine on the NAc proteome. The proteomics data in this study are available via ProteomeXchange with identifier PXD042043.
Keywords: circadian rhythms; cocaine; morphine; nucleus accumbens; proteomics.
Conflict of interest statement
The authors have no conflict of interest, nor competing financial interest to declare.
Figures
Update of
-
Differential Effects of Cocaine and Morphine on the Diurnal Regulation of the Mouse Nucleus Accumbens Proteome.bioRxiv [Preprint]. 2023 Mar 2:2023.03.01.530696. doi: 10.1101/2023.03.01.530696. bioRxiv. 2023. Update in: J Proteome Res. 2023 Jul 7;22(7):2377-2390. doi: 10.1021/acs.jproteome.3c00126. PMID: 36909659 Free PMC article. Updated. Preprint.
Similar articles
-
Differential Effects of Cocaine and Morphine on the Diurnal Regulation of the Mouse Nucleus Accumbens Proteome.bioRxiv [Preprint]. 2023 Mar 2:2023.03.01.530696. doi: 10.1101/2023.03.01.530696. bioRxiv. 2023. Update in: J Proteome Res. 2023 Jul 7;22(7):2377-2390. doi: 10.1021/acs.jproteome.3c00126. PMID: 36909659 Free PMC article. Updated. Preprint.
-
Increased cocaine reward in offspring of females exposed to morphine during adolescence.Psychopharmacology (Berl). 2019 Apr;236(4):1261-1272. doi: 10.1007/s00213-018-5132-0. Epub 2018 Nov 30. Psychopharmacology (Berl). 2019. PMID: 30506236
-
Circadian transcription factor NPAS2 and the NAD+ -dependent deacetylase SIRT1 interact in the mouse nucleus accumbens and regulate reward.Eur J Neurosci. 2022 Feb;55(3):675-693. doi: 10.1111/ejn.15596. Epub 2022 Jan 20. Eur J Neurosci. 2022. PMID: 35001440 Free PMC article.
-
Reflections on: "A general role for adaptations in G-Proteins and the cyclic AMP system in mediating the chronic actions of morphine and cocaine on neuronal function".Brain Res. 2016 Aug 15;1645:71-4. doi: 10.1016/j.brainres.2015.12.039. Epub 2015 Dec 29. Brain Res. 2016. PMID: 26740398 Free PMC article. Review.
-
Circadian rhythm disruptions associated with opioid use disorder in synaptic proteomes of human dorsolateral prefrontal cortex and nucleus accumbens.Mol Psychiatry. 2023 Nov;28(11):4777-4792. doi: 10.1038/s41380-023-02241-6. Epub 2023 Sep 6. Mol Psychiatry. 2023. PMID: 37674018 Free PMC article.
Cited by
-
Decoding cocaine-induced proteomic adaptations in the mouse nucleus accumbens.Sci Signal. 2024 Apr 16;17(832):eadl4738. doi: 10.1126/scisignal.adl4738. Epub 2024 Apr 16. Sci Signal. 2024. PMID: 38626009 Free PMC article.
-
Cocaine-Induced Remodeling of the Rat Brain Peptidome: Quantitative Mass Spectrometry Reveals Anatomically Specific Patterns of Cocaine-Regulated Peptide Changes.ACS Chem Neurosci. 2025 Jan 15;16(2):128-140. doi: 10.1021/acschemneuro.4c00327. Epub 2024 Dec 31. ACS Chem Neurosci. 2025. PMID: 39810605 Free PMC article.
-
Cocaine and morphine induce shared and divergent transcriptional regulation in nucleus accumbens D1 and D2 medium spiny neurons.Mol Psychiatry. 2025 Sep;30(9):4247-4257. doi: 10.1038/s41380-025-03004-1. Epub 2025 Apr 5. Mol Psychiatry. 2025. PMID: 40188314
References
-
- Ahmad FB; Rossen LM; Sutton P Provisional drug overdose death counts. https://www.cdc.gov/nchs/nvss/vsrr/drug-overdose-data.htm (accessed Feb 8, 2023).
-
- Seney ML; Kim S-M; Glausier JR; Hildebrand MA; Xue X; Zong W; Wang J; Shelton MA; Phan BN; Srinivasan C; et al. Transcriptional alterations in dorsolateral prefrontal cortex and nucleus accumbens implicate neuroinflammation and synaptic remodeling in opioid use disorder. Biol. Psychiatry 2021, 90, 550–562. - PMC - PubMed
Publication types
MeSH terms
Substances
Grants and funding
LinkOut - more resources
Full Text Sources
