

Toward Gene-Correlated Spatially Resolved Metabolomics with Fingerprint Coherent Raman Imaging
- PMID: 37311254
- PMCID: PMC10316396
- DOI: 10.1021/acs.jpcb.3c01446
Toward Gene-Correlated Spatially Resolved Metabolomics with Fingerprint Coherent Raman Imaging
Erratum in
-
Correction to "Toward Gene-Correlated Spatially Resolved Metabolomics with Fingerprint Coherent Raman Imaging".J Phys Chem B. 2023 Aug 24;127(33):7416. doi: 10.1021/acs.jpcb.3c05167. Epub 2023 Aug 9. J Phys Chem B. 2023. PMID: 37555814 Free PMC article. No abstract available.
Abstract
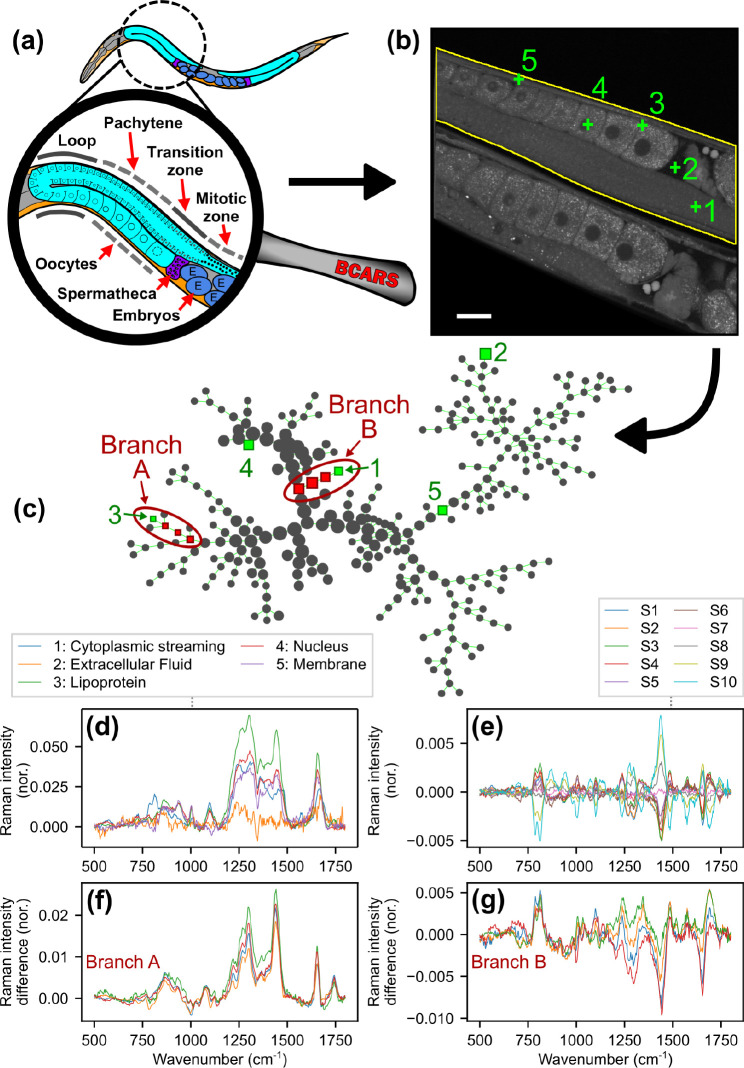
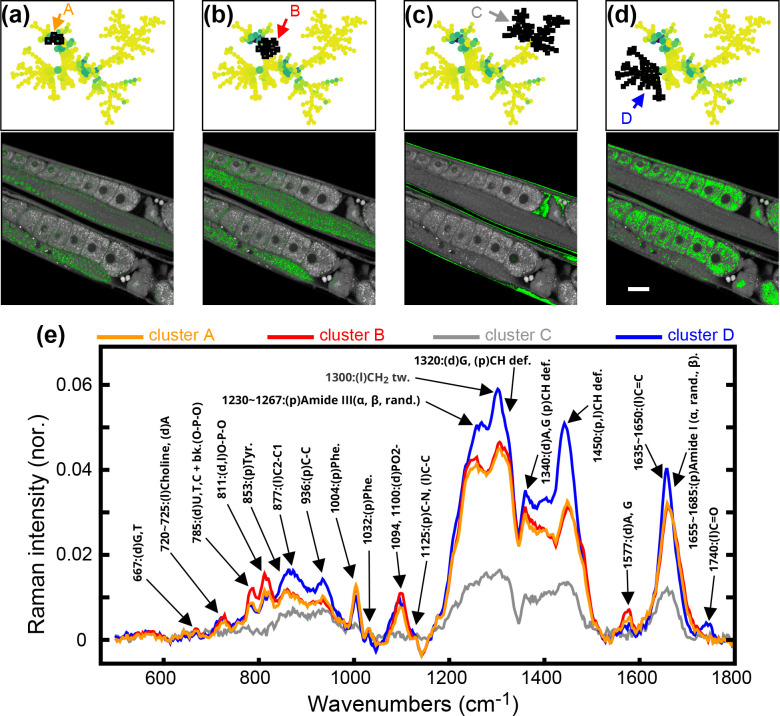
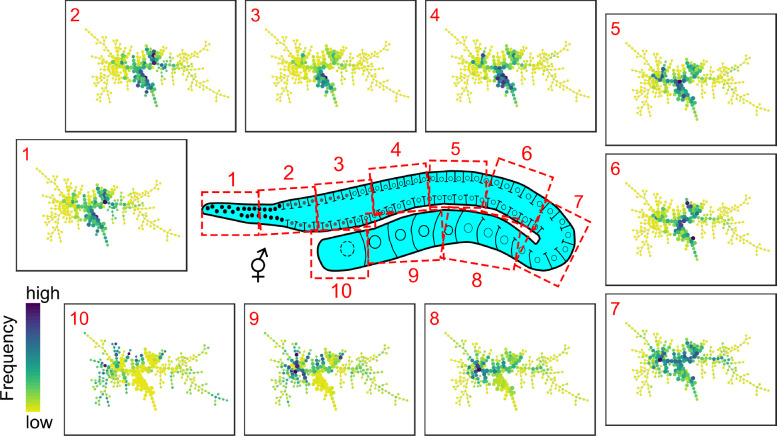
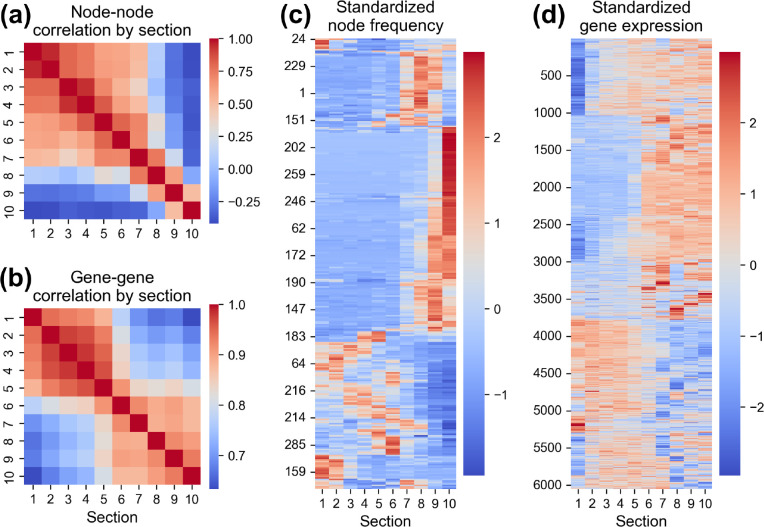
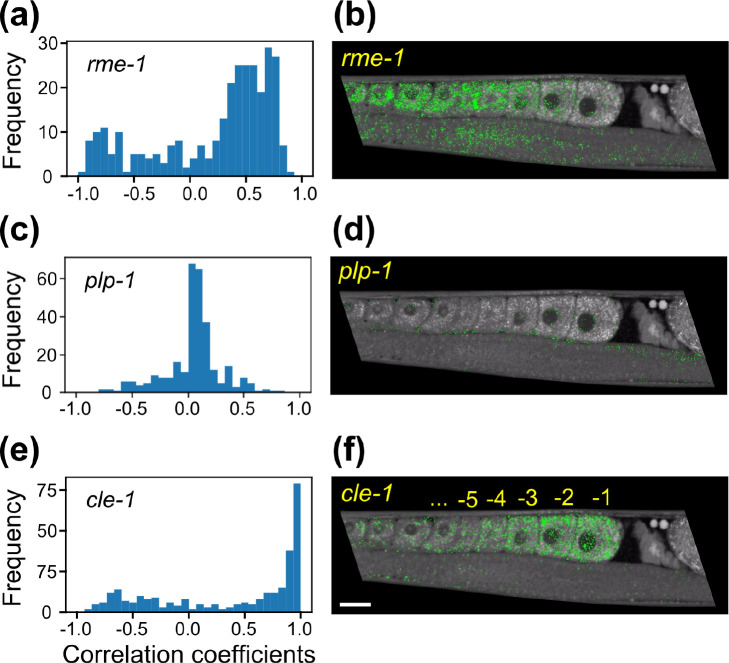
Raman spectroscopy has long been known to provide sufficient information to discriminate distinct cell phenotypes. Underlying this discriminating capability is that Raman spectra provide an overall readout of the metabolic profiles that change with transcriptomic activity. Robustly associating Raman spectral changes with the regulation of specific signaling pathways may be possible, but the spectral signals of interest may be weak and vary somewhat among individuals. Establishing a Raman-to-transcriptome mapping will thus require tightly controlled and easily manipulated biological systems and high-throughput spectral acquisition. We attempt to meet these requirements using broadband coherent anti-Stokes Raman scattering (BCARS) microscopy to spatio-spectrally map the C. elegans hermaphrodite gonad in vivo at subcellular resolution. The C. elegans hermaphrodite gonad is an ideal model system with a sequential, continuous process of highly regulated spatiotemporal cellular events. We demonstrate that the BCARS spatio-spectral signatures correlate with gene expression profiles in the gonad, evincing that BCARS has potential as a spatially resolved omics surrogate.
Conflict of interest statement
The authors declare no competing financial interest.
Figures
Similar articles
-
Fingerprint-to-CH stretch continuously tunable high spectral resolution stimulated Raman scattering microscope.J Biophotonics. 2019 Sep;12(9):e201900028. doi: 10.1002/jbio.201900028. Epub 2019 Jun 14. J Biophotonics. 2019. PMID: 31081280
-
Estimation of biological variance in coherent Raman microscopy data of two cell lines using chemometrics.Analyst. 2024 Aug 19;149(17):4395-4406. doi: 10.1039/d4an00648h. Analyst. 2024. PMID: 39007215
-
Full-Spectrum CARS Microscopy of Cells and Tissues with Ultrashort White-Light Continuum Pulses.J Phys Chem B. 2023 Jun 1;127(21):4733-4745. doi: 10.1021/acs.jpcb.3c01443. Epub 2023 May 17. J Phys Chem B. 2023. PMID: 37195090 Free PMC article.
-
Stimulated Raman scattering microscopy in chemistry and life science - Development, innovation, perspectives.Biotechnol Adv. 2022 Nov;60:108003. doi: 10.1016/j.biotechadv.2022.108003. Epub 2022 Jun 9. Biotechnol Adv. 2022. PMID: 35690271 Review.
-
Coherent anti-stokes Raman scattering microscopy for high speed non- staining biomolecular imaging.Curr Pharm Biotechnol. 2013;14(2):150-8. Curr Pharm Biotechnol. 2013. PMID: 22356111 Review.
Cited by
-
Broadband coherent anti-Stokes Raman scattering (BCARS) microscopy for rapid, label-free biological imaging.Rev Sci Instrum. 2025 Apr 1;96(4):043706. doi: 10.1063/5.0253841. Rev Sci Instrum. 2025. PMID: 40257323
-
Imaging immunometabolism in situ in live animals.Immunometabolism (Cobham). 2024 Jul;6(3):e00044. doi: 10.1097/IN9.0000000000000044. Epub 2024 Jul 31. Immunometabolism (Cobham). 2024. PMID: 39296471 Free PMC article.
-
Beneficial Soil Fungus Kills Predatory Nematodes with Dehydropeptides Translocating into the Animal Gut.J Am Chem Soc. 2024 Dec 18;146(50):34702-34710. doi: 10.1021/jacs.4c12989. Epub 2024 Dec 9. J Am Chem Soc. 2024. PMID: 39652677 Free PMC article.
References
Publication types
MeSH terms
Grants and funding
LinkOut - more resources
Full Text Sources
