. 2023 Jun 12;41(6):1032-1047.e4.
doi: 10.1016/j.ccell.2023.05.007.

Single cell clonotypic and transcriptional evolution of multiple myeloma precursor disease

Affiliations

Single cell clonotypic and transcriptional evolution of multiple myeloma precursor disease

Minghao Dang et al. Cancer Cell. .

Abstract

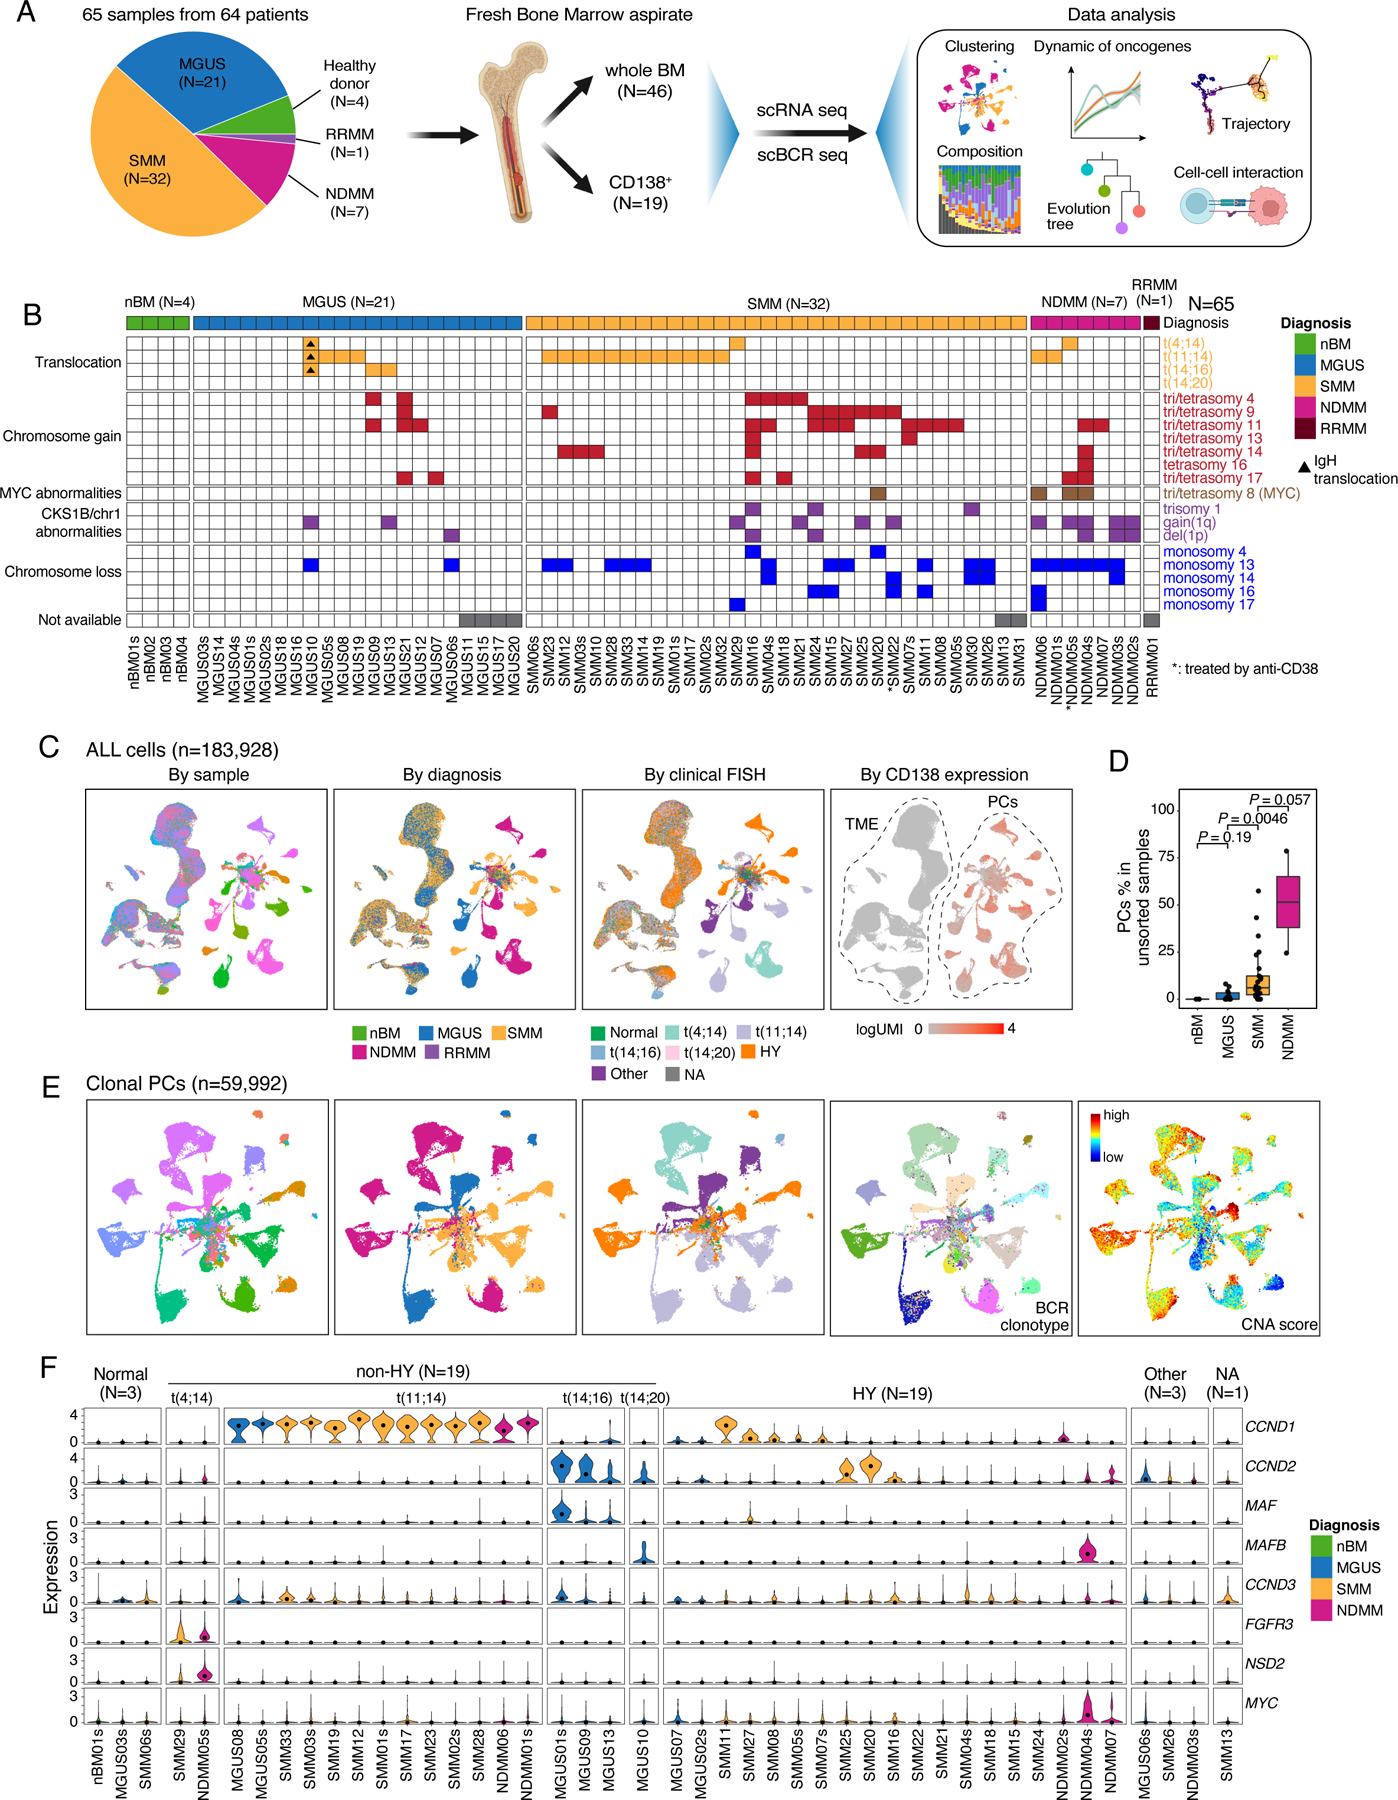
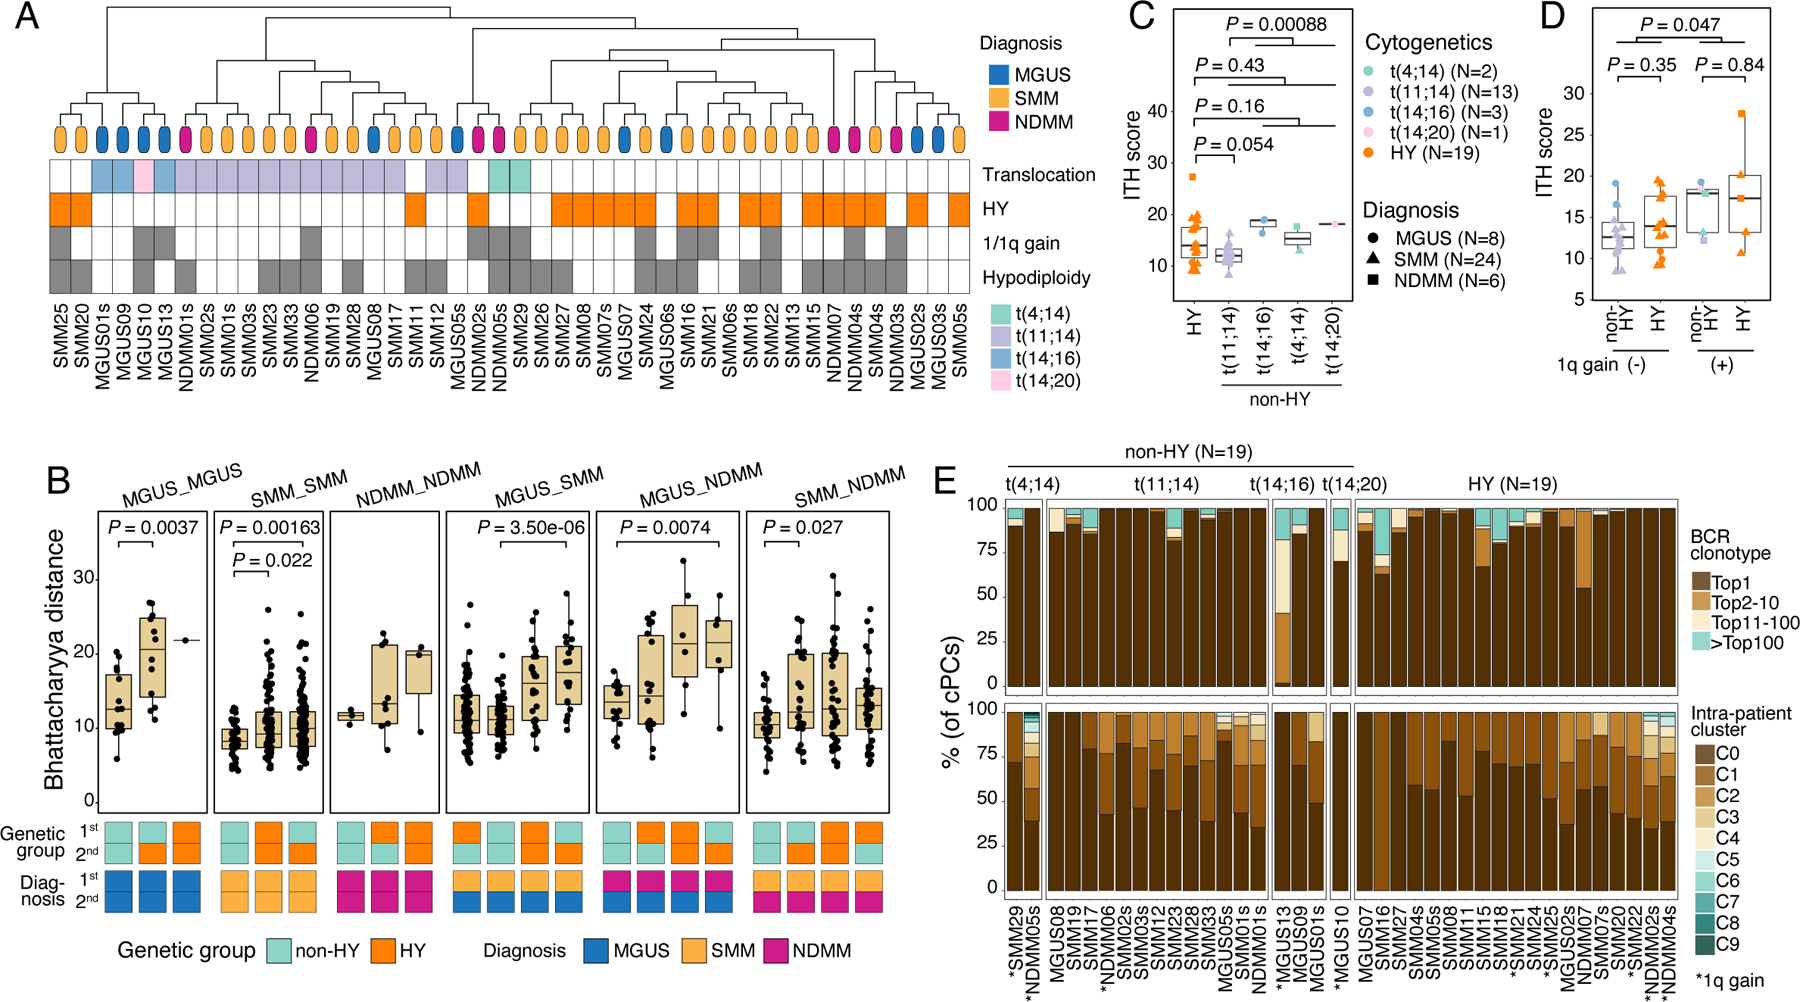
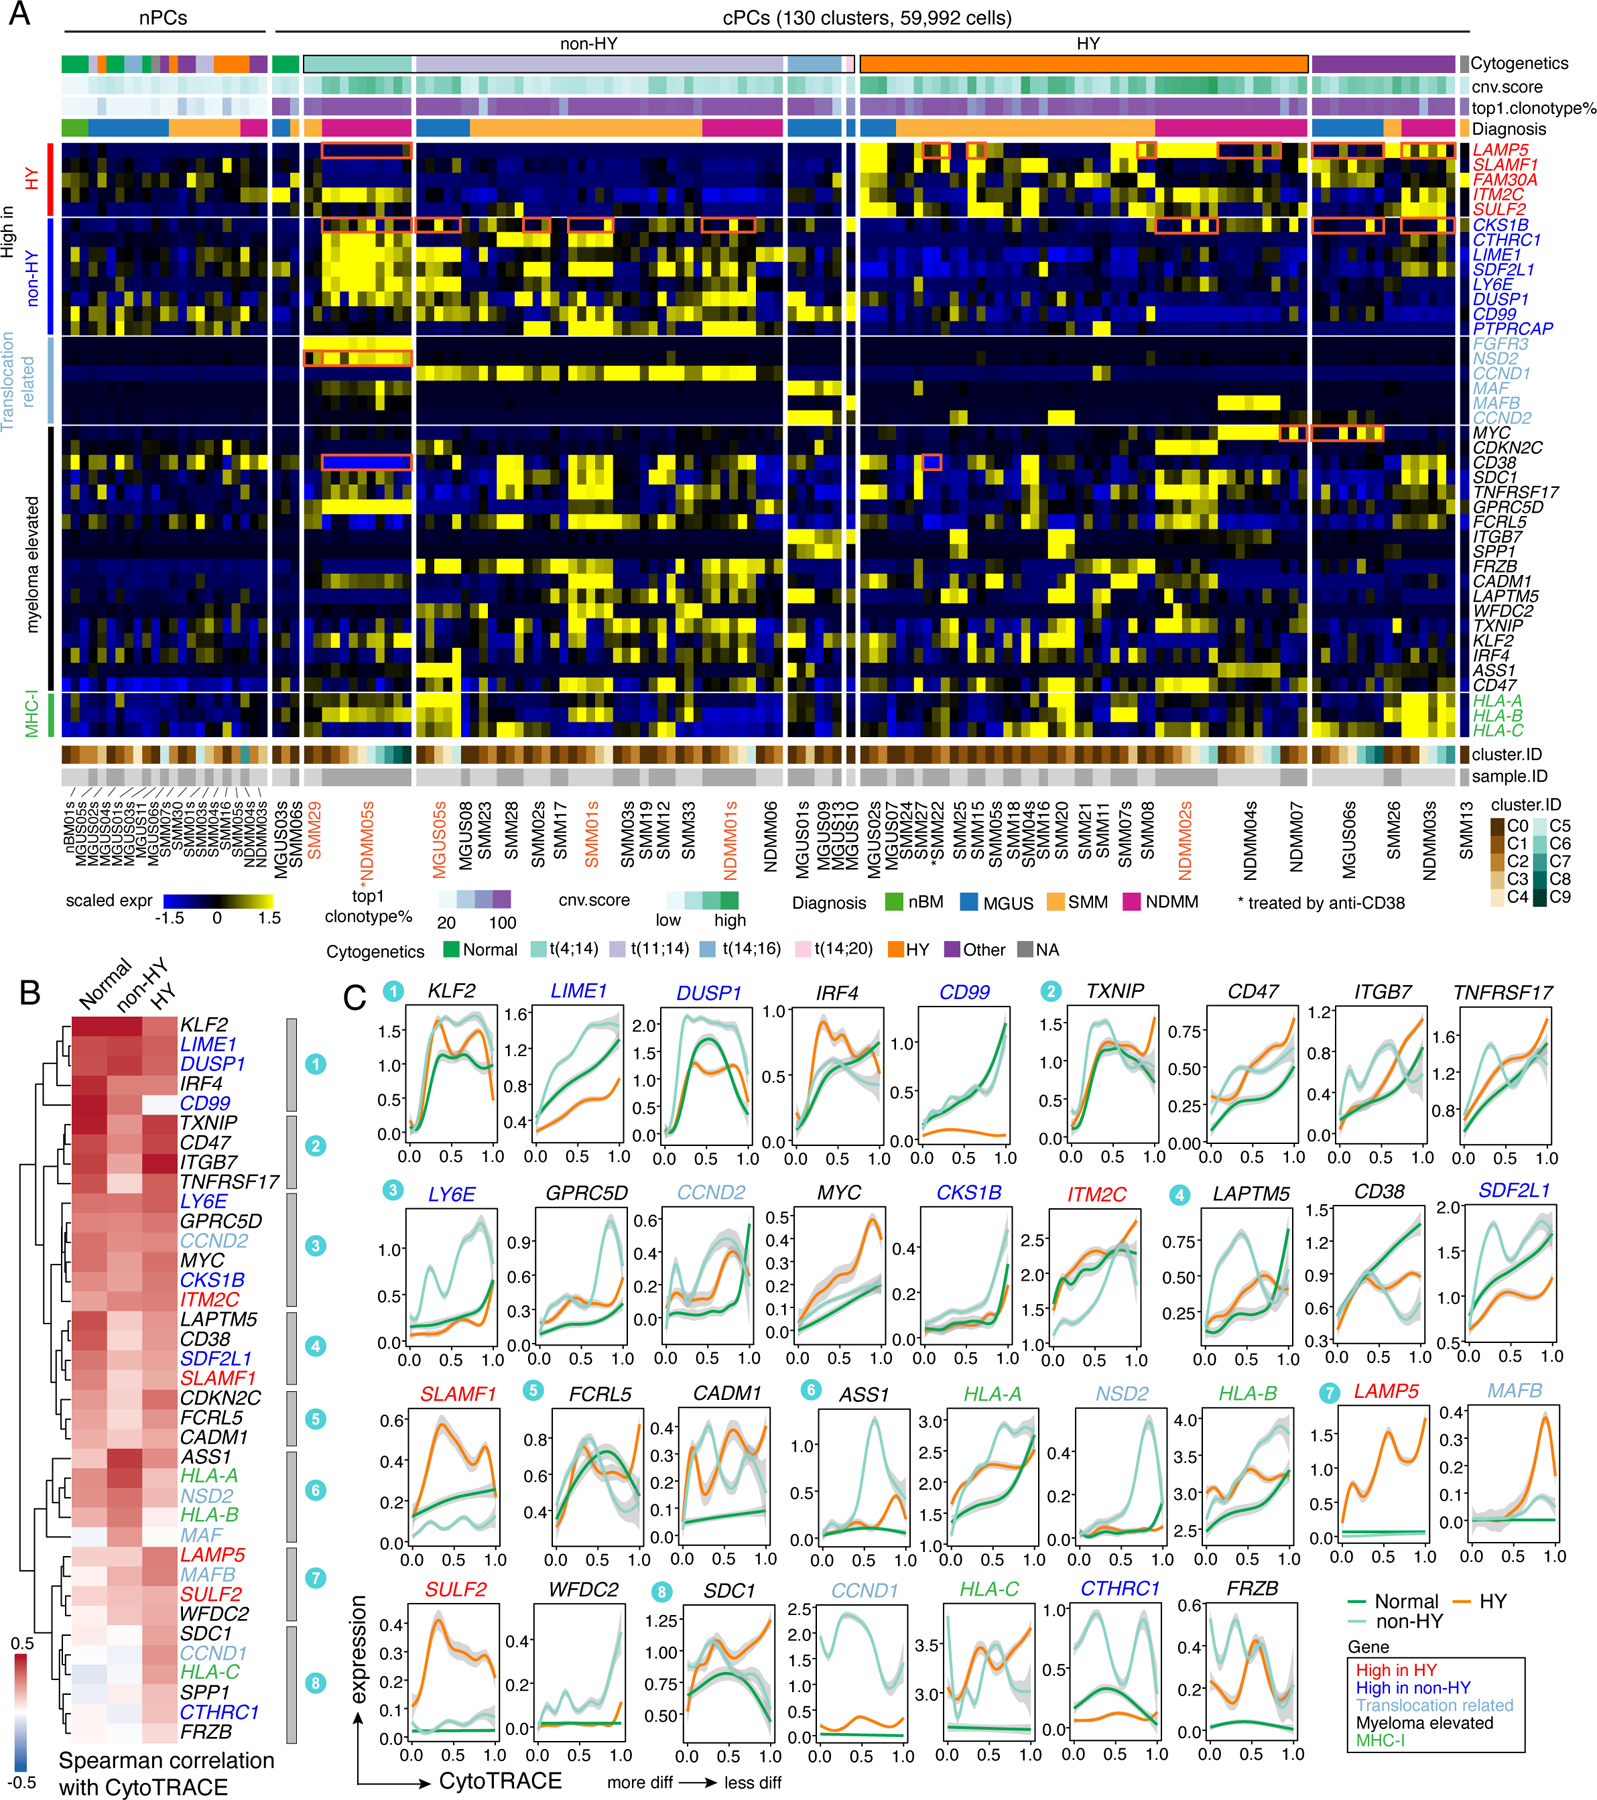
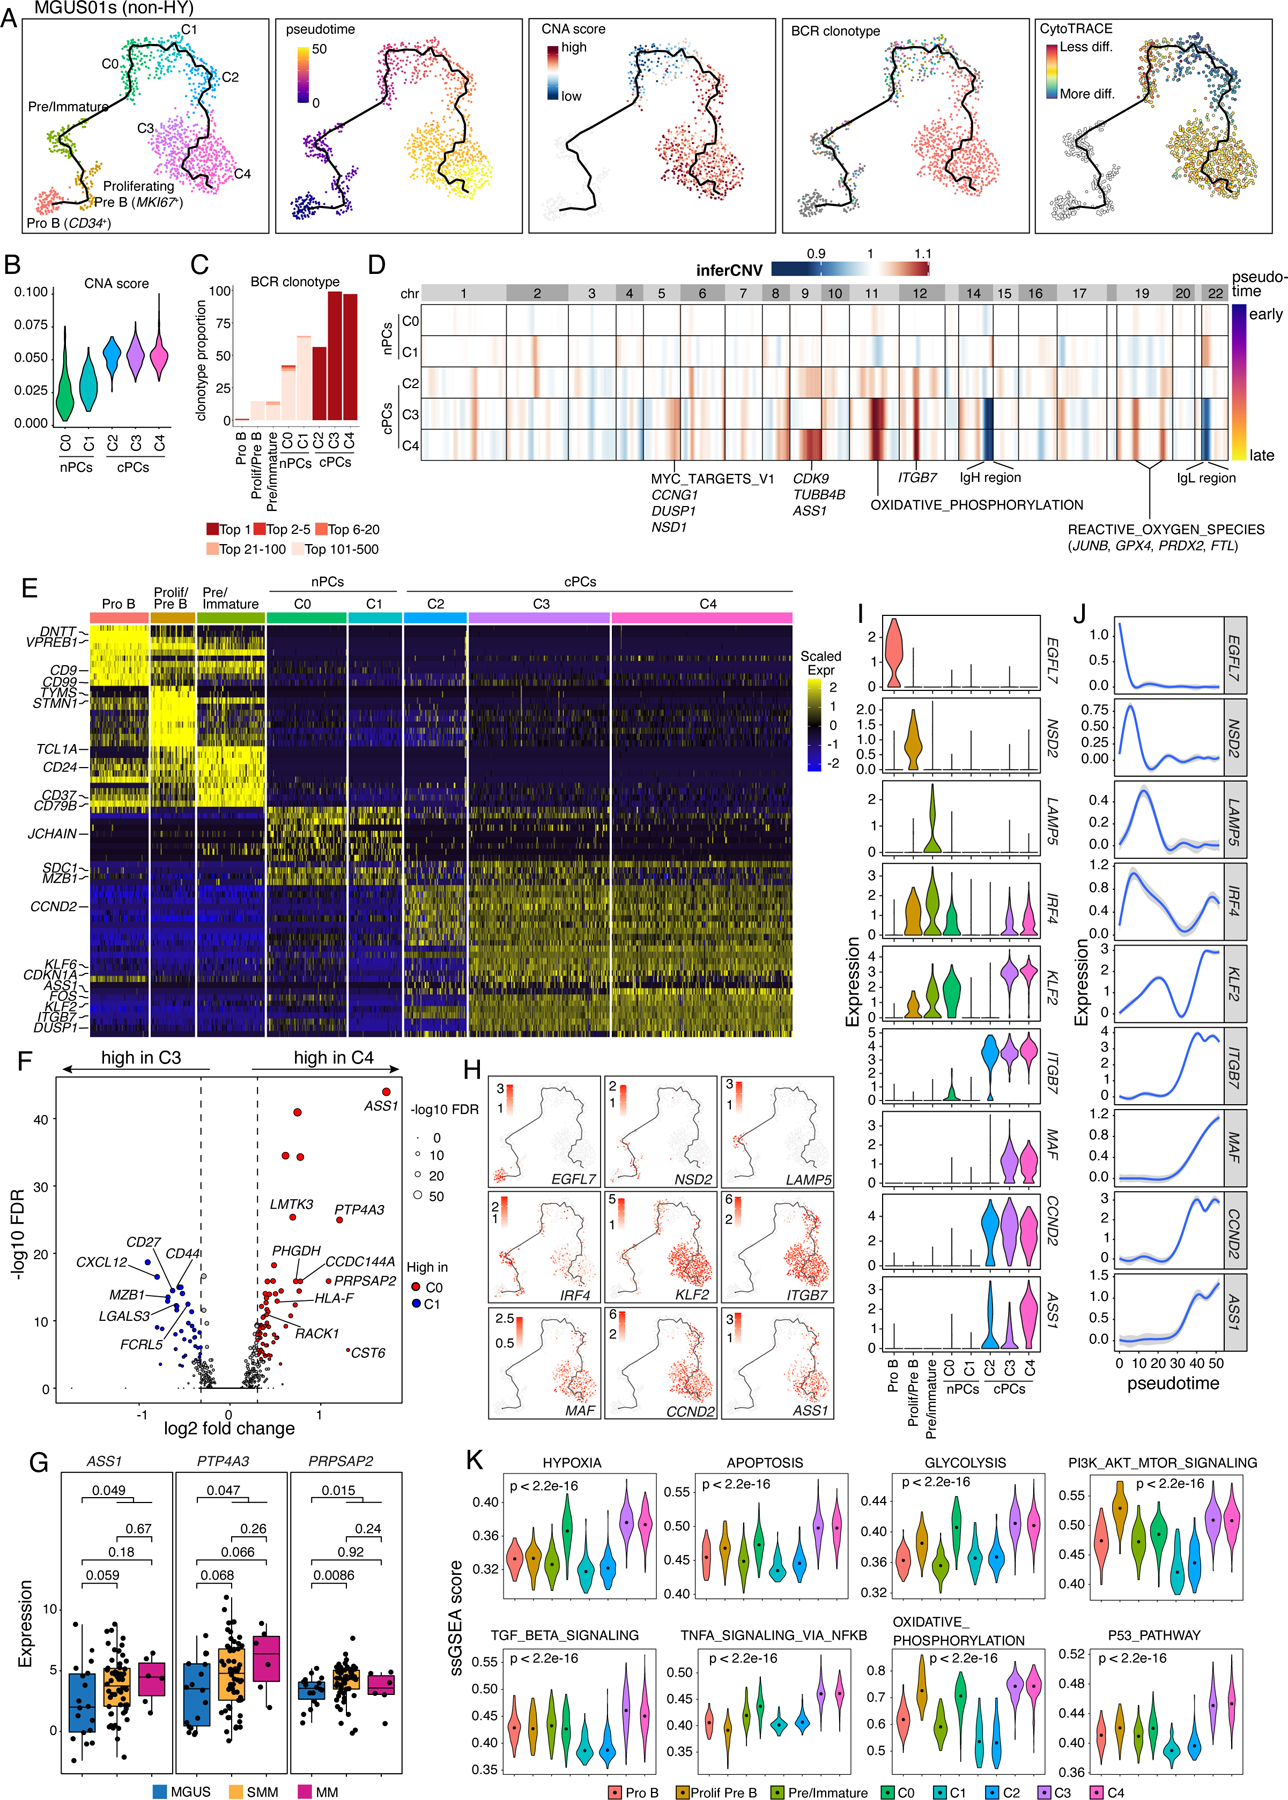
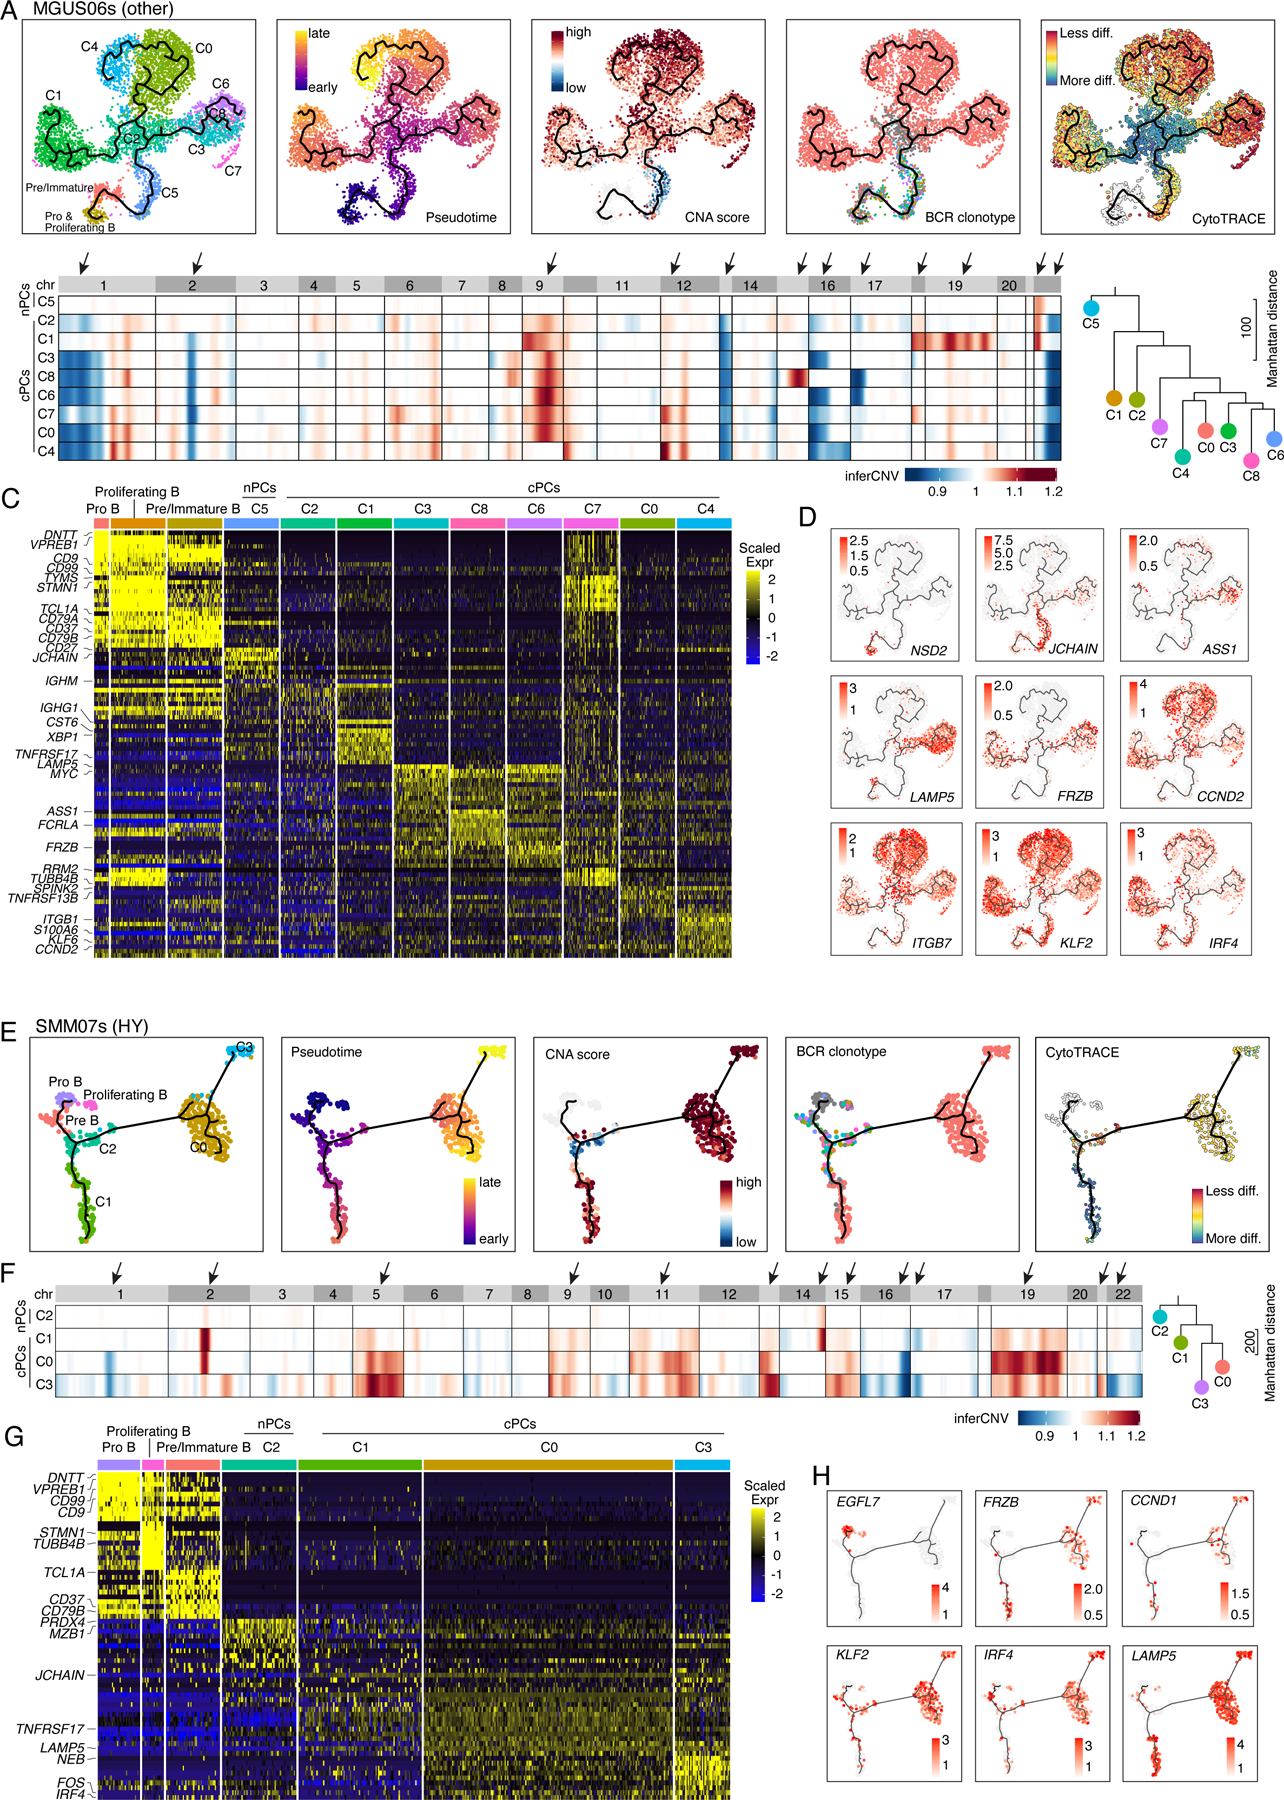
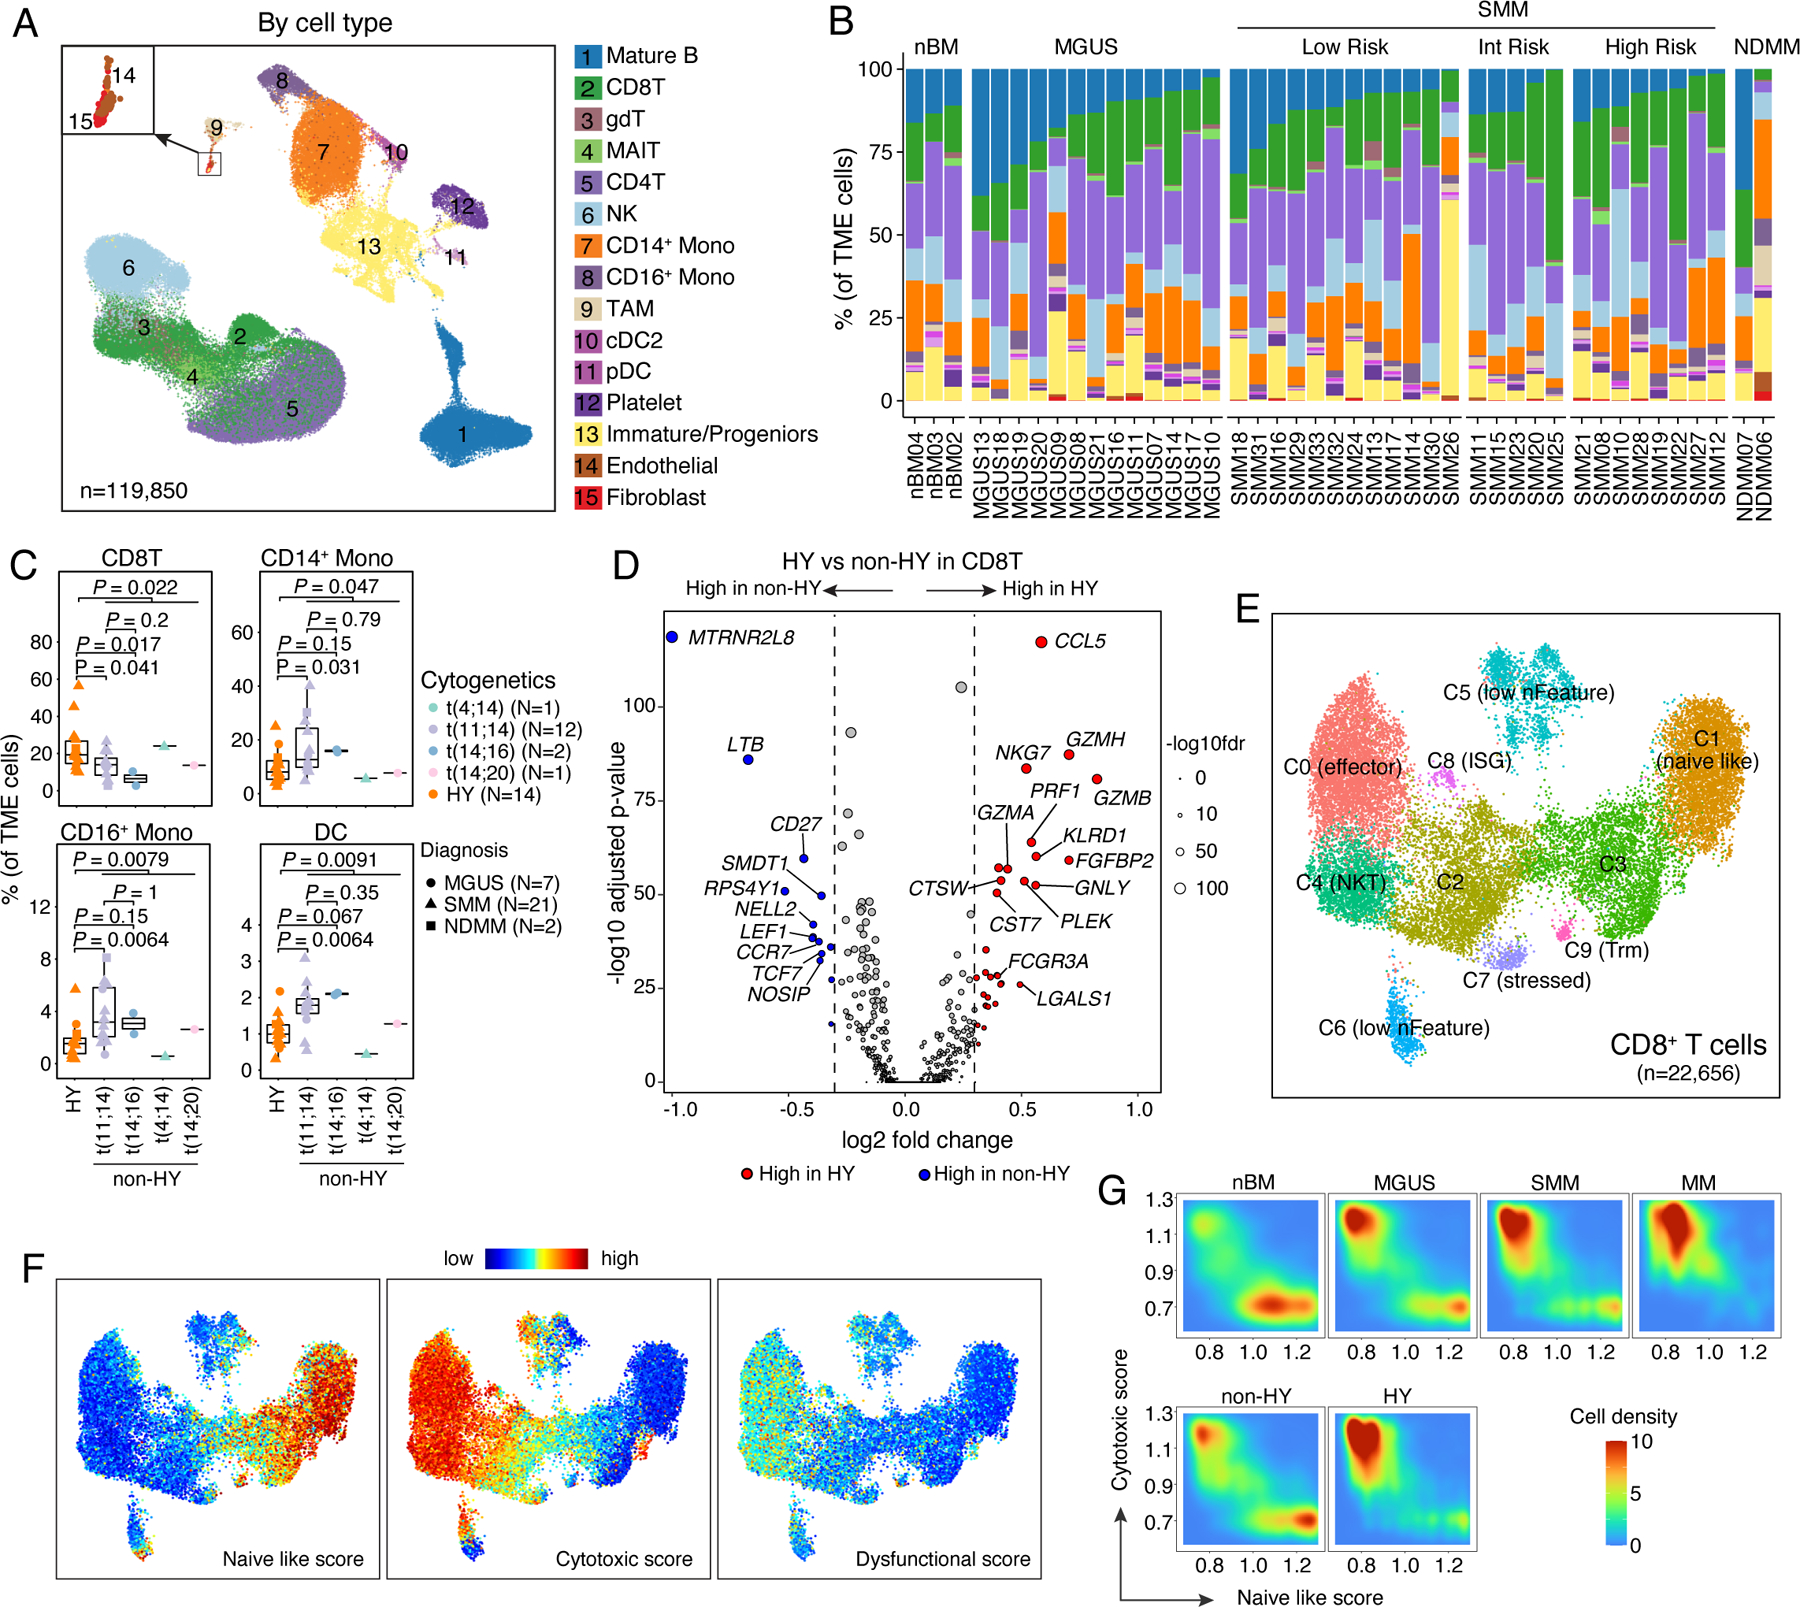
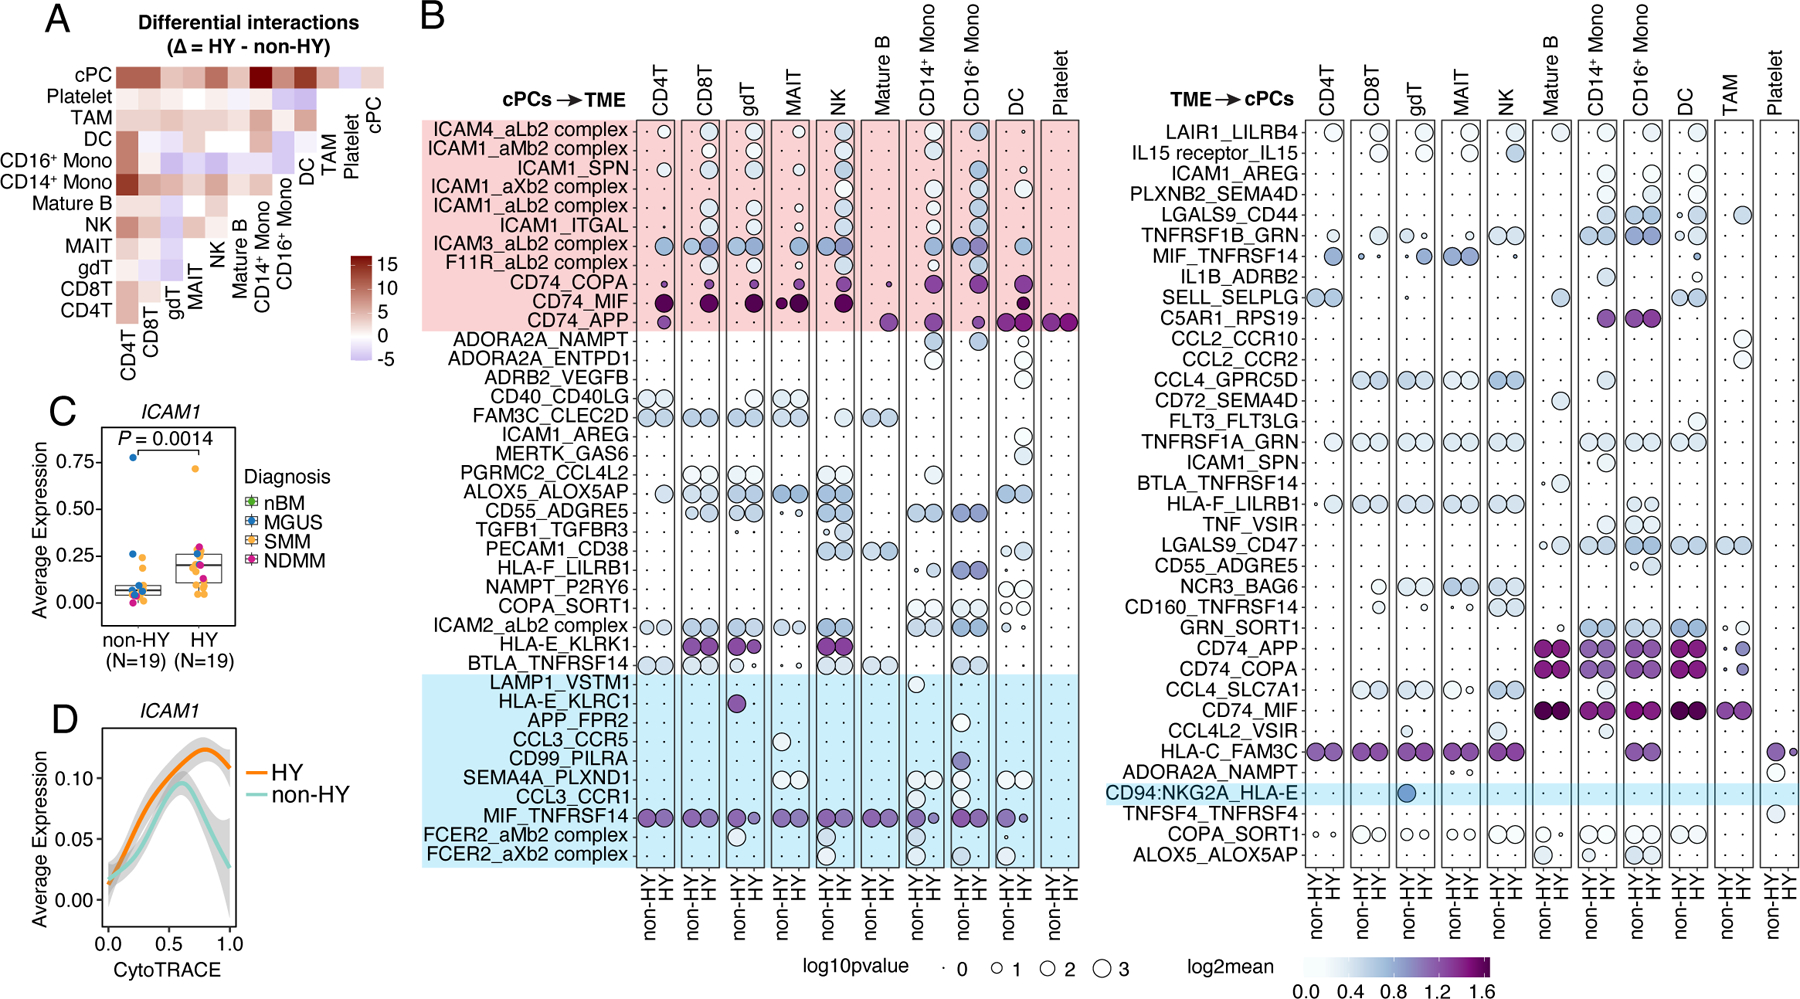
Multiple myeloma remains an incurable disease, and the cellular and molecular evolution from precursor conditions, including monoclonal gammopathy of undetermined significance and smoldering multiple myeloma, is incompletely understood. Here, we combine single-cell RNA and B cell receptor sequencing from fifty-two patients with myeloma precursors in comparison with myeloma and normal donors. Our comprehensive analysis reveals early genomic drivers of malignant transformation, distinct transcriptional features, and divergent clonal expansion in hyperdiploid versus non-hyperdiploid samples. Additionally, we observe intra-patient heterogeneity with potential therapeutic implications and identify distinct patterns of evolution from myeloma precursor disease to myeloma. We also demonstrate distinctive characteristics of the microenvironment associated with specific genomic changes in myeloma cells. These findings add to our knowledge about myeloma precursor disease progression, providing valuable insights into patient risk stratification, biomarker discovery, and possible clinical applications.

Keywords: hyperdiploid; intra-tumoral heterogeneity; monoclonal gammopathy of undetermined significance; multiple myeloma; non-hyperdiploid; single-cell B cell receptor sequencing; single-cell RNA sequencing; smoldering multiple myeloma; tumor evolution; tumor microenvironment.


Conflict of interest statement

Declaration of interests H.C.L. has received consulting fees from Adaptive Biotechnologies, Celgene, Pimera, and Takeda and research support from Amgen, Daiichi Sankyo, Janssen, and Takeda. S.S.N. has received research support from Kite/Gilead, Celgene, Cellectis, Poseida, Merck, Acerta, Karus, and Bristol Myers Squibb (BMS) and has served as consultant and advisory board member for Kite/Gilead, Celgene, Novartis, Unum Therapeutics, Pfizer, CellMedica, and Merck. R.Z.O. has received consulting fees from Amgen, Inc., BMS, Celgene, GlaxoSmithKline (GSK) Biologicals, Ionis Pharmaceuticals, Inc., Janssen Biotech, Karyopharm Therapeutics, Molecular Partners, Neoleukin Corporation, Oncopeptides AB, Regeneron Pharmaceuticals, Sanofi-Aventis, Servier, and Takeda Pharmaceuticals North America, Inc. Clinical research support has come from CARsgen Therapeutics, Celgene, Exelixis, Janssen Biotech, Sanofi-Aventis, Takeda Pharmaceuticals North America, Inc., while laboratory research support has come from Asylia Therapeutics, Inc., BioTheryX, and Heidelberg Pharma. E.E.M. has received research support from Sanofi, Quest Diagnostics, Novartis, JW Pharma, Merck, and GSK and consultant fees from Takeda, Celgene, Sanofi, Seattle Genetics, BMS, and GSK.

Figures

Figure 1.
Figure 1.. Workflow, sample information and single cell transcriptome map of this study.
(A) A schema depicting the workflow of this study. (B) fluorescence in situ hybridization (FISH) results of 65 samples in this study. Samples were grouped by their diagnosis. (C) Uniform manifold approximation and projection (UMAP) visualization of unsupervised clustering analysis of all cells except erythrocytes (n = 183,928) that passed quality filtering. Cells were color coded for CD138 expression level (left), diagnosis (middle) and cytogenetic abnormalities determined by FISH (right). (D) Boxplots showing the comparisons of PC proportions in unsorted samples between nBM (N=3), MGUS (N=13), SMM (N=25) and NDMM (N=2). (E) UMAP visualization of unsupervised clustering analysis of all cPCs (n = 59,992) from 44 samples with ≥ 49 cPCs. Cells were color coded (from left to right) for their corresponding patient origins, diagnosis, cytogenetic abnormalities, BCR clonotypes and inferred CNA score. (F) Violin plots showing expression of translocation related genes in cPCs in 44 patients with ≥ 49 cPCs and nPCs in 1 healthy donor. Samples were grouped by their cytogenetic abnormalities and color coded by diagnosis. See also Figures S1, S2, Tables S1–S3.
Figure 2.
Figure 2.. Characterization of cPCs.
(A) Hierarchical clustering analysis (top) showing similarities of transcriptome of cPCs across patients (N=44). Leaves of the phylogenetic tree were color coded by their diagnosis. Annotations (bottom) showing the states of cytogenetic abnormalities of each patient. (B) Boxplot showing the comparisons of Bhattacharyya distance between different diagnosis-cytogenetics groups. Comparisons were ordered by their median values in each group. Annotation tracks at the bottom showed the diagnosis and cytogenetic abnormalities of the two samples between which Bhattacharyya distance was calculated. (C) Boxplots showing the comparison of ITH score between samples in HY and different translocation subgroups. Dots are color-coded by cytogenetic abnormalities and shape-coded by disease stages. (D) Boxplots showing the comparisons of ITH score between samples with 1q gain (N=10) and those without (N=28). Dots are color-coded according to cytogenetics abnormalities and shape-coded based on disease stages. (E) Stacked bar charts showing BCR clonotype (upper) and intra-sample subcluster (lower) distributions in each non-HY (N=19) and HY (N=19) patient. Clonotypes were grouped and colored by clonotype frequency categories. See also Figure S3.
Figure 3.
Figure 3.. Intra-sample subcluster heterogeneity of myeloma related key genes is associated with genomic abnormalities and tumor evolution.
(A) Heatmap showing the scaled average expression of myeloma related key genes in PCs at intra-sample subcluster level. Clusters were firstly grouped by normal or clonal. Within the cPCs, clusters were ordered by cytogenetic abnormalities of corresponding patient origins. The top annotation tracks show (from top to bottom): the cytogenetic abnormalities of corresponding patient, the cluster averaged CNA score, proportion of cells harboring the most abundant clonotype in the cluster and diagnosis of corresponding patient. (B) Heatmap with hierarchical clustering by row showing spearman correlations of gene expression levels with CytoTRACE score separately in normal, non-HY and HY cells. Genes were color coded as shown in (A). (C) Two-dimensional plots showing the dynamic changes in expression levels of genes as shown in (A) along the CytoTRACE score. Genes were grouped by their cluster as shown in (B) and color coded as shown in (A). Shaded band, 95th confidence interval. See also Figure S4, Table S4.
Figure 4.
Figure 4.. Intra-patient heterogeneity and evolution of B/plasma subpopulations for patient MGUS01s.
(A) Uniform manifold approximation and projection (UMAP) visualization of unsupervised clustering analysis of B cells and PCs from MGUS01s (n=1,210) with inferred trajectory and cluster label, pseudotime, CNA score, BCR clonotype and CytoTRACE score (from left to right) mapped on. Pro B cell cluster was selected as the root of trajectory. (B) Violin plots showing the differences of CNA scores in 5 PC subclusters. Clusters were ordered from early stage to late stage based on inferred pseudotime. (C) Stacked bar chart showing BCR clonotype distributions in each B and PC subclusters. Clonotypes were grouped and colored by clonotype frequency category. (D) Heatmap on the top showing genome wide inferred CNA profiles for 5 PC clusters of patient MGUS01s. Clusters were ordered by inferred pseudotime as shown on the right-hand side. Enriched hallmark pathways or important genes related to the most striking differences of CNAs between 5 clusters were labelled at the bottom. (E) Heatmap showing scaled expression of top 10 DEGs of B and PC clusters, with selected cluster specific DEGs labeled on the left. (F) Volcano plots of differentially expressed genes between PC cluster C3 and C4. FDR, two-sided Wilcoxon rank sum test with Bonferroni correction. Dashed line, log2FC > 0.3 or < −0.3. Labels, biologically important genes. (G) Boxplot showing the comparisons of expression levels of ASS1, PTP4A3 and PRPSAP2 between MGUS, SMM and MM in our validation cohort. (H) UMAP as in (A) showing the expression of representative genes. (I) The violin plots showing expression of representative genes across different B and PC clusters. Clusters were ordered from early stage to late stage based on inferred pseudotime. (J) Two-dimensional plots showing the dynamic changes in expression levels of representative genes as shown in (H&I) along the pseudotime. Shaded band, 95th confidence interval. (K) The violin plots showing gene set enrichment as measured by ssGSEA score of 10 representative hallmark pathways across different B and PC clusters. P values were calculated by one-way Kruskal-Wallis rank-sum test. See also Figure S5, Table S5.
Figure 5.
Figure 5.. Intra-patient heterogeneity and evolution of B/plasma subpopulations for patient MGUS06s and SMM07s.
(A) Uniform manifold approximation and projection (UMAP) visualization of unsupervised clustering analysis of B cells and PCs from MGUS06s (n=5,660) with inferred trajectory and cluster label, pseudotime, CNA score, BCR clonotype and CytoTRACE score (from left to right) mapped on. Pro B cell cluster was selected as the root of trajectory. (B) Heatmap on the left showing genome wide inferred CNA profiles for 9 PC clusters of patient MGUS06s. Clusters were organized by inferred trajectories. Black arrows indicated the most striking differences of CNAs between 9 clusters. Phylogenetic tree on the right showing minimum evolution trees generated using cluster-averaged/consensus CNA profiles of subclusters for MGUS06s and rooted by a neutral node. (C) Heatmap showing scaled expression of top 10 DEGs of B and PC clusters, with selected cluster specific DEGs labeled on the left. (D) UMAP as in (A) showing the expression of representative genes. (E) UMAP visualization of unsupervised clustering analysis of B cells and PCs from SMM07s (n=483) with inferred trajectory and cluster label, pseudotime, CNA score, BCR clonotype and CytoTRACE score (from left to right) mapped on. Pro B cell cluster was selected as the root of trajectory. (F) Heatmap on the left showing genome wide inferred CNA profiles for 4 PC clusters of patient SMM07s. Clusters were organized by inferred trajectories. Black arrows indicated the most striking differences of CNAs between 4 clusters. Phylogenetic tree on the right showing minimum evolution trees generated using cluster-averaged/consensus CNA profiles of subclusters for SMM07s and rooted by a neutral node. (G) Heatmap showing scaled expression of top 10 DEGs of B cell and PC clusters, with selected cluster specific DEGs labeled on the left. (H) UMAP as in (A) showing the expression of representative genes. See also Figure S5, Table S5.
Figure 6.
Figure 6.. Landscape of tumor microenvironment.
(A) Uniform manifold approximation and projection (UMAP) visualization of unsupervised clustering analysis of all TME cells (n = 119,850). Cells were color coded for their identified cell types. (B) Stacked bar plots showing corresponding % cell type composition in each unsorted sample grouped by diagnosis. (C) Boxplots showing the comparisons of CD8 T cell, CD14+ monocyte, CD16+ monocyte and DC proportion in tumor microenvironment between samples in HY and different translocation subgroups. Dots are color-coded by cytogenetic abnormalities and shape-coded by disease stages. (D) Volcano plots of differentially expressed genes in CD8 T cells between non-HY and HY samples. FDR, two-sided Wilcoxon rank sum test with Bonferroni correction. Dashed line, log2FC > 0.3 or < −0.3. Labels, biologically important genes. (E) UMAP visualization of unsupervised sub-clustering analysis of CD8 T cells (n = 22,656). (F) UMAP as shown in (E) with cells colored by naïve-like score, cytotoxic score and dysfunctional score (from left to right) calculated using ssGSEA method. (G) Distribution of CD8 T cells based on their naïve like score and cytotoxic score in patient at different stages of disease (first row) or with different cytogenetic abnormalities (second row). See also Figure S6, Tables S3, S6.
Figure 7.
Figure 7.. Cellular interactions between cPCs and TME cells.
(A) Heatmap showing the different number of interactions between each major cell types (#cells > 1000) inferred by CellphoneDB between non-HY and HY samples. Positive number means increasing in HY. (B) Bubble plot showing the mean expression (color key) and significance (size key) of ligand-receptor pairs between cPCs and TME cells. Only interactions that showed differences between non-HY and HY are shown. (C) Boxplots showing the comparisons of averaged expression of ICAM1 in cPCs between non-HY (N=19) and HY (N=19) at sample level. Dots were color coded by diagnosis. (D) Two-dimensional plots showing the dynamic changes in expression level of ICAM1 along the CytoTRACE score. Shaded band, 95th confidence interval. See also Figure S7.

References

    1. Alexanian R, Delasalle K, Wang M, Thomas S, and Weber D (2012). Curability of multiple myeloma. Bone Marrow Res 2012, 916479. 10.1155/2012/916479. - DOI - PMC - PubMed
    1. Barlogie B, Mitchell A, van Rhee F, Epstein J, Morgan GJ, and Crowley J (2014). Curing myeloma at last: defining criteria and providing the evidence. Blood 124, 3043–3051. 10.1182/blood-2014-07-552059. - DOI - PMC - PubMed
    1. Rajkumar SV, Dimopoulos MA, Palumbo A, Blade J, Merlini G, Mateos MV, Kumar S, Hillengass J, Kastritis E, Richardson P, et al. (2014). International Myeloma Working Group updated criteria for the diagnosis of multiple myeloma. Lancet Oncol 15, e538–548. 10.1016/S1470-2045(14)70442-5. - DOI - PubMed
    1. Kunacheewa C, and Manasanch EE (2020). High-risk smoldering myeloma versus early detection of multiple myeloma: Current models, goals of therapy, and clinical implications. Best Pract Res Clin Haematol 33, 101152. 10.1016/j.beha.2020.101152. - DOI - PMC - PubMed
    1. Dhodapkar MV, Sexton R, Waheed S, Usmani S, Papanikolaou X, Nair B, Petty N, Shaughnessy JD Jr., Hoering A, Crowley J, et al. (2014). Clinical, genomic, and imaging predictors of myeloma progression from asymptomatic monoclonal gammopathies (SWOG S0120). Blood 123, 78–85. 10.1182/blood-2013-07-515239. - DOI - PMC - PubMed

Publication types