. 2023 Jul 11;35(7):1147-1162.e7.
doi: 10.1016/j.cmet.2023.05.008. Epub 2023 Jun 12.

Ketogenic diet promotes tumor ferroptosis but induces relative corticosterone deficiency that accelerates cachexia

Affiliations

Ketogenic diet promotes tumor ferroptosis but induces relative corticosterone deficiency that accelerates cachexia

Miriam Ferrer et al. Cell Metab. .

Abstract

Glucose dependency of cancer cells can be targeted with a high-fat, low-carbohydrate ketogenic diet (KD). However, in IL-6-producing cancers, suppression of the hepatic ketogenic potential hinders the utilization of KD as energy for the organism. In IL-6-associated murine models of cancer cachexia, we describe delayed tumor growth but accelerated cachexia onset and shortened survival in mice fed KD. Mechanistically, this uncoupling is a consequence of the biochemical interaction of two NADPH-dependent pathways. Within the tumor, increased lipid peroxidation and, consequently, saturation of the glutathione (GSH) system lead to the ferroptotic death of cancer cells. Systemically, redox imbalance and NADPH depletion impair corticosterone biosynthesis. Administration of dexamethasone, a potent glucocorticoid, increases food intake, normalizes glucose levels and utilization of nutritional substrates, delays cachexia onset, and extends the survival of tumor-bearing mice fed KD while preserving reduced tumor growth. Our study emphasizes the need to investigate the effects of systemic interventions on both the tumor and the host to accurately assess therapeutic potential. These findings may be relevant to clinical research efforts that investigate nutritional interventions such as KD in patients with cancer.

Keywords: GDF-15; IL-6; NADPH; cachexia; cancer; corticosterone; ferroptosis; ketogenic diet; lipid peroxidation; steroid.


Conflict of interest statement

Declaration of interests The authors declare no competing interests.

Figures
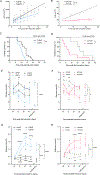
Figure 1.
Figure 1.. KD delays tumor growth but shortens OS in C26 and KPC murine models of cancer cachexia.
(A) Longitudinal tumor volume in C26 mice fed KD or NF (n=12). (B) Longitudinal tumor area in KPC mice fed KD or NF (n=8). (C) OS of C26 and LM mice on KD or NF (n=7 LM, n=17 C26). (D) OS of KPC and PC mice fed KD or NF (n=5–8). (E-F) Longitudinal glucose measurements in C26 and LM mice (n=7–14 LM, n=20 C26) I, and in KPC and PC mice (n=8–10) (F), fed either KD or NF. (G-H) Longitudinal ketone measurements in C26 and LM mice (n=5–14 LM, n=22–23 C26) (G), and in KPC and PC mice (n=8–10) (H), fed either KD or NF. Overall survival (OS): time until mice reach >15% bodyweight loss. Differences in (A-B) were assessed by fitting a mixed effect model with a random component for each individual mouse. Kaplan–Meier curves in (C-D) were statistically analyzed by using the log-rank (Mantel–Cox) test. Two-way ANOVA statistical tests with Tukey’s correction for post hoc comparisons were performed in (E-H).
Figure 2.
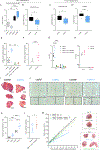
Figure 2.. KD induces ferroptotic cell death of cancer cells that can be prevented by NAC.
(A-B) Quantification by UPLC-MS/MS of 4-HNE (A) and GSH/GSSG ratio (B) in the liver of C26 and LM mice on KD or NF (n=5–8). (C-D) Quantification by UPLC-MS/MS of GSH/GSSG ratio (C) and cysteine (D) in the tumor of C26 mice (n=7). (E-F) Detection of 4-HNE adducts in tumor lysates from C26 mice untreated or treated with NAC (n=3) © and from KPC mice (n=5–6) (F) fed KD or NF. (G-H) Iron concentration in tumors from C26 mice fed KD or NF, untreated or treated with NAC (n=5) (G), and in tumors from KPC mice fed KD or NF (n=6) (H). (I) H&E staining of tumors from C26 mice fed KD or NF. (J-K) Representative images of IHC staining (J) and quantification of speckle pattern formation (K) in liver tissue from C26 and LM mice fed KD or NF. (L) Tumor weight at the time of cachexia in C26 mice fed KD untreated or treated with NAC (n=7–10). (M) Longitudinal tumor growth in C26 mice fed KD or NF, and treated with Liproxstatin-1 (10mg/kg) or vehicle (n=5–10). One-way ANOVA with Tukey’s correction for post hoc testing was used in (A, E, G, K). Statistical differences in (B-D, H, L) were examined using an unpaired two-tailed Student’s t-test with Welch’s correction. Simple linear regression model was applied to (M).
Figure 3.
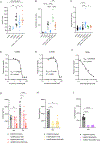
Figure 3.. KD induces relative corticosterone deficiency in C26-tumor bearing mice.
(A-B) Plasma corticosterone levels in cachectic C26 and LM mice (n=5 LM, n=10–14 C26) (A) and cachectic KPC and PC mice (n=3–5) (B) fed KD or NF. (C-D) Plasma cholesterol levels in cachectic C26 and LM mice (n=5 LM, n=10–11 C26) (C), and in cachectic KPC and PC mice (n=5–8) (D) fed KD or NF. (E-G) Pregnenolone (n=16–22) ©, sodium (n=5 LM, n=10–11 C26) (F) and ACTH (n=6–10 LM, n=12–20 C26) (G) levels in plasma of cachectic C26 and LM mice on KD or NF. (H-I) Synacthen test in C26 and LM mice 4 days after diet change (n=4–5) (H), and in cachectic C26 and LM mice at endpoint (n=5–8) (I). One-way ANOVA with Tukey’s correction for post hoc testing was used in (A-G). Two-way ANOVA statistical tests with Tukey’s correction for post hoc comparisons were performed in (H-I). # p-value < 0.05 compared to time = 0.
Figure 4.
Figure 4.. NAC rescues adrenal function in vivo and LPPs suppress cortisol production in vitro.
(A) NADPH quantification in the adrenal glands of C26 and LM mice fed KD or NF, and C26 mice fed KD treated with NAC (n=5 LM, n=9–16 C26). (B-C) Corticosterone (n=5–14) (B) and pregnenolone (n=5–21) (C) levels in plasma of C26 and LM mice fed KD or NF, untreated or treated with NAC. (D-F) Viability of H295R cells treated with 4-HNE (D), 4-HI© or MDA (F) (n=3 independent experiments) relative to vehicle-treated control cells. (G-I) Cortisol levels upon exposure of H295R cells to 4-HNE (n=3–6) (G), 4-HHE (n=3–6) and MDA (n=6–15) (I). One-way ANOVA with Tukey’s correction for post hoc testing was used in (A-C, G-I).
Figure 5.
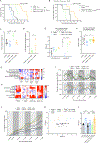
Figure 5.. Metabolic adaptation in the context of cachexia is impaired in KD-fed tumor-bearing mice.
(A) Plasma levels of GDF-15 in C26 and LM mice fed KD or NF (n=11–19). (B-C) mRNA levels of the E3 ligases Atrogin-1 (B) and MuRF1 (C) in the quadriceps of C26 and LM mice fed KD or NF (n=5 LM, n=12 C26). (D-E) Plasma creatinine levels in C26 and LM mice (n=5 LM, n=9–10 C26) (D), and KPC and PC mice (n=5–8) (E) fed either KD or NF. (F-G) GSEA analysis of downregulated (F) and upregulated (G) pathways in KD-fed C26 mice compared to those NF-fed (n=5). (H) Heatmap of metabolites in C26 mice fed KD or NF (n=5). (I-K) Quantification by UPLC-MS/MS of the main TCA cycle substrates: glycerol (I), glutamine (J), and arginine (K), in tumors of C26 mice fed KD or NF (n=6). One-way ANOVA with Tukey’s correction for post hoc testing was used in (A-E). Statistical analysis in (F-G) is described in Methods. Statistical differences in (I-K) were examined using an unpaired two-tailed Student’s t-test with Welch’s correction.
Figure 6.
Figure 6.. Dexamethasone treatment extends survival and improves metabolic adaptation of C26 mice fed KD.
(A-B) OS (A) and PFS (B) of C26 mice fed KD or NF, untreated or treated with Dexamethasone, and LM mice fed with either diet (n=7 LM, n=17–18 C26, n=7 C26 + Dex). (C) Tumor weight at endpoint in C26 mice fed KD or NF, untreated or treated with Dexamethasone (n=5–9). (D) Quantification of 4-HNE adducts in tumor lysates from C26 mice treated with Dex and fed KD or NF (n=5–7). (E) Quantification of fat tissue in C26 mice fed KD or NF, untreated or treated with Dexamethasone, 4 days after diet change and treatment start (n=3–10). (F) Plasma glucose levels in C26 mice fed KD or NF, untreated or treated with Dexamethasone, 2 days after diet change and treatment start (n=8–17). (G-H) Quantification by UPLC-MS/MS of metabolites involved in gluconeogenesis (G) and the TCA cycle (H) in livers of C26 mice on either KD or NF diets, untreated or treated with Dexamethasone (n=5). (I) RER during the last 4 days before endpoint in LM and C26 mice, untreated or treated with Dexamethasone, fed KD or NF (n=7). (J) Calorie intake during the last 4 days before endpoint in LM and C26 mice, untreated or treated with Dexamethasone, fed KD or NF (n=7). (K-L) Scattergraph (K) and group average (L) total energy expenditure (TEE) in LM and cachectic C26 fed KD or NF, untreated or treated with Dexamethasone (n=3–11) Overall survival (OS): time until mice reach >15% bodyweight loss. Progression-Free Survival (PFS): time until tumor size reaches > 2000 mm3. Kaplan–Meier curves in (A-B) were statistically analyzed by using the log-rank (Mantel–Cox) test. One-way ANOVA with Tukey’s correction for post hoc testing was used in (C, E, F). Unpaired two-tailed Student’s t-test was used in (D). Analysis in (G-H) is described in Methods. One-way ANCOVA was conducted to determine statistical significances in (K-L) on TEE controlling for weight.

Update of

Comment in

References

    1. Warburg O. (1925). The metabolism of carcinoma cells 1. J. Cancer Res. 9, 148–163. 10.1158/jcr.1925.148. - DOI
    1. von Haehling S, and Anker SD (2014). Prevalence, incidence and clinical impact of cachexia: facts and numbers—update 2014. J. Cachexia. Sarcopenia Muscle 5, 261–263. 10.1007/s13539-014-0164-8. - DOI - PMC - PubMed
    1. Farkas J, von Haehling S, Kalantar-Zadeh K, Morley JE, Anker SD, and Lainscak M. (2013). Cachexia as a major public health problem: Frequent, costly, and deadly. J. Cachexia. Sarcopenia Muscle 4, 173–178. 10.1007/s13539-013-0105-y. - DOI - PMC - PubMed
    1. Jansen N, and Walach H. (2016). The development of tumours under a ketogenic diet in association with the novel tumour marker TKTL1: A case series in general practice. Oncol. Lett. 11, 584–592. 10.3892/ol.2015.3923. - DOI - PMC - PubMed
    1. Otto C, Kaemmerer U, Illert B, Muehling B, Pfetzer N, Wittig R, Voelker HU, Thiede A, and Coy JF (2008). Growth of human gastric cancer cells in nude mice is delayed by a ketogenic diet supplemented with omega-3 fatty acids and medium-chain triglycerides. BMC Cancer 8, 1–12. 10.1186/1471-2407-8-122. - DOI - PMC - PubMed

Publication types