. 2023 Jul 10;33(13):2657-2667.e4.
doi: 10.1016/j.cub.2023.05.040. Epub 2023 Jun 12.

A mechanism for differential control of axonal and dendritic spiking underlying learning in a cerebellum-like circuit

Affiliations

A mechanism for differential control of axonal and dendritic spiking underlying learning in a cerebellum-like circuit

Salomon Z Muller et al. Curr Biol. .

Abstract

In addition to the action potentials used for axonal signaling, many neurons generate dendritic "spikes" associated with synaptic plasticity. However, in order to control both plasticity and signaling, synaptic inputs must be able to differentially modulate the firing of these two spike types. Here, we investigate this issue in the electrosensory lobe (ELL) of weakly electric mormyrid fish, where separate control over axonal and dendritic spikes is essential for the transmission of learned predictive signals from inhibitory interneurons to the output stage of the circuit. Through a combination of experimental and modeling studies, we uncover a novel mechanism by which sensory input selectively modulates the rate of dendritic spiking by adjusting the amplitude of backpropagating axonal action potentials. Interestingly, this mechanism does not require spatially segregated synaptic inputs or dendritic compartmentalization but relies instead on an electrotonically distant spike initiation site in the axon-a common biophysical feature of neurons.

Keywords: cerebellum; computational neuroscience; dendritic spikes; electric fish; neuroscience; synaptic plasticity; systems neuroscience.


Conflict of interest statement

Declaration of interests The authors declare no competing interests.

Figures

Figure 1.
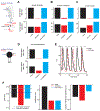
Figure 1.. Backpropagating narrow spikes evoke broad spikes.
(A) Schematic of negative image formation and transmission in the ELL. Electrosensory input containing both self-generated and external signals is relayed to the basilar dendrites of MG cells and output cells. For clarity, the schematic traces depict only the self-generated responses due to the fish’s EOD, and note that the negative image can only cancel the response to the predicted, self-generated, sensory input. The dashed and solid traces depict responses before and after negative image formation. Anti-Hebbian plasticity at granule cell synapses onto MG cells sculpts motor corollary discharge input into a negative image (blue trace) that cancels the effects of the EOD on broad spike firing (magenta trace). Negative images also simultaneously modulate the rate of narrow spike firing (blue trace) via previously unknown mechanisms that are elucidated here. The ELL also contains a second, parallel, sub-circuit (not shown), consisting of a second MG sub-class (termed BS+) and a second output cell sub-class (termed I-cells). This circuit is similar to the one depicted, but with the polarity of the sensory- and granule cell-evoked neural responses reversed. (B-C) Overlaid intracellular voltage traces from an example MG cell recorded in vivo (B) (also see Figure S1D), and the model cell (C). (D) Interval between peaks of narrow and broad spikes in recorded (n=17) and model MG cells. (E) Effect of eliminating narrow spikes on broad spike firing in the model. Narrow-spike F-I curve is also shown. (F) Left, neurolucida reconstruction of an MG cell used to build the multi-compartment model. Arrows indicate the sites of the membrane voltage recordings depicting the process of broad spike initiation (right). Open and filled arrows indicate somatically recorded narrow and broad spikes, respectively. Voltage trace from the axon is truncated for clarity (omitted portion shows that broad spikes trigger an additional axonal spike). (G) Left, membrane potential fluctuations in an MG cell recorded with no bias current (top) and with hyperpolarizing bias current to prevent narrow spiking (bottom). Red lines indicate the times of the fish’s electric organ discharge command. Right, peak depolarization amplitudes (relative to baseline) are substantially larger with narrow spikes intact (n=10 p< 0.001). (H) Left, example MG cell recording illustrating the relationship between broad spike probability and the peak of the narrow spike immediately preceding the broad spike. Additional examples are shown in Figure S1F–G. Right, same display for the model cell. (I) Narrow spike amplitude depends on the baseline membrane potential (i.e. the point from which the spike arises) but for any given baseline membrane potential, narrow spikes that precede broad spikes have, on average, a larger amplitude. Left panel shows one example MG cell (and see Figure S1H–K) and right panel shows results from the model cell. Each circle represents the average amplitude for the given baseline membrane potential. See also Video S1.
Figure 2.
Figure 2.. Biophysical model of negative image formation and transmission.
(A) Narrow and broad spike rates under three conditions used to simulate the formation and transmission of negative images in the model (see main text). To simplify model analysis, we use step-like changes in sensory and corollary discharge input rather than simulating the temporal response profiles observed in vivo (Figure S2). This is equivalent to plotting the peak of the responses schematized in Figure 1A. (B) Peak membrane potential of backpropagating narrow spikes for the input conditions shown in (A). Gray line indicates the broad spike threshold. The distance from the gray line to the dashed blue line is approximately one standard deviation from the mean value of the membrane potential at the peak of the narrow spike (this value is similar across conditions). This illustrates that the change in the peak of the narrow spike due to sensory inhibition drives the membrane potential far from threshold, explaining the large reduction in broad spike rate. (C) Backpropagating narrow spike amplitudes for the input conditions shown in (A). (D) Baseline membrane potentials for the input conditions shown in (A). (E) Example voltage traces from the model illustrating how membrane potential depolarization (cyan) allows narrow spikes to cross the threshold for evoking a broad spike (dashed line), despite the reduction in narrow spike amplitude due to inhibition (red). (F) Inhibition (red) reduces probability of evoking a broad spike (p), such that an increase in narrow spike rate is required to restore the broad spike rate to equilibrium (dashed line). This increase is proportional to the negative image. Equilibria for the two conditions are where the dashed and solid curves cross. See also Figure S3.
Figure 3.
Figure 3.. Negative image formation and transmission in vivo.
(A) Example BS− MG cell illustrating a decrease in the backpropagating narrow spike amplitude in a time window when broad spike firing is transiently decreased by an electrosensory stimulus (red) compared to a window in which the broad spike rate is not modulated (black). Inset here and in (B) identifies these analysis windows and shows the average broad spike response to the electrosensory stimulus (black triangle). (B) Example BS+ MG cell illustrating an increase in the backpropagating narrow spike amplitude in a time window when broad spike firing was transiently increased by an electrosensory stimulus (magenta). (C) Summary of the effects of sensory stimuli on narrow spike amplitude across MG cells (n = 15 decrease, n = 13 increase, p<0.001). Middle bar (control) shows results of analysis comparing amplitudes in two windows in which broad spike rates were not modulated (the two windows are separated by the gray dashed line in insets A-B). (D) Changes in membrane potential at the peak of the narrow spike (Δpeak), narrow spike amplitude (Δamplitude), and the baseline membrane potential preceding narrow spikes (Δbaseline MP) during pairing (~4 minutes) of an electrosensory stimulus with the electric organ discharge motor command (comd) to induce negative image formation and sensory cancellation in BS+ cells (n = 10). Inset right, traces from an example cell illustrating the initial sensory-evoked increase in broad spike firing (black, average of first 100 paired trials) along with the resulting change in the membrane potential (with spikes removed), which forms an approximate negative image of the effects of the paired sensory input on broad spike firing (magenta, average of final 100 minus first 100 paired trials). Inset left, illustration of the pairing paradigm. (E) Narrow spike rate versus membrane potential plotted for one example cell. Dashed line is the linear fit. Inset, trial-averaged membrane potential (with spike removed) and corresponding narrow spike rate for the same cell. (F) Average slope of narrow spikes to membrane potential changes across MG cells (n=17) calculated based on the range of the curves shown in E. The red dot corresponds to the example cell in E. See also Figure S4.
Figure 4.
Figure 4.. Negative image formation and transmission does not require dendritic compartmentalization.
Left, schematic indicates locations of corollary discharge (blue) and sensory (red) inputs used in the different simulation conditions (A-C). Black arrow (initial) indicates location of inputs used to establish in vivo-like baseline rates of narrow and broad spike firing. (A-B) Inhibition onto proximal apical dendrites (A) or soma (B) results in the formation and transmission of negative images in the multi-compartment model. (C) A mixture of excitatory and inhibitory inputs decreases the rate of broad spikes while increasing narrow spike firing. Cancellation of broad spike inhibition results in a further increase of narrow spike firing. (D) Formation and transmission of negative images can also be achieved in a simplified two-compartment model, in which all the inputs are at the soma (left diagram). (E) Trace from the two-compartment model showing the reduction of backpropagating narrow spike amplitude by inhibitory input. Dashed line is the broad spike threshold. (F) Mechanism of negative image formation and transmission in the two-compartment model is the same as in the realistic model (cf. Figure 2B–D).

Comment in

Similar articles

Cited by

References

    1. Spruston N, Schiller Y, Stuart G, and Sakmann B (1995). Activity-dependent action potential invasion and calcium infulux into hippocampal CA1 dendrites. Science 268, 297–300. - PubMed
    1. Stuart GJ, and Sakmann B (1994). Active propagation of somatic action potentials into neocortical pyramidal cell dendrites. Nature 367, 69–72. - PubMed
    1. Grace AA, and Bunney BS (1983). Intracellular and Extracellular Electrophysiology of Nigral Dopaminergic-Neurons .2. Action-Potential Generating Mechanisms and Morphological Correlates. Neuroscience 10, 317-+. Doi 10.1016/0306-4522(83)90136-7. - DOI - PubMed
    1. Hausser M, Stuart G, Racca C, and Sakmann B (1995). Axonal inhibtion and active dendritic propagation of action potentals in susbstantia nigra neurons. Neuron 15, 637–647. - PubMed
    1. Llinas R, Nicholson C, Freeman JA, and Hillman DE (1968). Dendritic spikes and their inhibition in alligator Purkinje cells. Science 160, 1132–1135. 10.1126/science.160.3832.1132. - DOI - PubMed

Publication types

LinkOut - more resources