. 2023 Jun 13;14(1):3398.
doi: 10.1038/s41467-023-39058-4.

Parieto-occipital ERP indicators of gut mechanosensation in humans

Affiliations

Parieto-occipital ERP indicators of gut mechanosensation in humans

Ahmad Mayeli et al. Nat Commun. .

Abstract

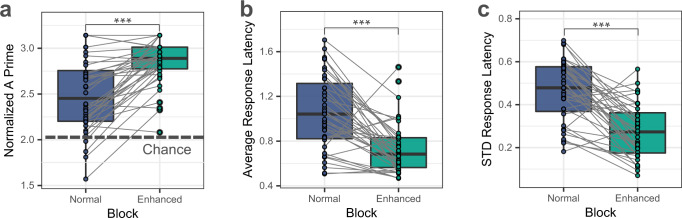
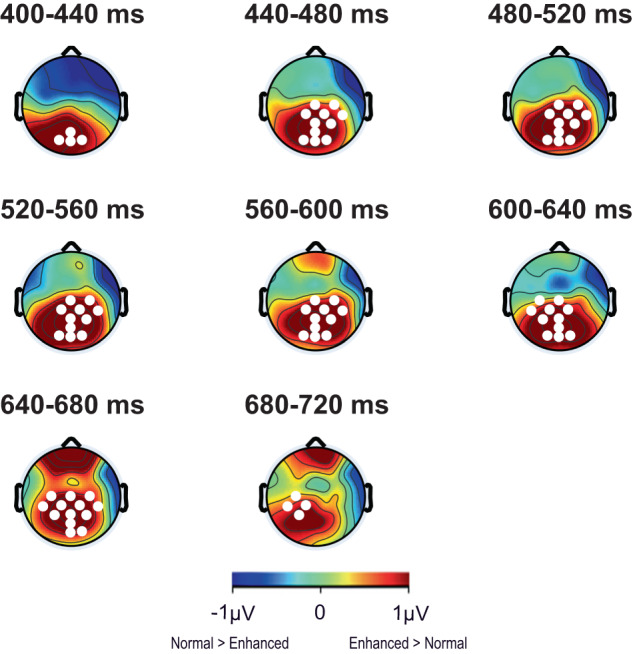
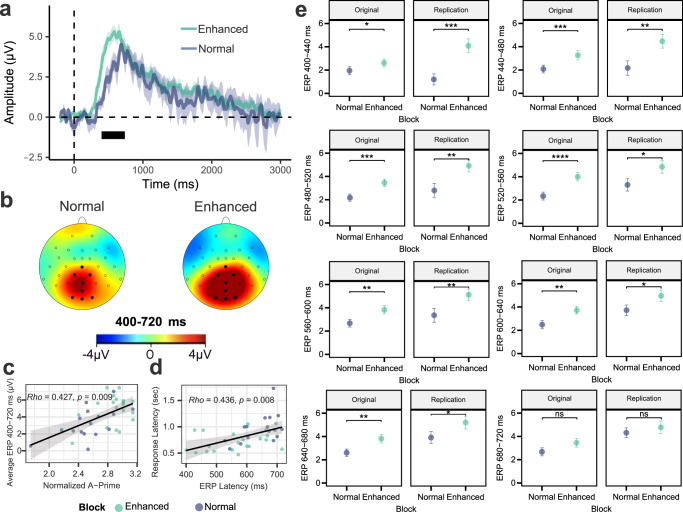
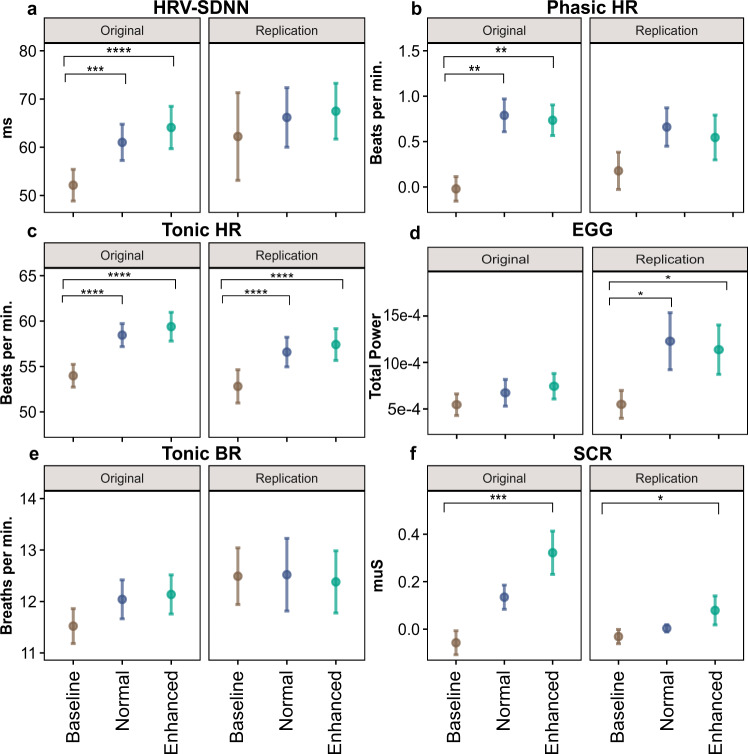
Understanding the neural processes governing the human gut-brain connection has been challenging due to the inaccessibility of the body's interior. Here, we investigated neural responses to gastrointestinal sensation using a minimally invasive mechanosensory probe by quantifying brain, stomach, and perceptual responses following the ingestion of a vibrating capsule. Participants successfully perceived capsule stimulation under two vibration conditions (normal and enhanced), as evidenced by above chance accuracy scores. Perceptual accuracy improved significantly during the enhanced relative to normal stimulation, which was associated with faster stimulation detection and reduced reaction time variability. Capsule stimulation induced late neural responses in parieto-occipital electrodes near the midline. Moreover, these 'gastric evoked potentials' showed intensity-dependent increases in amplitude and were significantly correlated with perceptual accuracy. Our results replicated in a separate experiment, and abdominal X-ray imaging localized most capsule stimulations to the gastroduodenal segments. Combined with our prior observation that a Bayesian model is capable of estimating computational parameters of gut-brain mechanosensation, these findings highlight a unique form of enterically-focused sensory monitoring within the human brain, with implications for understanding gut feelings and gut-brain interactions in healthy and clinical populations.


Conflict of interest statement

All authors declare no competing interests.

Figures

Fig. 1
Fig. 1. Perceptual indicators of gut sensation during vibratory gut stimulation in n = 40 biologically independent samples.
Perceptual measures during the normal and enhanced stimulation blocks were derived based on button-presses signifying perceived sensations. Gray lines present changes in individual performance from the normal to the enhanced block. a Normalized A prime indicator of perceptual accuracy (dashed line shows chance performance based on binomial expansion); b Average response latency (in seconds); and c Standard deviation (STD) of the response latency (in seconds). The participants’ performance improved significantly with enhanced stimulation across all three measures, indicating the paradigm effectively induced changes in gut sensation. All paired t-tests (two-tailed) for perceptual accuracy measures were corrected for multiple comparisons using Bonferroni correction. ***p < 0.001. Source data are provided as a Source Data file.
Fig. 2
Fig. 2. Parieto-occipital event-related potential (ERP) indicators of gut sensation during vibratory gut stimulation and their association with perceptual accuracy measures during normal and enhanced stimulation in n = 40 biologically independent samples.
a The average ERP waveforms during the normal (blue) and enhanced (green) blocks for channels (Cz, CP1, CP2, Pz, POz, O1, Oz, and O2) showing the most consistent responses in the cluster-based permutation analysis. Intensity-dependent differences were identified during a late (i.e., 400–720 ms) window (marked with a horizontal black bar). Shaded areas represent the standard error of the mean for the ERP signal at each time point. Time-zero represents the earliest onset of vibratory stimulation corresponding to correctly detected vibrations, as indicated by participant button presses. The presented waveforms were calculated from the average mastoid-referenced EEG. b Scalp topography during the late window after the vibration onset relative to the pre-stimulus baseline for the normal and enhanced conditions. c The positive association between the late ERP signal strength (averaged signal among Cz, CP1, CP2, Pz, POz, O1, Oz, and O2 channels) and perceptual accuracy (normalized A prime) was significant after controlling for the condition (Spearman correlation: ρ = 0.354, p < 0.001). Average ERP amplitude data from one participant was excluded for being detected as an outlier for the enhanced condition. d The positive association between late ERP latency (averaged signal among Cz, CP1, CP2, Pz, POz, O1, Oz, and O2 channels) and response latency was significant after controlling for the condition (Spearman correlation: ρ = 0.341, p = 0.002). The regression lines indicate linear fits, and shaded areas correspond to the 95% confidence interval for the regressions. Source data are provided as a Source Data file.
Fig. 3
Fig. 3. Scalp topographies for cluster-based permutation analysis on the main effect of block (normal vs. enhanced) illustrating a distribution in the late positive potential (LPP) time range of 400–720 ms.
The scalp topographies for the full 3000 ms simulation period are presented in Supplementary Fig. S2. The red color bar represents higher potentials during the enhanced condition vs. normal condition, and the blue color bar represents lower potentials during the enhanced condition vs. normal condition. Electrodes that are part of clusters with p-values < 0.05 are depicted by white circles in the corresponding time windows. Source data are provided as a Source Data file.
Fig. 4
Fig. 4. Influence of vibratory gut stimulation on peripheral physiological measures during phasic (rapid – event-related) and tonic (slow – entire block) periods.
Shaded quadrants indicate signals with significant stimulation-associated changes from baseline, with brackets denoting post-hoc comparisons after Bonferroni-correction. Sample size for each block is n = 40 biologically independent samples unless otherwise mentioned. Top-right: phasic skin conductance response (SCR) amplitudes differed from baseline during the enhanced stimulation condition only [normal block n = 39]. Top-left: phasic heart rate (HR) responses differed from baseline during both the normal and enhanced stimulation conditions [enhanced block n = 39]. Bottom-left: tonic HR differed from baseline during both the normal and enhanced stimulation conditions. Top: tonic heart rate variability (HRV) differed from baseline during both the normal and enhanced stimulation conditions. Bottom: Total electrogastrogram (EGG) power across all physiologically relevant spectrums did not differ for each stimulation condition [enhanced block n = 39]. Bottom-right: estimated breathing rate (BR) responses did not differ for each stimulation condition [baseline block n = 39]. Linear mixed effects models were used in all comparisons. All post-hoc p-values were corrected for multiple comparisons using Bonferroni correction. **p < 0.01, ****p < 0.0001. Source data are provided as a Source Data file.
Fig. 5
Fig. 5. Self-reported intensity ratings of different interoceptive sensations experienced before (Pre) and during stimulation (Post) in n = 40 biologically independent samples.
These ratings were provided retrospectively, and encompassed sensations experienced during both blocks. a Stomach/Digestive, b Breath, c Heartbeat, and d Muscle tension ratings. Stimulation-induced intensity ratings increased for stomach, breath, and heartbeat sensations. Gray lines show the change in ratings for each individual. All paired t-tests (two-tailed) were corrected for multiple comparisons using Bonferroni correction. *p < 0.05, **p < 0.01, ***p < 0.001; ns, not significant. Source data are provided as a Source Data file.
Fig. 6
Fig. 6. Localization of capsule stimulation to the gastroduodenal segment of the gut in n = 10 biologically independent samples.
a Schematic illustration of anatomical segments of the stomach and small intestine. Intestinal contents typically transit through the stomach (fundus→body→antrum) then through the small intestine (duodenum→jejunum→ileum) before arriving in the colon (not labeled). b Capsule location in the stomach and small intestine as a function of time in 10 healthy individuals (5 male, 5 female) as verified by serial abdominal X-ray imaging. The capsule remained in the stomach for 60% of the participants at 30 min post ingestion. c Detailed illustration of capsule location in individual segments of the stomach and small intestine. The capsule remained in the stomach or duodenum for 80% of participants at 30 min post ingestion. d Abdominal X-rays illustrating capsule location in three participants over the course of 60 min. Each participant received 10 abdominal X-rays while lying supine. Top row: the capsule was in the stomach fundus immediately after ingestion, where it remained until 45 min. It had exited the stomach and was in the duodenum at 60 min. Middle row: the capsule was in the stomach antrum immediately after ingestion, where it remained at 30 min. It had exited the stomach and was in the jejunum at 45 min, where it remained at 60 min. Bottom row: the capsule was in the stomach antrum immediately after ingestion. At 5 min, it moved to the duodenum where it remained at 25 min. It was in the jejunum at 30 min and was in the ileum at 60 min. Source data are provided as a Source Data file.
Fig. 7
Fig. 7. Comparisons among the original sample (n = 40 males and females) and replication sample (n = 21 females) for the capsule perceptual accuracy measures and self-reported intensity ratings.
a Normalized A prime, b Average response latency, c Standard deviation (STD) of response latency, d Stomach/digestive sensation intensity, e Breath sensation intensity, f Heartbeat sensation intensity, and g Muscle tension sensation intensity. All paired t-tests (two-tailed) for perceptual accuracy measures and intensity ratings were corrected for multiple comparisons using Bonferroni correction. *p < 0.05, **p < 0.01, ***p < 0.001; ns, not significant. Dots represent the mean, and error bars represent the standard error around the mean. Source data are provided as a Source Data file.
Fig. 8
Fig. 8. Replication of parieto-occipital event-related potential (ERP) indicators of gut sensation and their association with perceptual accuracy measures during normal and enhanced stimulation (n = 21 biologically independent samples).
a The average ERP waveforms during the normal (blue) and enhanced (green) blocks for channels Cz, CP1, CP2, Pz, POz, O1, Oz, and O2. Intensity-dependent differences were examined during late (i.e., 400 to 720 ms) windows (marked with a horizontal bar). Shaded areas represent the standard error of the mean for the ERP signal at each time point. Time-zero represents the earliest onset of vibratory stimulation. The presented waveforms were calculated from the average mastoid-referenced EEG. b Scalp topography during the early window after the vibration onset relative to the pre-stimulus baseline for the normal and enhanced conditions. c The positive association between the late ERP signal strength (averaged signal among Cz, CP1, CP2, Pz, POz, O1, Oz, and O2 channels) and perceptual accuracy (normalized A prime) was significant after controlling for the condition, ρ = 0.441, p = 0.008. d An overall positive association between late ERP Latency (averaged signal among Cz, CP1, CP2, Pz, POz, O1, Oz, and O2 channels) and response latency was seen after controlling for the condition (ρ = 0.436, p = 0.008). e Comparisons among the original sample (n = 39; 1 participant did not detect any normal vibrations) and female replication sample (n = 17; 4 participant did not detect any normal vibrations) for different ERP intervals for the channels detected using the permutation approach (please refer to Fig. 4). Source data are provided as a Source Data file.
Fig. 9
Fig. 9. Replication of vibratory gut stimulation influence on several peripheral physiological measures (n = 21 biologically independent samples).
Comparisons among the original sample (n = 40 males and females) and replication sample (n = 21 females) are shown for peripheral physiological measures during phasic (rapid – event-related) and tonic (slow – entire block) periods. a Heart rate variability (HRV) differed from baseline during both the normal and enhanced stimulation conditions [replication sample, enhanced block n = 20 and normal block n = 20]. b Phasic heart rate (HR) responses differed from baseline during both the enhanced stimulation conditions [original sample, enhanced block n = 39]. c Tonic HR differed from baseline during both the normal and enhanced stimulation conditions [replication sample, enhanced block n = 20 and normal block n = 20]. d Total electrograstrogram (EGG) power across all physiologically relevant spectrums did not differ for each stimulation condition [original sample, enhanced block n = 39; replication sample, enhanced block n = 20]. e Estimated breathing rate (BR) responses did not change across blocks [original sample, baseline block n = 39. f Phasic skin conductance response (SCR) amplitudes differed from baseline during the enhanced stimulation condition only [original sample, normal block n = 39; replication sample, enhanced block n = 20 and normal block n = 20]. **p < 0.01, ****p < 0.0001. Dots represent the mean, and error bars represent the standard error of the mean. Linear mixed effects models were used in all comparisons. All post-hoc p-values were corrected for multiple comparisons using Bonferroni correction. Source data are provided as a Source Data file.

References

    1. Berntson GG, Khalsa SS. Neural circuits of interoception. Trends Neurosci. 2021;44:17–28. doi: 10.1016/j.tins.2020.09.011. - DOI - PMC - PubMed
    1. Chen WG, et al. The emerging science of interoception: sensing, integrating, interpreting, and regulating signals within the self. Trends Neurosci. 2021;44:3–16. doi: 10.1016/j.tins.2020.10.007. - DOI - PMC - PubMed
    1. Quigley KS, Kanoski S, Grill WM, Barrett LF, Tsakiris M. Functions of interoception: from energy regulation to experience of the self. Trends Neurosci. 2021;44:29–38. doi: 10.1016/j.tins.2020.09.008. - DOI - PMC - PubMed
    1. Weng HY, et al. Interventions and manipulations of interoception. Trends Neurosci. 2021;44:52–62. doi: 10.1016/j.tins.2020.09.010. - DOI - PMC - PubMed
    1. Petzschner FH, Garfinkel SN, Paulus MP, Koch C, Khalsa SS. Computational models of interoception and body regulation. Trends Neurosci. 2021;44:63–76. doi: 10.1016/j.tins.2020.09.012. - DOI - PMC - PubMed

Publication types