. 2023 Jun 13;14(1):3278.
doi: 10.1038/s41467-023-38849-z.

Embryonic vitamin D deficiency programs hematopoietic stem cells to induce type 2 diabetes

Affiliations

Embryonic vitamin D deficiency programs hematopoietic stem cells to induce type 2 diabetes

Jisu Oh et al. Nat Commun. .

Abstract

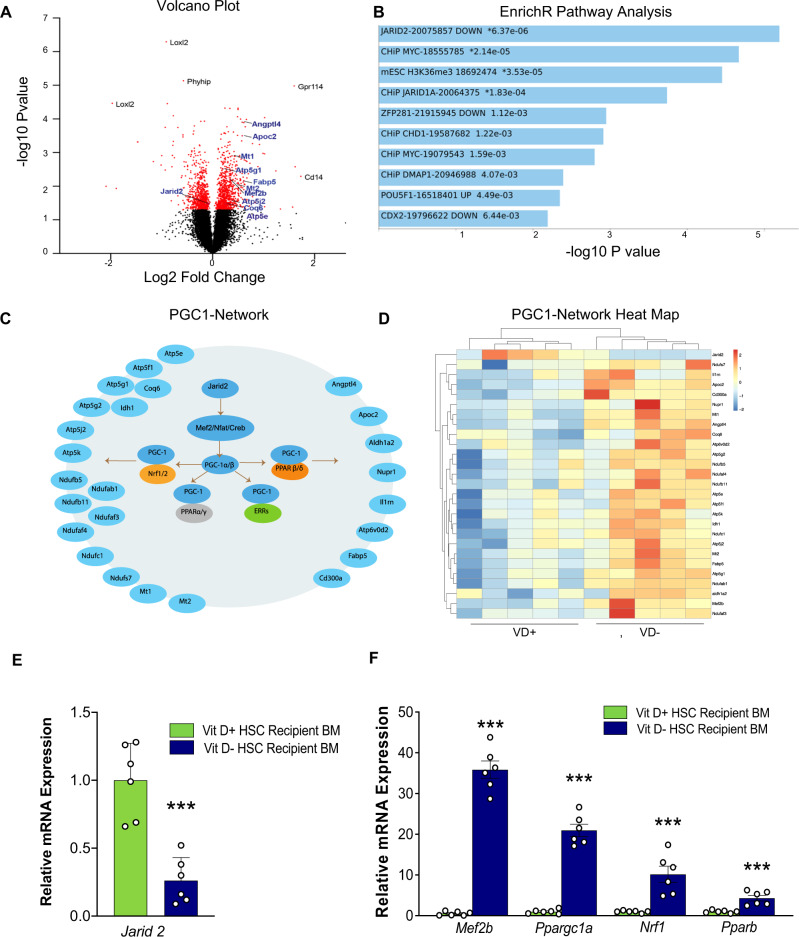
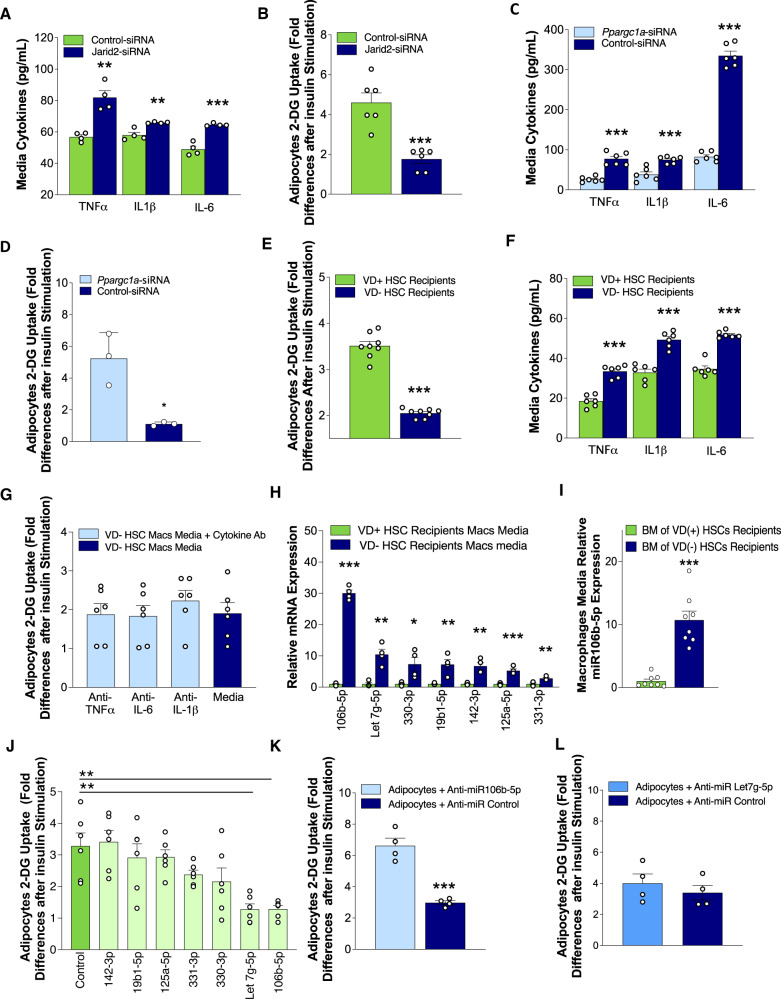
Environmental factors may alter the fetal genome to cause metabolic diseases. It is unknown whether embryonic immune cell programming impacts the risk of type 2 diabetes in later life. We demonstrate that transplantation of fetal hematopoietic stem cells (HSCs) made vitamin D deficient in utero induce diabetes in vitamin D-sufficient mice. Vitamin D deficiency epigenetically suppresses Jarid2 expression and activates the Mef2/PGC1a pathway in HSCs, which persists in recipient bone marrow, resulting in adipose macrophage infiltration. These macrophages secrete miR106-5p, which promotes adipose insulin resistance by repressing PIK3 catalytic and regulatory subunits and down-regulating AKT signaling. Vitamin D-deficient monocytes from human cord blood have comparable Jarid2/Mef2/PGC1a expression changes and secrete miR-106b-5p, causing adipocyte insulin resistance. These findings suggest that vitamin D deficiency during development has epigenetic consequences impacting the systemic metabolic milieu.


Conflict of interest statement

The authors declare no competing interests.

Figures

Fig. 1
Fig. 1. In utero VD deficiency reprograms HSCs to transfer IR.
AJ Vitamin D-sufficient CD45.1+ C57BL6 mice were transplanted with VD(−) or VD( + ) FL-HSCs from CD45.2+ C57BL6 mice (primary; n = 20/group), then these primary recipients were used as BM transplant donors for vitamin D-sufficient mice (secondary; 20 transplanted mice/group). Glucose and insulin tolerance tests were performed at (A, B) 8 weeks VD(−)(n = 18, VD( + ) = 20 mice/group from two independent experiments) and C, D 6 months post-primary-transplant (VD(−) n = 15, VD(+) n = 16 mice) and E, F 8 weeks post-secondary-transplant (n = 12/group). The area under the curve is included on the glucose tolerance test insets. Hyperglycemic-euglycemic clamps were conducted in primary transplant recipients after 8 weeks (n = 4/group). Data are reported as G glucose infusion rate, H insulin-stimulated glucose disposal rate (Rd), I change in hepatic glucose production, and J insulin-stimulated 2-DG uptake in adipose tissue. KM Primary eWAT was isolated from VD(−) or VD( + ) FL-HSC recipients. K Ex vivo insulin-stimulated 2-DG uptake (n = 4/group). L Western blot analysis of phospho- and total AKT levels following insulin stimulation. M Percentage of F4/80-positive cells by manually counting 15 light microscopy fields under ×20 objective per mouse (n = 3/group). Data presented as mean ± SEM. *P < 0.05; **P < 0.01; ***P < 0.001 vs. VD( + ) FL-HSCs recipients by two-tailed unpaired t test. Actual P values are shown in the source data file.
Fig. 2
Fig. 2. Top genes, networks, and pathways identified in transcriptome analysis of bone marrow from recipient mice transplanted with HSCs isolated from embryos from VD-sufficient and -deficient dams.
VD(−) vs. VD( + ) FL-HSCs were transplanted into VD(+) mice, and global mRNA expression was evaluated by microarray in recipient BM cells at 16 weeks post-transplant. A Volcano plot showing top differentially expressed genes. Red dots indicate those array probes with P < 0.05. Black represents the non-significant probes. Genes of the Jarid2-PGC1-MEF2 pathway are highlighted in blue. P values for each probe were calculated using a two-tailed t test between five replicates in each condition. B Genes with significant changes were used for manual and automated pathway analysis. The figure shows EnrichR (PMID 23586463; 27141961; 33780170) top pathway hits from the ESCAPE database. Asterisks indicate those pathways that pass multiple testing corrections. EnrichR used Fisher’s exact test for P value calculation and Benjamini–Hochberg test for multiple testing corrections (C) Illustration of the Jarid2-MEF2-PGC1 network and the target genes that are differentially expressed in the array data. D Heatmap table showing normalized gene expression for Jarid2, MEF2-PGC1 target genes. Red indicates upregulation, and blue indicates downregulation. E, F Quantitative RT-PCR in FL-HSC transplant recipient BM to confirm expression changes in Jarid2 and PGC1α network-related genes (n = 6/group). Data presented as mean ± SEM. ***P < 0.001 vs. VD( + ) FL-HSCs recipients by two-tailed unpaired t test. Actual P values are shown in the source data file.
Fig. 3
Fig. 3. In utero VD deficiency epigenetically suppresses Jarid2 expression in macrophages, resulting in persistent PGC1α network upregulation.
A, B Quantitative RT-PCR in donor FL-HSCs and SVF macrophages from FL-HSC transplant recipients (n = 6/group). C Quantitative RT-PCR in HSCs from mice with deletion of Jarid2 in HSC vs. controls (n = 12/group). D, E Glucose and insulin tolerance tests were performed at 8 weeks post-primary-transplant of HSC with deletion of Jarid2 or controls (n = 14/group) F Quantitative RT-PCR in macrophages to analyze the expression of Jarid2 and PGC1α network-related genes in mice born VD(−) or VD(+) then fed VD(−) or VD(+) diet postnatally (n = 6/group). G Targeted next-generation sequencing methylation assays were performed to interrogate the 69 CpG sites in the 5’ Upstream through 3’ UTR regions of the mouse Jarid2 gene, including two promoter regions and several enhancers, in BM and SVF macrophages isolated from VD(−) and VD( + ) FL-HSCs recipients at 24 weeks (n = 4/group). The gene structure of mouse Jarid2 and the regions throughout the gene where the CpG methylation was interrogated are shown. The methylation assays highlighted in red demonstrate a significant difference (P < 0.05) between the two cohorts. The CpGs in these regions are shown in orange boxes. The % methylation increase and P values are reported. The gray boxes are those CpGs that have suggestive changes. Data presented as mean ± SEM. **P < 0.01; ***P < 0.001 by two-tailed unpaired t test except in (D) where *P < 0.05; **P < 0.01; ***P< 0.001 by one-way ANOVA followed by Tukey’s multiple comparison test. Actual P values are shown in the source data file.
Fig. 4
Fig. 4. Activation of the Jarid2/Mef2/PGC1α immune cell program by in utero VD deficiency promotes pro-inflammatory cytokine and miRNA release.
A Secreted cytokine levels in media (n = 4/group) in Jarid2-siRNA vs. control-siRNA-transfected peritoneal macrophages from VD( + ) FL-HSCs recipients. B Insulin-stimulated 2-DG uptake in 3T3-L1 adipocytes co-cultured with peritoneal macrophages from VD( + ) FL-HSCs recipients transfected with Jarid2-siRNA vs. control-siRNA (n = 6/group). C Secreted cytokine levels in media (n = 6/group) from Ppargc1a-siRNA vs. control-siRNA-transfected peritoneal macrophages from VD(−) FL-HSCs recipients. D Insulin-stimulated 2-DG uptake in 3T3-L1 adipocytes co-cultured with peritoneal macrophages from VD(−) FL-HSCs recipients transfected with Ppargc1a-siRNA vs. control-siRNA (n = 3/group). E Insulin-stimulated 2-DG uptake in 3T3-L1 adipocytes co-cultured with eWAT SVF macrophages from VD(−) or VD( + ) HSC recipients (n = 8/group). F Secreted cytokine levels in media (n = 6/group) from SVF macrophages from VD(−) or VD( + ) HSC recipients. G Insulin-stimulated 2-DG uptake in 3T3-L1 adipocytes co-cultured with SVF macrophages from VD(-) HSC recipients treated with or without cytokine-neutralizing antibodies (n = 6/group). H Relative miRNA content in exosomes secreted by peritoneal macrophages from VD(−) vs. VD( + ) FL-HSCs recipients (n = 8/group). I Relative miRNA content in exosomes secreted by peritoneal macrophages isolated from secondary recipients from the bone marrow of VD(+) primary recipients transplanted with VD(−) HSCs (n = 8/group). J Insulin-stimulated 2-DG uptake in 3T3-L1 adipocytes after transfection with miR mimics (n = 6/group). K, L Insulin-stimulated 2-DG uptake in 3T3-L1 adipocytes transfected with K miR-106b or L let7g-5p antagomir or control and cultured in conditioned macrophage media from VD(−) HSC recipients (n = 4/group). Data presented as mean ± SEM. *P < 0.05; **P < 0.01; ***P < 0.001 by two-tailed unpaired t test except in (G) and (I) where *P < 0.05; **P < 0.01; ***P < 0.001 by one-way ANOVA followed by Tukey’s multiple comparison test. Actual P values are shown in the source data file.
Fig. 5
Fig. 5. Macrophage miR-106b-5p mediates in utero VD deficiency-induced adipocyte IR.
AC Quantitative RT-PCR, Western blot analysis, and densitometry (normalized to β-actin protein levels) of the insulin signaling pathway in 3T3-L1 cells after transfection with miR-106b-5p mimic vs. control mimic (n = 4/group). DF Quantitative RT-PCR, western blot analysis, and densitometry (normalized to β-actin protein levels) of the insulin signaling pathway in 3T3-L1 cells cultured in conditioned media from VD(−) HSC-recipient macrophages after transfection with anti-miR-106b or control (n = 4/group) from two independent experiments. G miR-106b-5p expression in adipocytes cultured in conditioned media from macrophages isolated from VD(−) or VD( + ) HSC recipients (n = 4/group). H Pre- and mature miR-106b-5p abundance in 3T3-L1 adipocytes transfected with pre-miR-106b siRNA vs. control-siRNA then cultured in conditioned media from macrophages isolated from VD(−) or VD( + ) HSC recipients (n = 4/group). Peritoneal macrophage media miR-106b-5p expression from I VD(−) HSC-recipient macrophages with or without Ppargc1a-siRNA, and J VD( + ) HSC-recipient macrophages with or without Jarid2-siRNA (n = 6/group). KM Fetal HSCs from WT or miR-106b−/− animals under VD(−) or VD(+) conditions were transplanted into VD( + ) WT recipients. K Glucose tolerance tests and L insulin tolerance tests (n = 8/group). M Insulin-stimulated 2-DG uptake in 3T3-L1 adipocytes co-cultured with peritoneal macrophages from WT or miR-106b−/− animals transplanted with VD(−) or VD(+) HSCs (n = 6/group). Data presented as mean ± SEM. A, C, D, F, H, I, J *P < 0.05; ***P < 0.001 by two-tailed unpaired t test. G, M *P < 0.05; **P < 0.01; ***P < 0.001 by one-way ANOVA followed by Tukey’s multiple comparison test. K, L *P < 0.05; **P < 0.01; ***P < 0.001 VD(−) WT vs. all and P < 0.05; †††P < 0.001 for VD( + ) WT vs. VD(−) miR-106b−/−. Actual P values shown in source data file.
Fig. 6
Fig. 6. VD-deficient cord blood monocytes induce adipocyte IR.
A Cord blood serum 25(OH)D levels from 30 healthy pregnant women at delivery. Mean and 95% confidence interval. B Correlation between cord blood serum 25(OH)D levels and birth weight using Spearman’s correlation coefficient. C Correlation between cord blood serum 25(OH)D levels and change in insulin-stimulated 2-DG uptake in 3T3-L1 adipocytes cultured in conditioned media of cord blood monocytes using Spearman’s correlation coefficient. Western blot analysis of insulin signaling pathway from 3T3-L1 adipocytes exposed to cord blood monocytes (D) and from Jarid2/Mef2/PGC1α network-related proteins of cord blood monocytes (E) (n = 4/group from two independent experiments). F Quantitative RT-PCR of mRNA expression of Jarid2/Mef2/PGC1α network-related genes from cord blood monocytes stratified by 25(OH)D level (25(OH)D < 20 ng/mL and ≥20 ng/mL) (n = 4/group). G Correlation between cord blood serum 25(OH)D level and serum miR-106b-5p expression (n = 30) using Spearman’s correlation coefficient. H Insulin-stimulated 2-DG uptake in 3T3-L1 adipocytes transfected with miR-106b-5p antagomir and cultured in conditioned media from blood monocytes with 25(OH)D < 20 ng/mL or ≥20 ng/mL (n = 6/group). I Mechanistic schematic diagram Created with BioRender.com. Data presented as mean ± SEM. F *P < 0.05; **P < 0.01; ***P < 0.001 by two-tailed unpaired t test. H **P < 0.01; ***P < 0.001 by one-way ANOVA followed by Tukey’s multiple comparison test. Actual P values are shown in the source data file.

Similar articles

Cited by

References

    1. Centers for Disease Control and Prevention. National Diabetes Statistics Report: Estimates of Diabetes and ItsBurden in the United States, 2014. (Department of Health and Human Services, Atlanta, GA, 2014).
    1. Olshansky SJ, et al. A potential decline in life expectancy in the United States in the 21st century. N. Engl. J. Med. 2005;352:1138–1145. doi: 10.1056/NEJMsr043743. - DOI - PubMed
    1. Barker DJ, Eriksson JG, Forsen T, Osmond C. Fetal origins of adult disease: strength of effects and biological basis. Int. J. Epidemiol. 2002;31:1235–1239. doi: 10.1093/ije/31.6.1235. - DOI - PubMed
    1. Barker DJ, et al. Type 2 (non-insulin-dependent) diabetes mellitus, hypertension and hyperlipidaemia (syndrome X): relation to reduced fetal growth. Diabetologia. 1993;36:62–67. doi: 10.1007/BF00399095. - DOI - PubMed
    1. Newsome CA, et al. Is birth weight related to later glucose and insulin metabolism?—a systematic review. Diabet. Med. 2003;20:339–348. doi: 10.1046/j.1464-5491.2003.00871.x. - DOI - PubMed

Publication types