. 2023 Jun 13;14(1):3194.
doi: 10.1038/s41467-023-38523-4.

Hydrogen and dark oxygen drive microbial productivity in diverse groundwater ecosystems

Affiliations

Hydrogen and dark oxygen drive microbial productivity in diverse groundwater ecosystems

S Emil Ruff et al. Nat Commun. .

Abstract

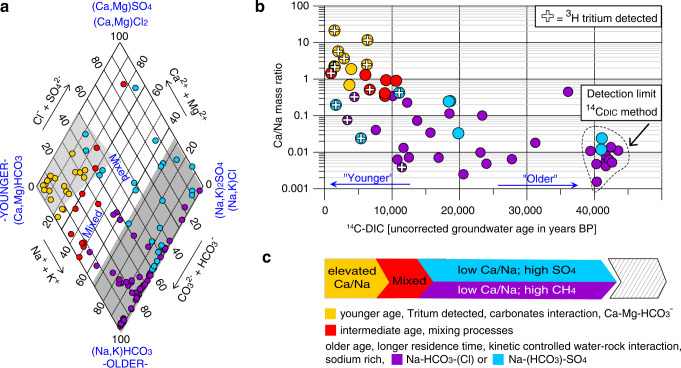
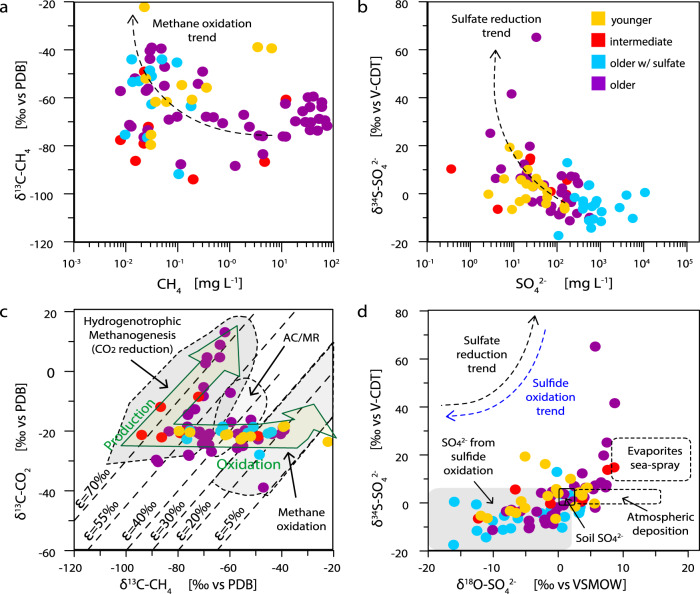
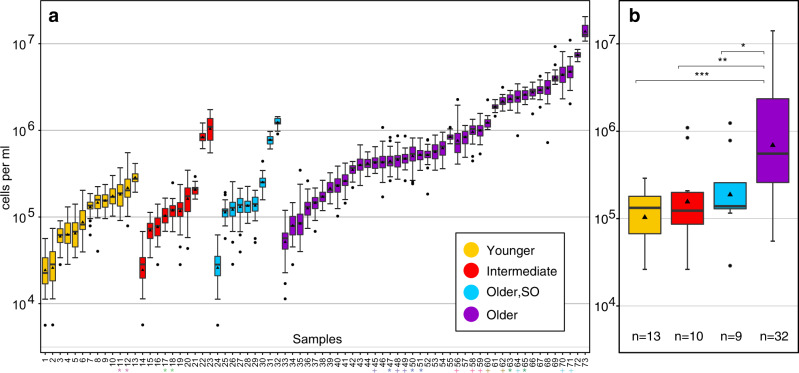
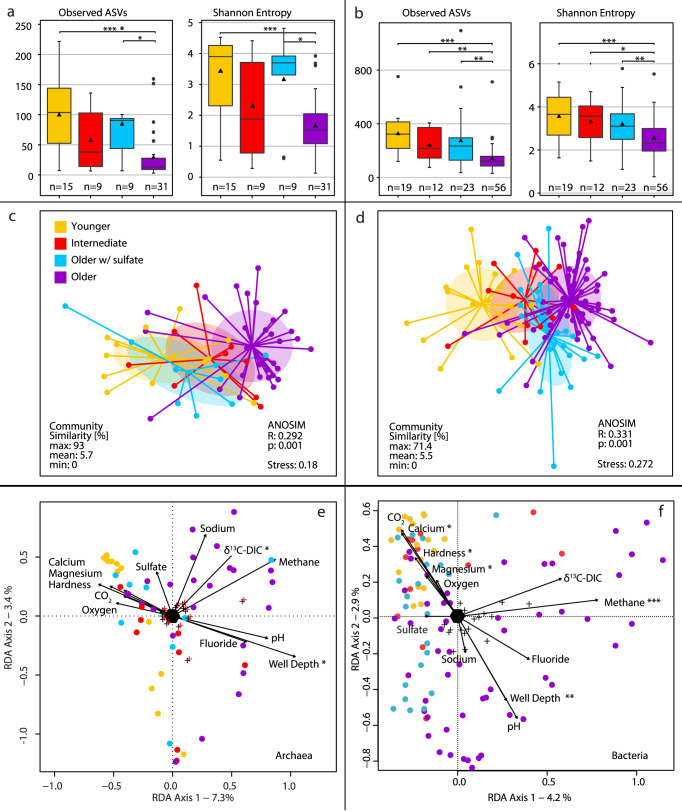
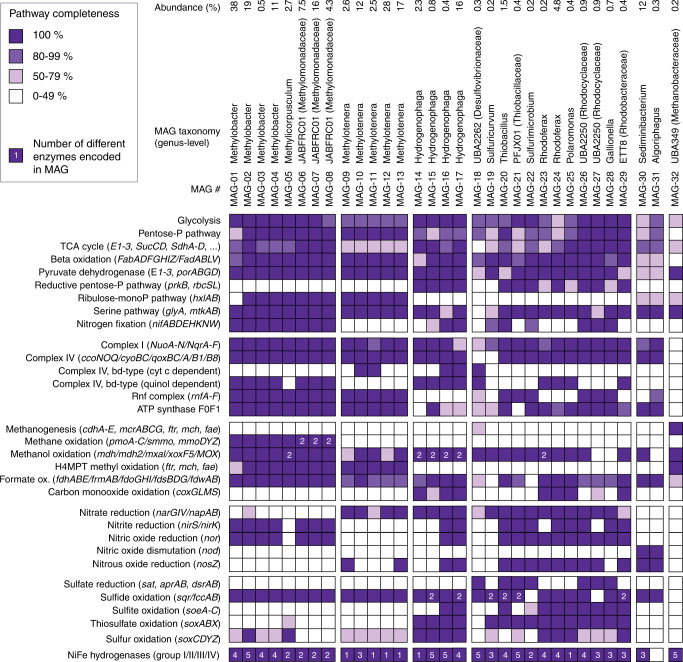
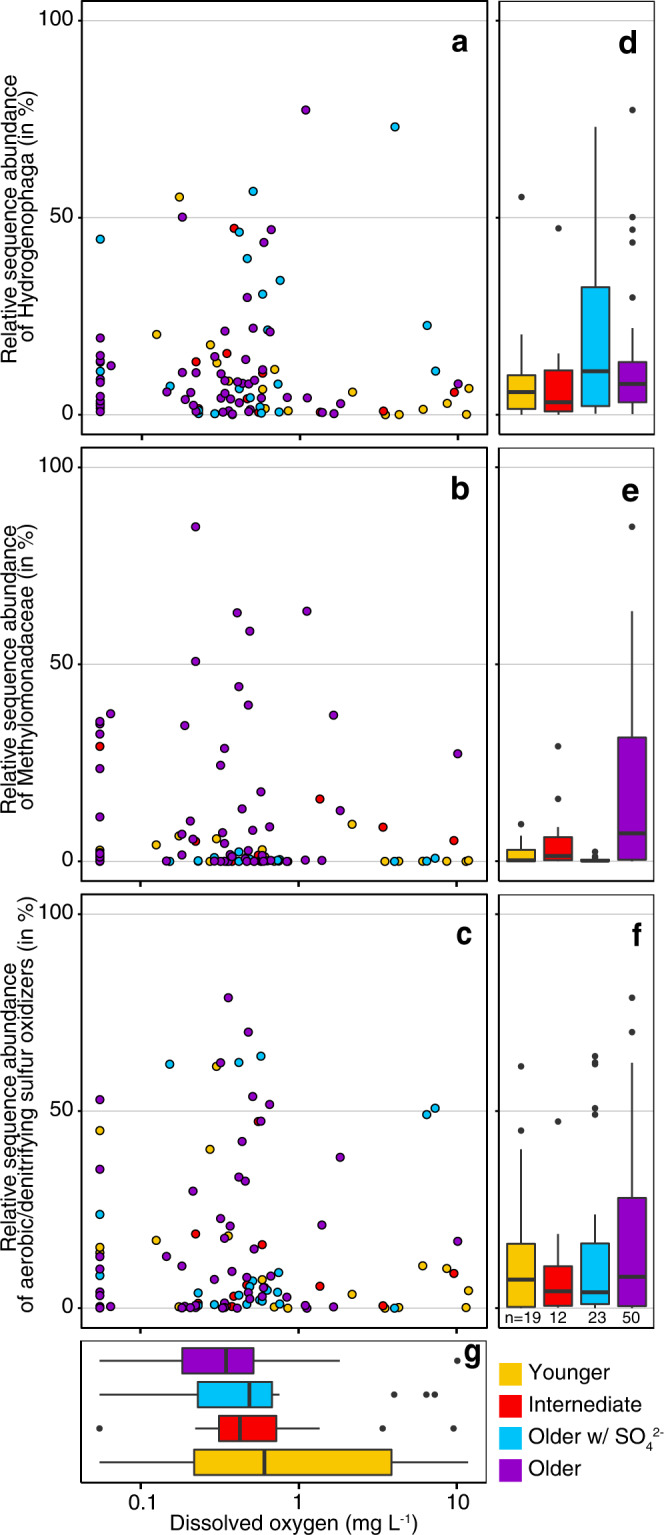
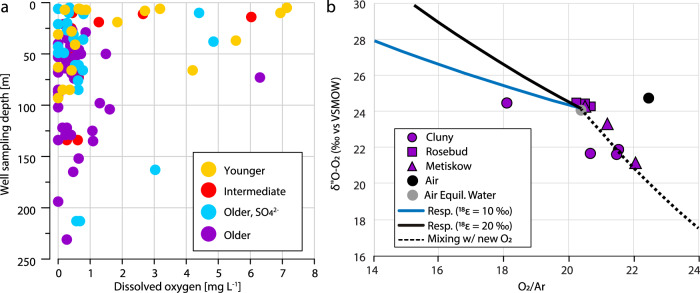
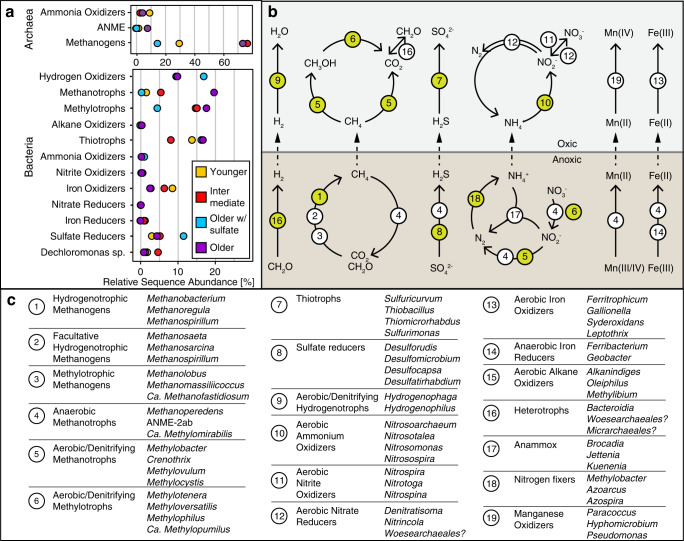
Around 50% of humankind relies on groundwater as a source of drinking water. Here we investigate the age, geochemistry, and microbiology of 138 groundwater samples from 95 monitoring wells (<250 m depth) located in 14 aquifers in Canada. The geochemistry and microbiology show consistent trends suggesting large-scale aerobic and anaerobic hydrogen, methane, nitrogen, and sulfur cycling carried out by diverse microbial communities. Older groundwaters, especially in aquifers with organic carbon-rich strata, contain on average more cells (up to 1.4 × 10⁷ mL-1) than younger groundwaters, challenging current estimates of subsurface cell abundances. We observe substantial concentrations of dissolved oxygen (0.52 ± 0.12 mg L-1 [mean ± SE]; n = 57) in older groundwaters that seem to support aerobic metabolisms in subsurface ecosystems at an unprecedented scale. Metagenomics, oxygen isotope analyses and mixing models indicate that dark oxygen is produced in situ via microbial dismutation. We show that ancient groundwaters sustain productive communities and highlight an overlooked oxygen source in present and past subsurface ecosystems of Earth.


Conflict of interest statement

The authors declare no competing interests.

Figures

Fig. 1
Fig. 1. Sampling locations, geological formations, and groundwater ages.
a Location of studied groundwater wells within the energy resources context of the province of Alberta. Colors indicate the groundwater age at each well (yellow: younger waters; red: intermediate age; blue: older waters that are sulfate-rich; purple: older waters with little sulfate). Circle size represents average microbial cell numbers in the groundwater samples, ranging from 104 (smallest full circle) to 107 cells per mL (largest circle). The map was created using Arc-GIS v10.8 b Relative proportion of water types in the surficial, channel, and bedrock sediments, as well as in major geological formations of Alberta, showing that groundwater geochemistry evolved with the increasing age of the formations. NA not assessed, HSC Horseshoe canyon, Gp. Group.
Fig. 2
Fig. 2. Groundwater geochemistry and age dating.
a Piper diagram of hydrochemical facies of each groundwater sample (circles) visualizing calcium/sodium mass ratio used as a proxy for geochemical evolution, i.e., residence time/age. Na: sodium, K: potassium, Ca: calcium, Mg: magnesium, Cl: chloride, SO42−: sulfate, CO32−: carbonate, HCO3: bicarbonate b Ca/Na ratio decreases with increasing residence time (14CDIC uncorrected age, BP: before present). 14C: 14carbon, DIC: dissolved inorganic carbon. Samples that accumulate in the plot around 40k yrs BP (detection limit of method) may be much older. 3H-positive samples (circles with crosses) comprise meteoric water past 1952 (H-bomb) and corroborate the age trend. c Schematic timeline and summary of water aging.
Fig. 3
Fig. 3. Groundwater isotope geochemistry.
Microbes mediating methane (CH4) and sulfate (SO42−) cycling impact the carbon and sulfur pools in the groundwater systems. Each circle represents a sample. Circle color depicts water age. Trends concerning reduction and oxidation of the compounds are indicated by arrows or areas. a Carbon isotopic signature of methane versus methane concentration. PDB Pee Dee Belemnite. b Sulfur isotopic signature of sulfate versus sulfate concentration. V-CDT Vienna-Canyon Diablo Troilite c Carbon isotopic signature of carbon dioxide versus carbon isotopic signature of methane. ε fractionation CO2-CH4. AC/MR Aceticlastic- /methylotrophic methanogenesis. d Sulfur isotopic signature of sulfate versus oxygen isotopic signature of sulfate.
Fig. 4
Fig. 4. Cell abundances in groundwaters.
Cell abundance was determined using fluorescence microscopy and is given on a logarithmic scale. Boxplots show 1st and 3rd quartile, maximum and minimum values (whiskers), median (line), mean (triangle), and outlier (dots). a Boxplots represent groundwater samples from individual wells and summarize cell counts from n independent fields of view. n = 40: Samples 3–10, 12, 15–22, 24–29, 34–47, 49–51, 54, 56, 63, 67–68, 70–71. n = 39: Samples 1, 14, 33. n = 38: Sample 2. n = 20: Samples 13, 31–32, 55, 57, 61, 72. n = 12: Sample 73. For more details on individual cell counts see Supplementary Data 2. X axis: Numbers correspond to well IDs (due to space constraints well IDs are given in Supplementary Data 1). Wells which were sampled at two different time points are marked with a star (*), technical replicates are marked with a plus (+). b Boxplots represent cell numbers averaged across groundwater age summarizing the average cell numbers in a (excluding technical replicates). n number of samples. Significance was tested using a Wilcoxon rank sum test. Significance levels are: *p < 0.05; **p < 0.01; ***p < 0.001; (uncorrected).
Fig. 5
Fig. 5. Microbial community diversity.
a Archaeal and b bacterial alpha diversity indices of the investigated groundwaters based on 16S rRNA gene amplicon sequence variants (ASVs). Significance was tested using a Wilcoxon rank sum test. Significance levels: *p < 0.05; **p < 0.01; ***p < 0.001; (uncorrected). Archaeal c and bacterial d community structure shown as nonmetric multidimensional ordinations based on community distances. Samples (circles) are connected to the average weighted mean of within group distances (centroid; ellipses show one standard deviation). n: see a, b, respectively. Redundancy analysis (RDA) of e archaeal (n = 64) and f bacterial community structure (n = 110) in groundwater samples (circles) using select parameters (arrows). Significance levels: *p < 0.05; **p < 0.01; ***p < 0.001; (uncorrected). The full model was highly significant for both domains, and together the 11 parameters explained 11% of archaeal and 18% of bacterial variation. The color legend in c applies to all panels. CO2 carbon dioxide, DIC dissolved inorganic carbon.
Fig. 6
Fig. 6. Microbial community composition.
Relative sequence abundance of the top 20 most abundant a archaeal and b, c bacterial lineages at genus level based on 16S rRNA gene amplicon sequence variants. The remaining lineages with lower abundances are summarized as Other. Genera that were unclassified in the SILVA reference database are abbreviated as unc and the next higher phylogenetic level is shown. The two archaeal clades denoted by * belong to the order Woesearchaeales. One methanogen, as well as almost half (9 of 20) of the top bacterial genera are also represented by metagenome-assembled genomes (Fig. 7). The legend in b applies to all panels.
Fig. 7
Fig. 7. Metagenome-assembled genomes and key metabolic pathways.
Selected metagenome-assembled genomes (MAGs) of abundant microbial populations in groundwaters show the genetic capabilities of methane, sulfur, and nitrogen cycling. Color shade depicts the completeness of the pathway, the included genes are shown in brackets. Numbers refer to redundancy in a pathway or enzyme. As an example, MAG-06 has two methane monooxygenases, one encoded by pmoABC the other by smmo and mmoDYZ. Commas between genes: and; dashes between genes: and/or. MAG taxonomy is based on GTDB-Tk, and abundance was estimated by read mapping considering binned and unbinned reads. The full set of 61 metagenome-assembled genomes and 450 annotated genes is provided in Supplementary Data 5.
Fig. 8
Fig. 8. Abundance of aerobic/denitrifying hydrogen, methane, and sulfur oxidizers versus oxygen concentration.
a Hydrogenophaga b Methylobacter and Methylotenera and c Sulfuricurvum and Thiobacillus. Oxygen concentration is shown on pseudo-log10 scale, to include samples with no oxygen (zero). Boxplots summarize relative abundances of d hydrogenotrophs, e methylotrophs, f thiotrophs, and g oxygen concentrations based on water age categories (upper and lower quartiles and whiskers (each representing 25% of the data), median (line) and outliers (dots)). Relative sequence abundances of the aerobic/denitrifying clades tend to peak at hypoxic conditions (~0.5 mg L−1) potentially because these waters contain both sufficient electron donors (hydrogen, methane, sulfur) and electron acceptors (oxygen, nitrate). n is given in f and applies to all panels.
Fig. 9
Fig. 9. Concentration and isotopic signature of oxygen in groundwater samples.
a Depth profile and dissolved oxygen concentration (mg L−1) in the groundwater samples. b 18O-O2 isotopic signature over oxygen:argon ratio (O2/Ar). The composition of lab air-equilibrated water and lab air are represented by a gray and black circle, respectively. Error bars are 1 standard deviation (based on repeat analysis of lab air, n = 13) and are smaller than the symbols. The blue and black solid lines show different isotope effects that would be caused by fractionation (e) due to respiration (resp.). During consumption of O2 by respiration (decreasing O2:Ar ratio), there is a preferential accumulation of 18O in the remaining O2 pool—leading to higher δ18OO2 values. As the degree of this isotope fractionation can vary the two solid lines represents two hypothetical but realistic scenarios for how the O2 pool might change with microbial respiration. The black dashed line represents a mixing line between air-equilibrated water mixed with a hypothetical ‘new source of O2’ that has a very low δ18OO2 (−20‰ vs V-SMOW). Such isotopically light oxygen is consistent with the biological formation of O2. V-SMOW Vienna Standard Mean Ocean Water.
Fig. 10
Fig. 10. Microbial guilds and potential community functions.
a Relative sequence abundances of microbial guilds. ANME: Anaerobic methane-oxidizing archaea b Schematic overview of element cycling inferred from microbiological and geochemical analyses. Numbers refer to key microbial genera and their potential function listed in c. CH2O: biomass, H2: hydrogen, H2O: water, CO2: carbon dioxide, CH4: methane, CH3OH: methanol, SO42−: sulfate, H2S: sulfide, NO3: nitrate, NO2: nitrite, N2: nitrogen, NH4+: ammonium, Mn: manganese, Fe: iron. c Microbial lineages and their potential function. The list of microbes is not exhaustive and mainly contains the most abundant genera observed in this study. Processes in b depicted with white circles are supported by geochemistry and/or metabarcoding, and processes depicted by lime-green circles are additionally supported by the respective metabolic capabilities present in metagenome-assembled genomes.

References

    1. Shiklomanov, I. A. World fresh water resources. In: water in crisis - a guide to the World’s fresh water resources (ed. Gleick, P. H.) 13–24 (Oxford University Press, 1993).
    1. Malki K, et al. Prokaryotic and viral community composition of freshwater springs in Florida, USA. MBio. 2020;11:e00436–20. doi: 10.1128/mBio.00436-20. - DOI - PMC - PubMed
    1. Magnabosco C, et al. The biomass and biodiversity of the continental subsurface. Nat. Geosci. 2018;11:707–717. doi: 10.1038/s41561-018-0221-6. - DOI
    1. Overholt WA, et al. Carbon fixation rates in groundwater similar to those in oligotrophic marine systems. Nat. Geosci. 2022;15:561–567. doi: 10.1038/s41561-022-00968-5. - DOI
    1. Anantharaman K, et al. Thousands of microbial genomes shed light on interconnected biogeochemical processes in an aquifer system. Nat. Commun. 2016;7:13219. doi: 10.1038/ncomms13219. - DOI - PMC - PubMed

Publication types