Meta-Analysis
. 2023 Jun 13;13(1):9567.
doi: 10.1038/s41598-023-36638-8.

Reference-based cell type matching of in situ image-based spatial transcriptomics data on primary visual cortex of mouse brain

Affiliations
Meta-Analysis

Reference-based cell type matching of in situ image-based spatial transcriptomics data on primary visual cortex of mouse brain

Yun Zhang et al. Sci Rep. .

Abstract

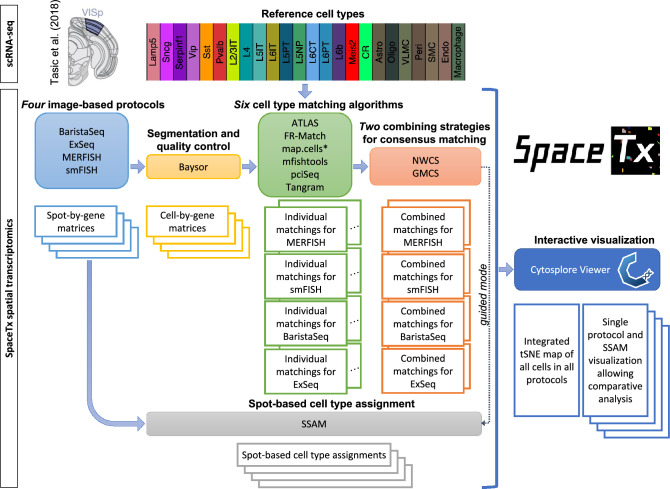
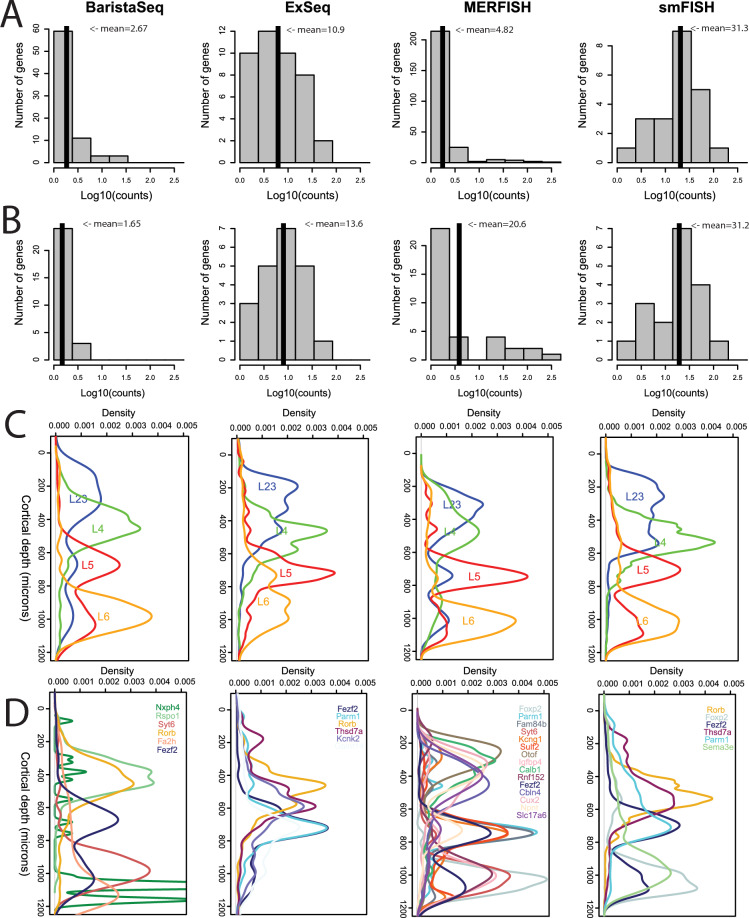
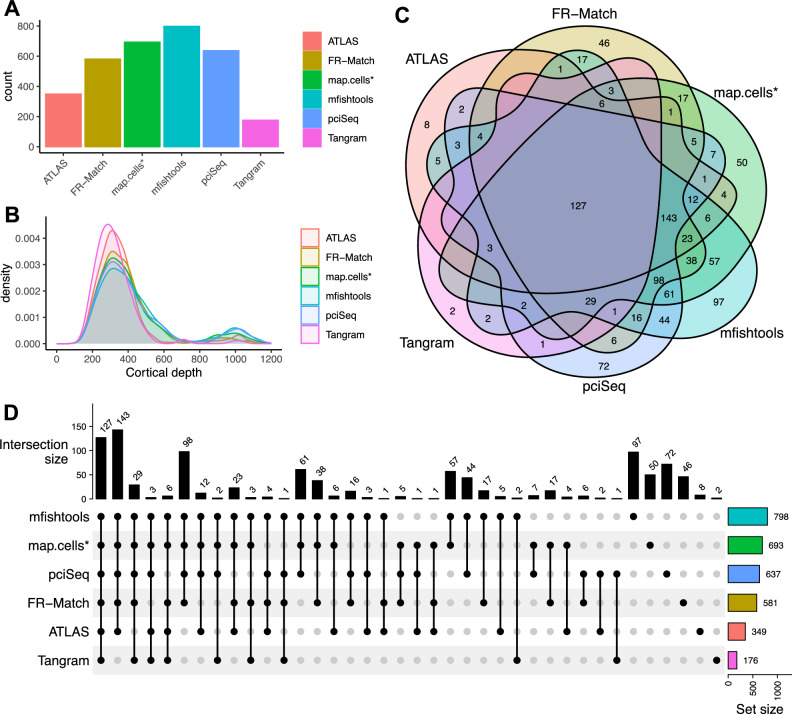
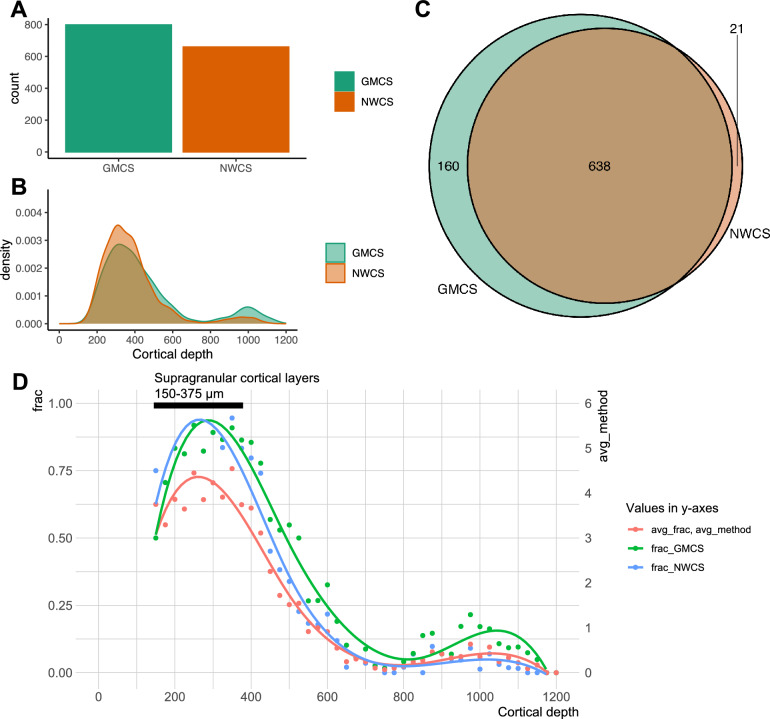
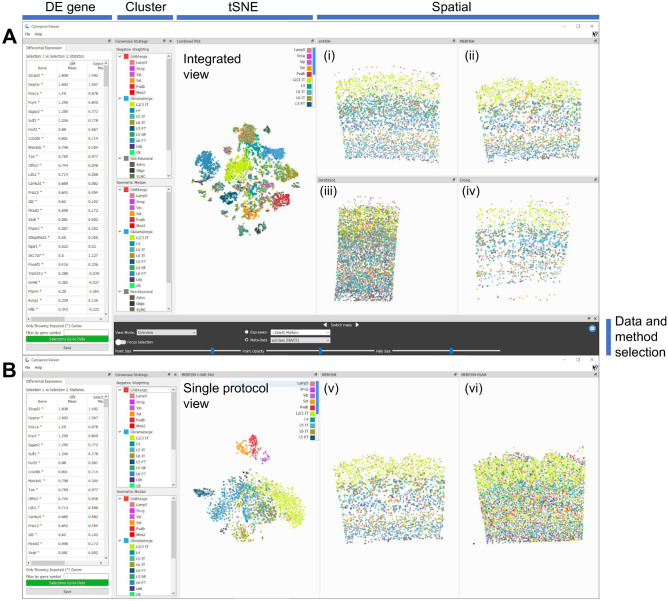
With the advent of multiplex fluorescence in situ hybridization (FISH) and in situ RNA sequencing technologies, spatial transcriptomics analysis is advancing rapidly, providing spatial location and gene expression information about cells in tissue sections at single cell resolution. Cell type classification of these spatially-resolved cells can be inferred by matching the spatial transcriptomics data to reference atlases derived from single cell RNA-sequencing (scRNA-seq) in which cell types are defined by differences in their gene expression profiles. However, robust cell type matching of the spatially-resolved cells to reference scRNA-seq atlases is challenging due to the intrinsic differences in resolution between the spatial and scRNA-seq data. In this study, we systematically evaluated six computational algorithms for cell type matching across four image-based spatial transcriptomics experimental protocols (MERFISH, smFISH, BaristaSeq, and ExSeq) conducted on the same mouse primary visual cortex (VISp) brain region. We find that many cells are assigned as the same type by multiple cell type matching algorithms and are present in spatial patterns previously reported from scRNA-seq studies in VISp. Furthermore, by combining the results of individual matching strategies into consensus cell type assignments, we see even greater alignment with biological expectations. We present two ensemble meta-analysis strategies used in this study and share the consensus cell type matching results in the Cytosplore Viewer ( https://viewer.cytosplore.org ) for interactive visualization and data exploration. The consensus matching can also guide spatial data analysis using SSAM, allowing segmentation-free cell type assignment.


Conflict of interest statement

The authors declare no competing interests.

Figures

Figure 1
Figure 1
Overview of the SpaceTx analysis workflow. The reference scRNA-seq cell types of the primary visual cortex (VISp) of mouse brain are from Tasic et al.. Spatial transcriptomics data were generated by four image-based experimental protocols (MERFISH, smFISH, BaristaSeq, and ExSeq). Segmentation and quality control were performed using a common procedure (Baysor). Six computational algorithms (ATLAS, FR-Match, map.cells*, mfishtools, pciSeq, and Tangram) for cell type matching were applied. Two meta-analysis strategies were used to combine the individual matching results. Spot-based segmentation-free cell type assignment was conducted using SSAM. All data and matching results can be viewed in Cytosplore Viewer (https://viewer.cytosplore.org).
Figure 2
Figure 2
Comparison of gene properties across experimental protocols. (A) Distribution of average number of reads in all cells with at least one read for each gene in the experiment. Vertical lines represent the average value in the histogram. (B) Distribution of average number of reads in all cells with at least one read for the subset of genes in the experiment found in at least two other experiments (up to 40 total). Vertical lines represent the average value in the histogram. (C) Density plot of spots across the axis perpendicular to cortical layers (y-axes) for sets of genes marking L2/3 (Cux2, Lamp5, Cxcl14), L4 (Rorb, Rspo1), L5 (Fezf2, Parm1), and L6 (Sema3e, Foxp2, Syt6) in mouse VISp. At least one gene from each layer list was assayed in each experiment (Supplemental Table S1). Individual genes are pooled to generate a single density curve per layer. Densities (x-axes) are shown in the same scale across all panels in (C, D). (D) Density plot of up to the 15 genes with the highest maximum density and with maximum density ≥ 0.0025. Genes are color-coded as shown.
Figure 3
Figure 3
Cell type matching performance comparison on the L2/3 IT subclass of MERFISH data. Six computational methods were applied to match/assign reference cell types to the spatial cells. (A) Number of cells matched to the L2/3 IT subclass by each individual method. (B) Spatial distribution of the cells matched to the L2/3 IT subclass by each individual method. X-axis is the spatial axis perpendicular to cortical layers measured as distance (μm) from pia (left end: upper layer, right end: deeper layer). (C) Overlapping of cells matched to the L2/3 IT subclass by each individual method. (D) Breakdown of the intersections of cells matched to the L2/3 IT subclass by individual methods.
Figure 4
Figure 4
Combined cell type matching performance on the L2/3 IT subclass of MERFISH data. Two ensemble approaches were applied to combine the individual matching results, resulting in two combined matchings—GMCS and NWCS. (A) Number of cells matched to the L2/3 IT subclass in each combined matching result. (B) Spatial distribution of the cells matched to the L2/3 IT subclass in each combined matching result. X-axis is the spatial axis perpendicular to cortical layers measured as distance (μm) from pia (left end: upper layer, right end: deeper layer). (C) Overlapping of cells matched to the L2/3 IT subclass in the combined matching results. (D) Comparison between averaged summary statistics of the individual matching results and summary statistics of the combined matching results. Each dot represents a bin size of 25 μm in the cortical depth axis. Avg_frac is the fraction of cells matched to the L2/3 IT subclass in the cortical depth bin averaged over individual matching methods. Avg_method is the average number of individual methods that matched a cell to L2/3 IT subclass in the cortical depth bin. Frac_GMCS and Frac_NSCS are the fraction of cells matched to the L2/3 IT subclass in the cortical depth bin for the combined matching results. Supragranular cortical layers are indicated by the black bar.
Figure 5
Figure 5
Spatial distributions of inhibitory and excitatory neurons in individual and combined matching results of MERFISH data. Top: distributions (cortical depth) of inhibitory neurons of Vip, Sst, and Pvalb types show a peak of Vip type in upper layers and peaks of Sst and Pvalb types in deeper layers. Bottom: distributions of excitatory neurons follow the major laminar pattern expected, with various minor peaks in different methods. For detailed view, see the corresponding spatial coordinate plots of the matched cells for each subclass using each method in Supplementary Figs. S2–S7 and S10–S11.
Figure 6
Figure 6
Side-by-side comparison between the segmentation and the SSAM results. Images of VISp tissue from four experimental methods (rows) with either cells (segmentation columns) or spots (SSAM columns) color coded by cell type assignments based on the NWCS (left columns) or GWCS (right columns) combining methods. The colors of each cell type can be found in Fig. 1. The scale bars represent 100 μm in all panels. Panels show similar laminar patterns in each row with some exceptions noted in the main text. Subplots (i) and (ii) correspond to the distributions in Fig. 4B, where the L2/3 cells (bright green color) distribute in a slightly wider top layer and have more occurrences in deeper layer in the GMCS subplot (ii) compared to the NWCS subplot (i).
Figure 7
Figure 7
Cytosplore Viewer enables comparative visualization of the SpaceTx data and methods, enabling cell selection from cluster taxonomies (cluster panel), tSNE of single cells based on expression profiles (tSNE panel) and spatial coordinates of cells/local maxima (spatial panels). (A) Cross-protocol comparison view: an integrated tSNE map of all cells enables side-by-side comparison of spatial patterning of both consensus matching results on smFish (i), MERFISH (ii), BaristaSeq (iii) and ExSeq (iv), as well as differential expression analysis of cell selections (DE gene panel). (B) Single protocol comparison view enables comparing the consensus matchings in the segmentation-based methods (v) and segmentation-free SSAM results (vi) for the individual spatial protocols. Viewing panels are highlighted on the top; data and method selection panel is highlighted to the right of the figure. The NWCS results are shown in both (A, B); MERFISH data and results are shown in (B). Data and methods can be selected in the data and method selection panel.

Similar articles

Cited by

References

    1. Regev A, Teichmann SA, Lander ES, Amit I, Benoist C, Birney E, Bodenmiller B, Campbell P, Carninci P, Clatworthy M, et al. The human cell atlas. Elife. 2017;6:e27041. doi: 10.7554/eLife.27041. - DOI - PMC - PubMed
    1. BRAIN Initiative Cell Census Network (BICCN) A multimodal cell census and atlas of the mammalian primary motor cortex. Nature. 2021;598(7879):86–102. doi: 10.1038/s41586-021-03950-0. - DOI - PMC - PubMed
    1. HuBMAP Consortium The human body at cellular resolution: the NIH Human Biomolecular Atlas Program. Nature. 2019;574(7777):187–192. doi: 10.1038/s41586-019-1629-x. - DOI - PMC - PubMed
    1. Tasic B, Yao Z, Graybuck LT, Smith KA, Nguyen TN, Bertagnolli D, Goldy J, Garren E, Economo MN, Viswanathan S. Shared and distinct transcriptomic cell types across neocortical areas. Nature. 2018;563(7729):72–78. doi: 10.1038/s41586-018-0654-5. - DOI - PMC - PubMed
    1. Hodge RD, Bakken TE, Miller JA, Smith KA, Barkan ER, Graybuck LT, Close JL, Long B, Johansen N, Penn O, et al. Conserved cell types with divergent features in human versus mouse cortex. Nature. 2019;573(7772):61–68. doi: 10.1038/s41586-019-1506-7. - DOI - PMC - PubMed

Publication types