. 2023 Jun 13;6(1):638.
doi: 10.1038/s42003-023-05011-w.

BMPER is a marker of adipose progenitors and adipocytes and a positive modulator of adipogenesis

Affiliations

BMPER is a marker of adipose progenitors and adipocytes and a positive modulator of adipogenesis

Jacob D Garritson et al. Commun Biol. .

Abstract

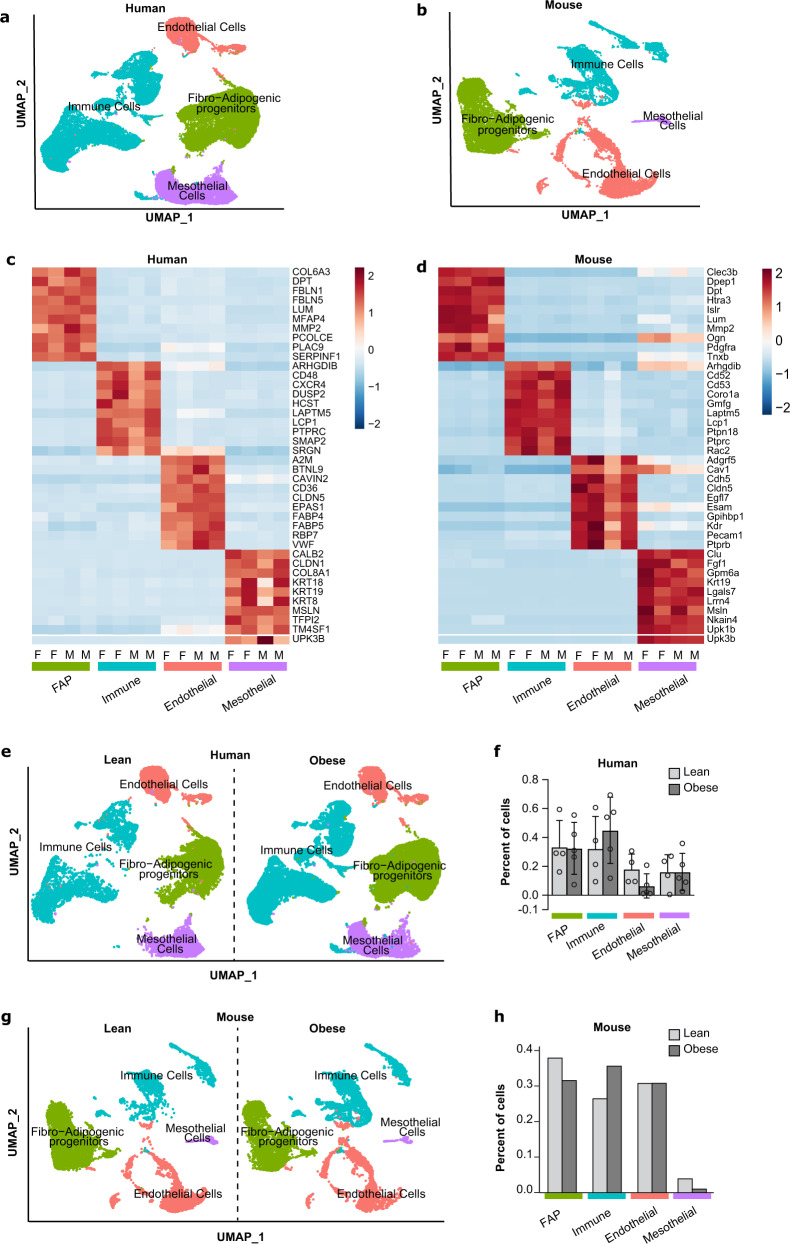
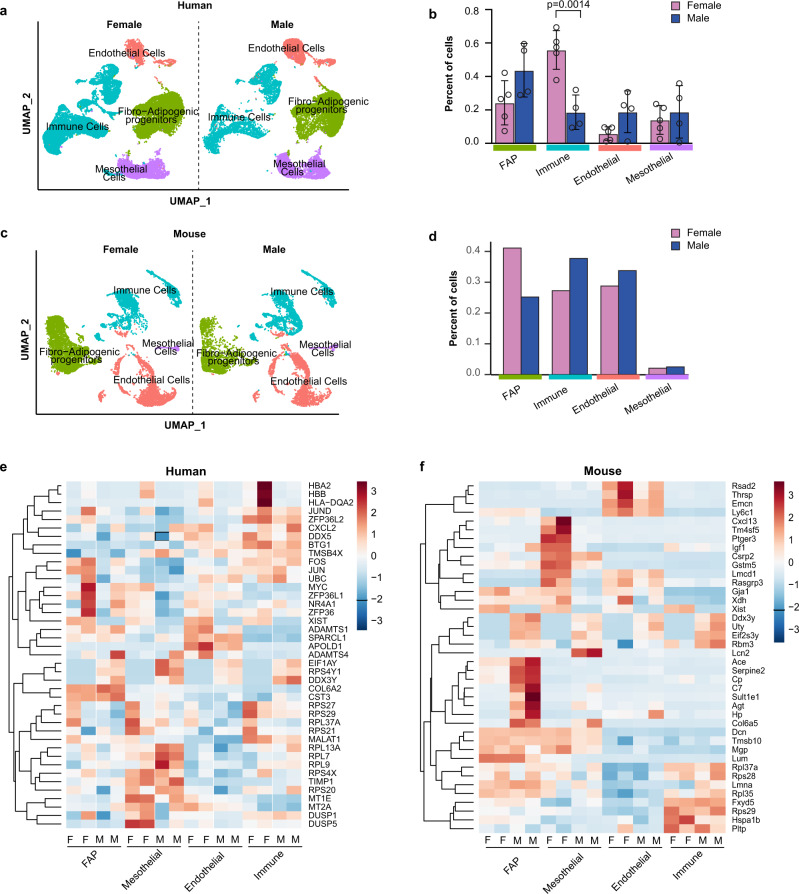
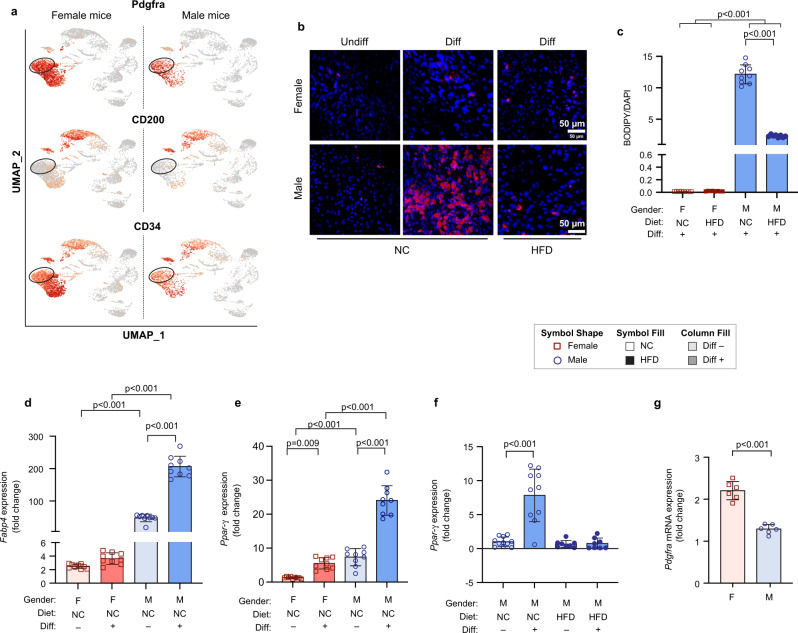
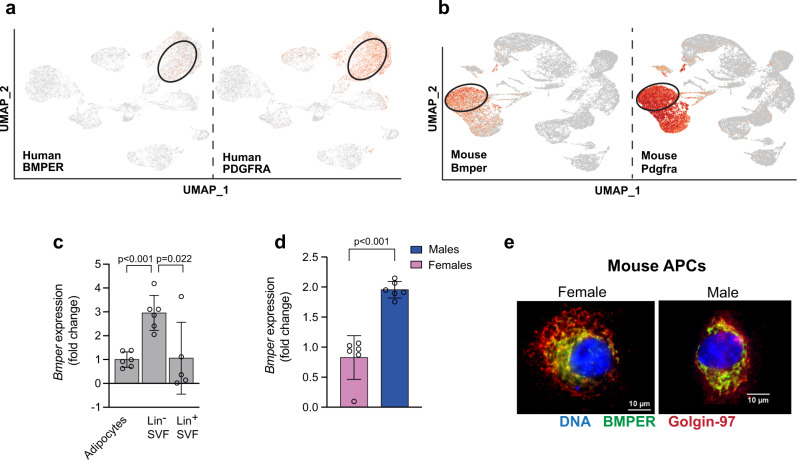
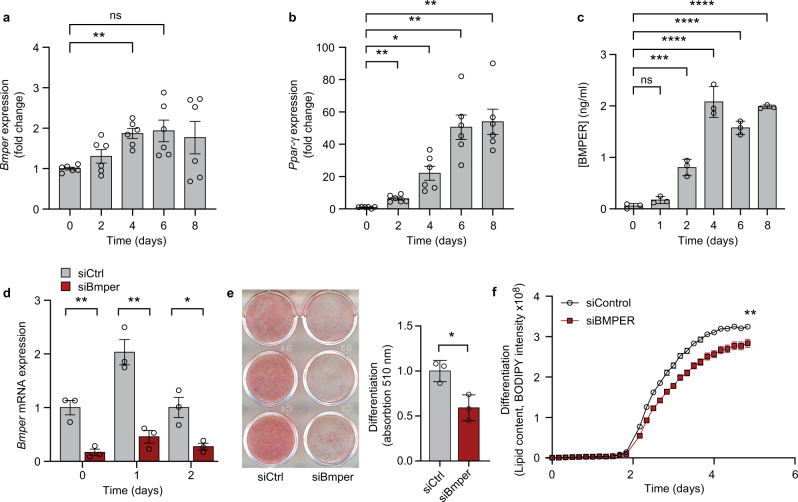
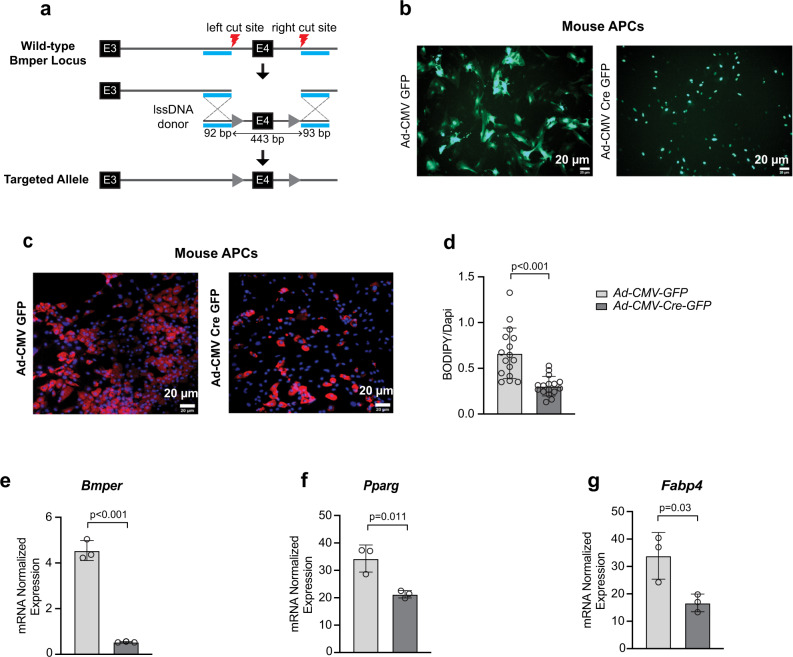
Autocrine and paracrine signaling regulating adipogenesis in white adipose tissue remains largely unclear. Here we used single-cell RNA-sequencing (RNA-seq) and single nuclei RNA-sequencing (snRNA-seq) to identify markers of adipose progenitor cells (APCs) and adipogenic modulators in visceral adipose tissue (VAT) of humans and mice. Our study confirmed the presence of major cellular clusters in humans and mice and established important sex and diet-specific dissimilarities in cell proportions. Here we show that bone morphogenetic protein (BMP)-binding endothelial regulator (BMPER) is a conserved marker for APCs and adipocytes in VAT in humans and mice. Further, BMPER is highly enriched in lineage negative stromal vascular cells and its expression is significantly higher in visceral compared to subcutaneous APCs in mice. BMPER expression and release peaked by day four post-differentiation in 3T3-L1 preadipocytes. We reveal that BMPER is required for adipogenesis both in 3T3-L1 preadipocytes and in mouse APCs. Together, this study identified BMPER as a positive modulator of adipogenesis.


Conflict of interest statement

The authors declare no competing interests.

Figures

Fig. 1
Fig. 1. scRNA-seq recovers canonical cell types from visceral adipose tissue (VAT) in humans and mice.
a Aggregate UMAP of major cell types in the stromal vascular fraction (SVF) of human omental fat. b Aggregate UMAP of major cell types in the stromal vascular fraction SVF of mouse perigonadal fat. c Heatmap of the top 10 highest expressed genes in each cell type for human females (F) or males (M). d Heatmap of the top 10 highest expressed genes in each cell type for mouse females (F) or males (M). e UMAPs split by obesity status in humans. f Proportion of each cell type in lean or obese human samples. g UMAPs split by obesity status in mice. h Proportion of each cell type in lean or obese mouse samples. Values are mean ± SD in (f). n = 4 lean and 5 obese for (f) and n = 1 pooled sample from n = 10 mice fed normal chow diet (lean) and n = 1 pooled sample from n = 10 mice fed high-fat diet (obese) for (h).
Fig. 2
Fig. 2. Effects of sex on visceral adipose tissue (VAT) cellular composition in humans and mice.
a UMAP of major cell types in the SVF of human omental fat samples split by sex. b Proportion of each cell type in female or male human samples. c UMAP of major cell types in the SVF of mouse perigonadal fat samples split by sex. d Proportion of each cell type in female or male mouse samples. e Heatmap of the top 10 upregulated genes in each cell type for the female vs. male contrasts in humans. f Heatmap of the top 10 upregulated genes in each cell type for the female vs. male contrasts in mice. Values are mean ± SD in (b). n = 4 females and 5 males for (b) and n = 1 pooled sample from n = 10 male mice and n = 1 pooled sample from n = 10 female mice for (d). **p < 0.005 versus male within the same cell cluster. An unpaired t Test was used to compare the means for each cell cluster.
Fig. 3
Fig. 3. Effects of obesity and sex on FAP clusters in VAT of humans and mice.
a, d UMAPs of FAP clusters in human and mouse separated by obesity status. b, c The effects of obesity on the proportions of FAP clusters 1, 4, and 6 in humans and mice. e, f The effects of sex on the proportions of FAP clusters 1, 4, and 6 in humans and mice. Values are mean ± SD. n = 4 lean and 5 obese for (b); n = 4 females and 5 males for (e) and n = 1 pooled sample from n = 10 male mice and n = 1 pooled sample from n = 10 female mice fed either a normal chow diet (NCD) or a high-fat diet (HFD) for (c, f).
Fig. 4
Fig. 4. The effect of sex and diet on adipogenic capacity of visceral APCs in mice.
a Representative UMAPs from male or female mice demonstrating that Pdgfra+CD34low cells are CD200-. b Representative images showing lipid accumulation measured by BODIPY (red) and Dapi (blue) staining following differentiation of CD34lowCD200- visceral APCs in male or female mice fed either a normal chow (NC) diet or (HFD) for 8 weeks. c Quantification of positive BODIPY area normalized to Dapi. d, e Relative mRNA expression of Pparγ and Fabp4 in undifferentiated (undiff) or differentiated (diff) visceral APCs from female or male mice fed a NC diet. f Relative mRNA expression of Pparγ in undiff or diff visceral APCs from male mice fed NCD or HFD, respectively. g Relative mRNA expression of Pdgfra in undifferentiated visceral APCs from female or male mice fed NCD. Values are mean ± SD. n = 3 independent experiments. Scale bar in (b) is 50 µm.
Fig. 5
Fig. 5. Bone morphogenetic protein (BMP) binding endothelial regulator (BMPER) is highly expressed in visceral APCs in humans and mice.
a UMAPs of aggregate human omental fat showing BMPER is expressed in the PDGFRA+ population. b UMAPs of aggregate mouse perigonadal fat showing Bmper is expressed in the Pdgfra+ population. c Relative mRNA expression of Bmper in mature adipocytes, lineage- (Lin-), and Lin+ SVF isolated from epididymal white adipose tissue of male C57BL6/J control mice. d Relative mRNA expression of Bmper in undifferentiated visceral APCs from female or male mice. e Immunohistochemistry staining for Bmper (green), Golgin-97 (red), or Dapi (blue) in undifferentiated visceral APCs from female or male mice. Values are means ± SD. n = two independent experiments in (c) and n = 6 in (d).
Fig. 6
Fig. 6. Bmper increases during differentiation of 3T3-L1 preadipocytes and is important for adipogenesis.
a Relative mRNA expression of Bmper in 3T3-L1 cells during different timepoints of differentiation. b Relative mRNA expression of Pparγ in 3T3-L1 cells during different timepoints of differentiation. c Secreted Bmper protein measured during different timepoints of differentiation in 3T3-L1 cells. d Relative mRNA expression of Bmper following siRNA knockdown in 3T3-L1 cells at different timepoints of differentiation. e Oil red O staining and quantification in differentiated 3T3-L1 cells treated with control siRNA or Bmper siRNA knockdown. f Lipid content during differentiation in control or Bmper siRNA knockdown measured by BODIPY intensity. Values are means ± SD. n = two independent experiments.
Fig. 7
Fig. 7. Bmper knockout in mouse primary visceral APCs reduces adipogenesis.
a Schematic detailing the generation of Bmperfl/fl mice on a C57BL6/J background using CRISPR/Case 9. Adipose progenitor cells (APCs) were sorted from epididymal white adipose tissue of male Bmperfl/fl mice. b Representative images of green fluorescent protein (GFP) expression in visceral APCs from male Bmperfl/fl mice infected with adenovirus expressing control GFP (Ad-CM-GFP) or adenovirus expressing Cre-GFP (Ad-CMV-Cre-GFP) prior to differentiation. c Representative images showing lipid accumulation in APCs infected with control GFP or Cre-GFP vectors and stained with BODIPY (red) and Dapi (blue) following differentiation. d Quantification of positive BODIPY area normalized to Dapi. eg Relative mRNA expression of Bmper, Pparγ, and Fabp4 in control GFP or Cre GFP following differentiation. Values are mean ± SD. n = three independent experiments.

References

    1. Calle EE, Thun MJ, Petrelli JM, Rodriguez C, Heath CW., Jr. Body-mass index and mortality in a prospective cohort of U.S. adults. N. Engl. J. Med. 1999;341:1097–1105. doi: 10.1056/NEJM199910073411501. - DOI - PubMed
    1. Arner P, et al. Variations in the size of the major omentum are primarily determined by fat cell number. J. Clin. Endocrinol. Metab. 2013;98:E897–E901. doi: 10.1210/jc.2012-4106. - DOI - PubMed
    1. Bastien M, Poirier P, Lemieux I, Despres JP. Overview of epidemiology and contribution of obesity to cardiovascular disease. Prog. Cardiovasc. Dis. 2014;56:369–381. doi: 10.1016/j.pcad.2013.10.016. - DOI - PubMed
    1. Zhao H, Ramos CF, Brooks JD, Peehl DM. Distinctive gene expression of prostatic stromal cells cultured from diseased versus normal tissues. J. Cell Physiol. 2007;210:111–121. doi: 10.1002/jcp.20828. - DOI - PMC - PubMed
    1. Buffolo M, et al. Identification of a paracrine signaling mechanism linking CD34(high) progenitors to the regulation of visceral fat expansion and remodeling. Cell Rep. 2019;29:270–282.e275. doi: 10.1016/j.celrep.2019.08.092. - DOI - PMC - PubMed

Publication types