. 2023 Jun 13;14(1):3479.
doi: 10.1038/s41467-023-39245-3.

Excessive copper impairs intrahepatocyte trafficking and secretion of selenoprotein P

Affiliations

Excessive copper impairs intrahepatocyte trafficking and secretion of selenoprotein P

Maria Schwarz et al. Nat Commun. .

Abstract

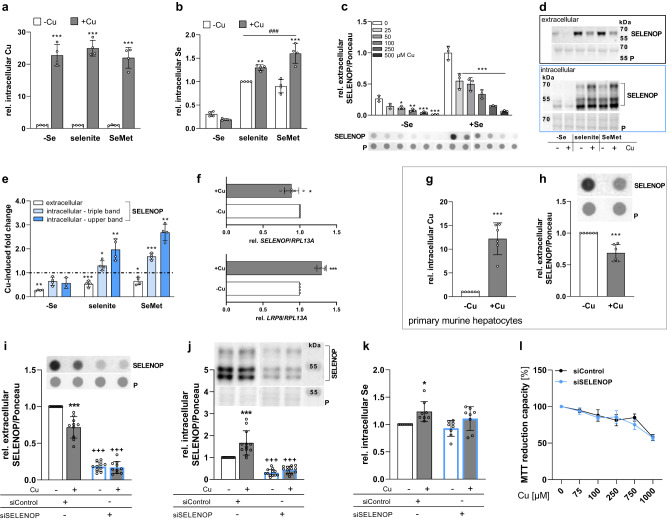
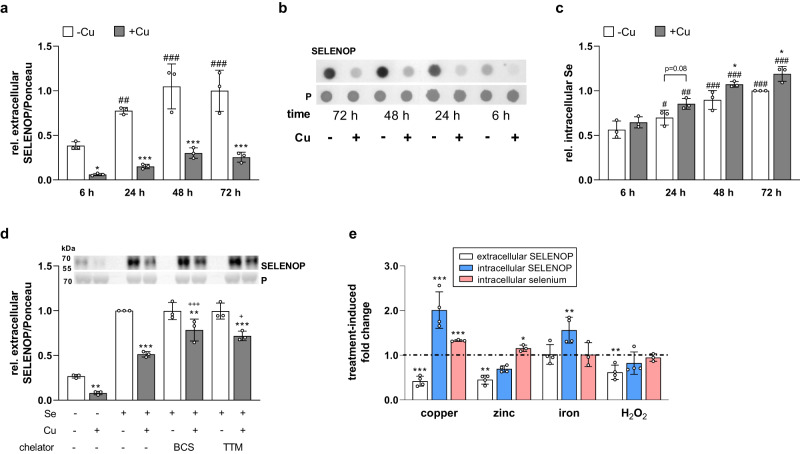
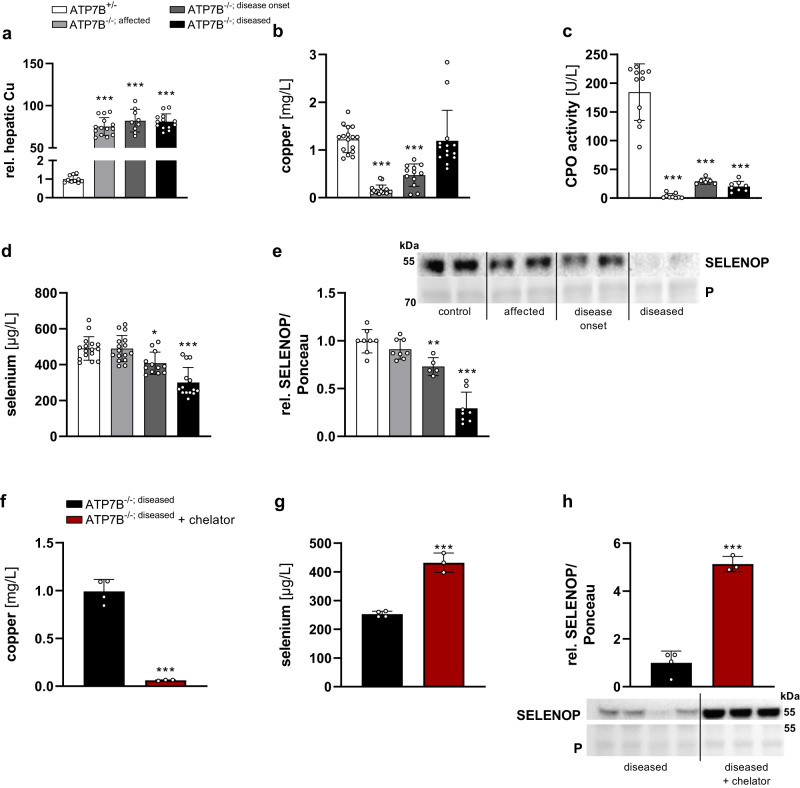
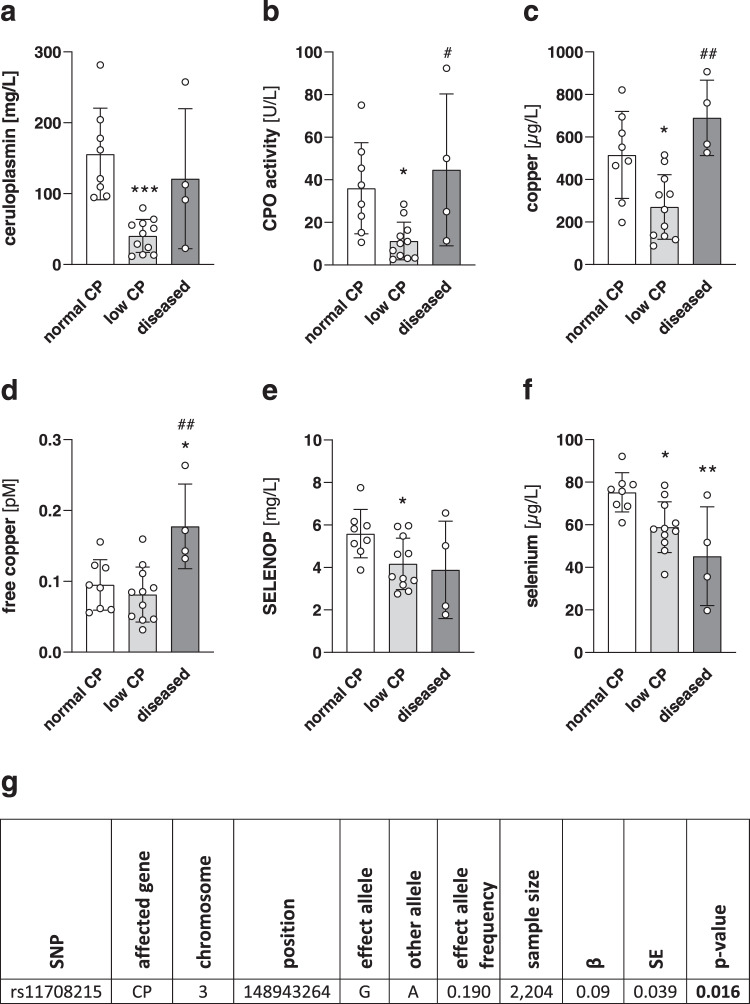
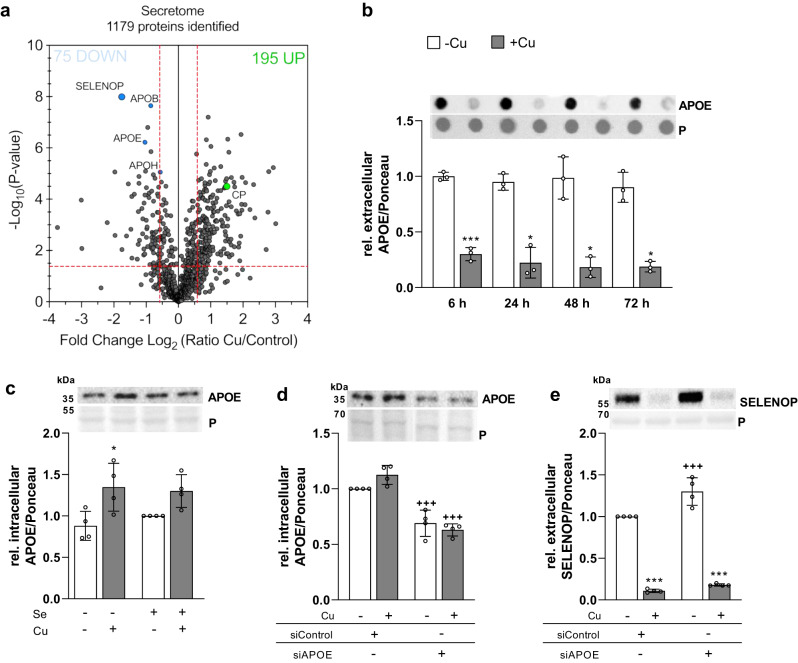
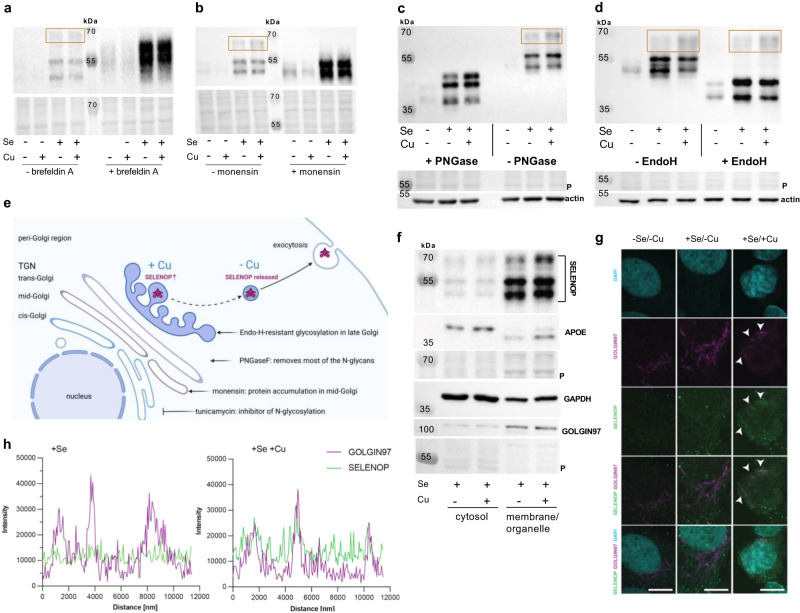
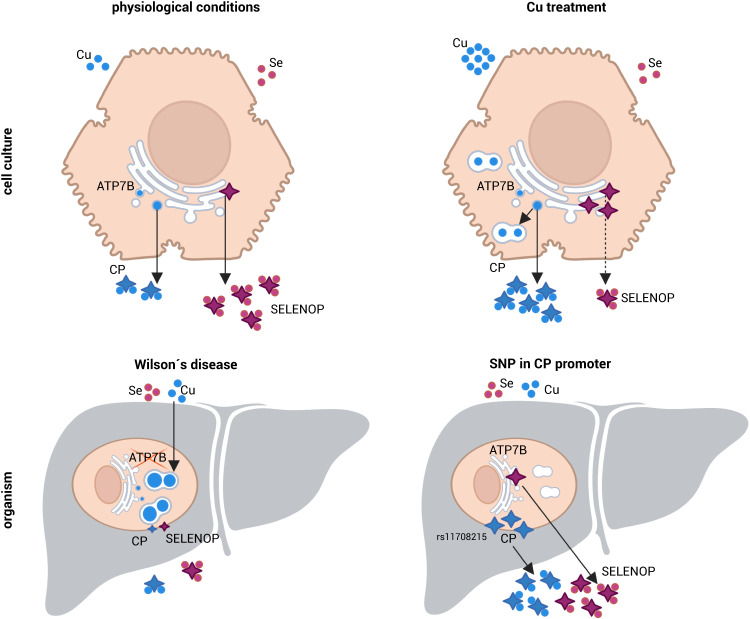
Selenium homeostasis depends on hepatic biosynthesis of selenoprotein P (SELENOP) and SELENOP-mediated transport from the liver to e.g. the brain. In addition, the liver maintains copper homeostasis. Selenium and copper metabolism are inversely regulated, as increasing copper and decreasing selenium levels are observed in blood during aging and inflammation. Here we show that copper treatment increased intracellular selenium and SELENOP in hepatocytes and decreased extracellular SELENOP levels. Hepatic accumulation of copper is a characteristic of Wilson's disease. Accordingly, SELENOP levels were low in serum of Wilson's disease patients and Wilson's rats. Mechanistically, drugs targeting protein transport in the Golgi complex mimicked some of the effects observed, indicating a disrupting effect of excessive copper on intracellular SELENOP transport resulting in its accumulation in the late Golgi. Our data suggest that hepatic copper levels determine SELENOP release from the liver and may affect selenium transport to peripheral organs such as the brain.


Conflict of interest statement

L.S. holds shares of selenOmed GmbH, a company involved in selenium status assessment. The remaining authors declare no competing interests.

Figures

Fig. 1
Fig. 1. Copper interferes with hepatic selenium homeostasis.
Intracellular Cu and Se concentrations were determined using TXRF with 1 mg/L Yttrium as standard for 1000 s and normalized to protein content of HepG2 cells (a, b, g, k). Extra- and intracellular SELENOP was determined using Western or dot blot and normalized to Ponceau (P) staining (d, e, hj). a, b Intracellular Cu and Se content of cells treated with 0 or 100 µM CuSO4 without (-Se) or with 50 nM selenite or 200 nM SeMet (n = 4). c Extracellular SELENOP was determined in medium of HepG2 cells treated for 72 h with or without selenite and increasing Cu concentrations 24 h prior to harvest (n = 3). d Representative Western Blots of extra- and intracellular SELENOP and Ponceau staining of cells treated as described for ab. e Quantification of extra- and intracellular SELENOP bands from Western Blots (shown in d) presented as Cu-induced fold changes (n = 4). Respective cells without Cu treatment were set as 1 (dotted line). f mRNA expression of SELENOP (n = 7) and LRP8 (n = 4) was determined by qPCR after 24 h incubation with 0 or 100 µM CuSO4 and normalized to RPL13A. g, h Intracellular Cu concentration and extracellular SELENOP of primary, murine hepatocytes treated for 24 h after isolation with 50 nM selenite in combination with 0 or 10 µM CuSO4 (n = 6). ik A siRNA-mediated knockdown of SELENOP was generated and extra- (n = 10) and intracellular SELENOP (n = 12) and intracellular Se concentrations (n = 8) were analyzed after 72 h treatment with selenite and/or Cu. l MTT reduction capacity of SELENOP knockdown and control cells treated for 48 h with selenite including a 24 h incubation with increasing Cu concentrations. Cytotoxicity was related to cells without Cu treatment (n = 3). Data are depicted as mean ± SD. Biological replicates are indicated by individual dots. Statistical analyses were based on two-way ANOVA with Bonferroni’s post-test (ac, il) or on two-tailed t test compared to cells without Cu treatment (eh). *p < 0.05; **p < 0.01; ***p < 0.001 vs. -Cu, ###p < 0.001 vs. -Se; +++p < 0.001 vs. siControl. Source data are provided as a source Data file.
Fig. 2
Fig. 2. Copper is a fast inhibitor of SELENOP excretion.
ac Extracellular SELENOP and intracellular Se concentrations of HepG2 cells which were co-incubated with Cu and Se for indicated time points, analyzed using dot blot and normalized to Ponceau (P) staining or by TXRF (n = 3). d Extracellular SELENOP of HepG2 cells treated for 72 h with 0 or 100 µM CuSO4 in combination with or without 50 nM selenite. In addition, 24 h prior to harvest the Cu chelators BCS or TTM were added. Samples were analyzed by Western Blot, normalized to Ponceau staining, and selenite-treated cells were set as 1 (n = 3). e Extra- and intracellular SELENOP (n = 4) and selenium concentration (n = 3) of HepG2 cells treated with 50 nM selenite in combination with either 100 µM Cu, Zn or Fe for 72 h or with 600 µM H2O2 for 6 h (in selenite supplied cells) presented as fold change to selenite only treated cells. Respective cells without further treatment were set as 1 (indicated by the dotted line). Data are depicted as mean ± SD. Biological replicates are indicated by individual dots. Statistical analyses were based on two-way ANOVA with Bonferroni’s post-test (a, c, d) or on two-tailed t test compared to untreated cells (e). *p < 0.05; **p < 0.01; ***p < 0.001 vs. -Cu (a, c, d) or other treatments such as -Zn, -Fe or -H2O2 (e), #p < 0.05; ##p < 0.01; ###p < 0.001 vs. 6 h; ++p < 0.01; +++p < 0.001 vs. -chelator. Source data are provided as a source Data file.
Fig. 3
Fig. 3. Copper effects on selenium homeostasis in LPP rats.
a Hepatic and (b, f) plasma Cu and (d, g) Se concentrations of female and male control rats (ATP7B+/−) and ATP7B−/− at different stages of Wilson’s disease (affected, disease onset, diseased) (n = 6–16) or (fh) 8 days after application of the Cu chelator methanobactin (n = 3–4) were measured using TXRF with 1 mg/L yttrium as standard element for 300 s and normalized to protein content or with 1 mg/L gallium as standard element for 1000 s, respectively. c The CP oxidase (CPO) activity in plasma of rats was measured photometrically. e, h Plasma SELENOP was analyzed by Western Blot and normalized to Ponceau (P) staining (n = 5–8). Data are depicted as mean ± SD. Biological replicates are indicated by individual dots. Statistical analyses were based on one-way ANOVA with Bonferroni’s post-test *p < 0.05; **p < 0.01; ***p < 0.001 vs. ATP7B+/- control rats (ae) or by two-tailed t test compared to untreated rats (fh). Source data are provided as a source Data file.
Fig. 4
Fig. 4. SELENOP concentrations are positively correlated with serum copper.
a Serum ceruloplasmin (CP) concentrations of Wilson’s patients at time point of diagnosis measured by ELISA. Serum CP oxidase (CPO) activity (b), total copper (c), free copper (d), SELENOP (e), and selenium (f) concentrations of Wilson’s patients measured using photometric activity, TXRF with 1 mg/L gallium as standard element for 1000 s or a fluorometric method (normal CP n = 8; low CP n = 11; diseased n = 4). Data are depicted as mean ± SD. Biological replicates are indicated by individual dots. Statistical analyses were based on one-way ANOVA with Bonferroni’s post-test. *p < 0.05; **p < 0.01; ***p < 0.001 vs. ‘normal CP’, #p < 0.05; ##p < 0.01 vs. ‘low CP. g Results from EPIC-Potsdam samples for SNP rs11708215 (coded per G allele) and its correlation with serum SELENOP from linear regression using an additive genetic model adjusted for age at recruitment and sex. Serum SELENOP levels were natural log-transformed and standardized. Source data are provided as a source Data file.
Fig. 5
Fig. 5. Copper modulates the HepG2 cell secretome.
a Volcano plot of proteins identified by secretome analysis in the medium of HepG2 cells cultured for 48 h in the presence of 50 nM selenite and with 0 or 100 µM CuSO4. Two-sided t-test-based statistics were applied on normalized and logarithmized protein ratios to extract the significantly regulated proteins. b Extracellular APOE of HepG2 cells co-cultured with Cu and Se for indicated time points. APOE was analyzed using dot blot and normalized to Ponceau (P) staining (n = 3). c Intracellular APOE in HepG2 cells treated with 0 or 100 µM CuSO4 without (-Se) or with 50 nM selenite for 72 h measured by Western Blot normalized to Ponceau staining (n = 4). An siRNA-mediated knockdown of APOE was generated and intracellular APOE (d) and extracellular SELENOP (e) were analyzed after 72 h treatment with selenite and/or Cu by Western Blot normalized to Ponceau staining (n = 4). Data are depicted as mean ± SD. Biological replicates are indicated by individual dots. Statistical analyses were based on two-way ANOVA with Bonferroni’s post-test (be). Adjustments for multiple comparisons were made for data provided in (a). *p < 0.05; **p < 0.01; ***p < 0.001 vs. -Cu; ++p < 0.01; +++p < 0.001 vs. siControl. Source data are provided as a source Data file.
Fig. 6
Fig. 6. Copper results in SELENOP accumulation in the Golgi.
Intracellular SELENOP (a, b) of HepG2 cells treated with 0 or 100 µM CuSO4 without (-Se) or with 50 nM selenite (+Se) for 72 h. In addition, 24 h prior to harvest brefeldin A (a) or monensin (b) were added. Samples were analyzed by Western Blot normalized to Ponceau staining. Orange boxes indicate fully glycosylated SELENOP. c, d Cell lysates of HepG2 cells treated with or without 50 nM selenite in combination with 0 or 100 µM CuSO4 for 72 h were incubated with PNGase F (c) or Endonuclease H (EndoH) (d) and intracellular SELENOP was determined using Western Blot. e Effects are depicted in a scheme as described in the text (TGN—trans golgi network). The figure was created with BioRender: https://app.biorender.com/. f SELENOP, APOE, GAPDH, and GOLGIN97 were analyzed in cytosolic or membrane/organelle fractions of cells treated with 50 nM selenite in combination with or without 100 µM CuSO4. Representative images are shown for all Western Blots. All experiments were repeated independently for at least three times with similar results. g Immunofluorescence for SELENOP (green), GOLGIN97 (violet) and DAPI (blue) was performed in HepG2 cells treated with or without 50 nM selenite in combination with 0 or 100 µM CuSO4 for 24 h. Representative images are shown. The scale bar indicates 10 µm. Experiments were repeated independently for at least three times with similar results. h The co-localization of SELENOP and GOLGIN97 was observed under +Se/+Cu conditions. Source data are provided as a source Data file.
Fig. 7
Fig. 7. Relationship between copper and selenium modulated by ceruloplasmin and SELENOP under different physiological and pathophysiological conditions.
Effects are depicted in a scheme as described in the text. The figure was created with BioRender: https://app.biorender.com/.

References

    1. Kryukov GV, et al. Characterization of mammalian selenoproteomes. Science. 2003;300:1439–1443. doi: 10.1126/science.1083516. - DOI - PubMed
    1. Schweizer U, et al. Hepatically derived selenoprotein P is a key factor for kidney but not for brain selenium supply. Biochem. J. 2005;386:221–226. doi: 10.1042/BJ20041973. - DOI - PMC - PubMed
    1. Renko K, et al. Hepatic selenoprotein P (SePP) expression restores selenium transport and prevents infertility and motor-incoordination in Sepp-knockout mice. Biochem. J. 2008;409:741–749. doi: 10.1042/BJ20071172. - DOI - PubMed
    1. Hill KE, et al. Production of selenoprotein P (Sepp1) by hepatocytes is central to selenium homeostasis. J. Biol. Chem. 2012;287:40414–40424. doi: 10.1074/jbc.M112.421404. - DOI - PMC - PubMed
    1. Hill KE, et al. Deletion of selenoprotein P alters distribution of selenium in the mouse. J. Biol. Chem. 2003;278:13640–13646. doi: 10.1074/jbc.M300755200. - DOI - PubMed

Publication types