. 2023 Sep;17(9):1369-1381.
doi: 10.1038/s41396-023-01451-8. Epub 2023 Jun 13.

Relation of pest insect-killing and soilborne pathogen-inhibition abilities to species diversification in environmental Pseudomonas protegens

Affiliations

Relation of pest insect-killing and soilborne pathogen-inhibition abilities to species diversification in environmental Pseudomonas protegens

Daniel Garrido-Sanz et al. ISME J. 2023 Sep.

Abstract

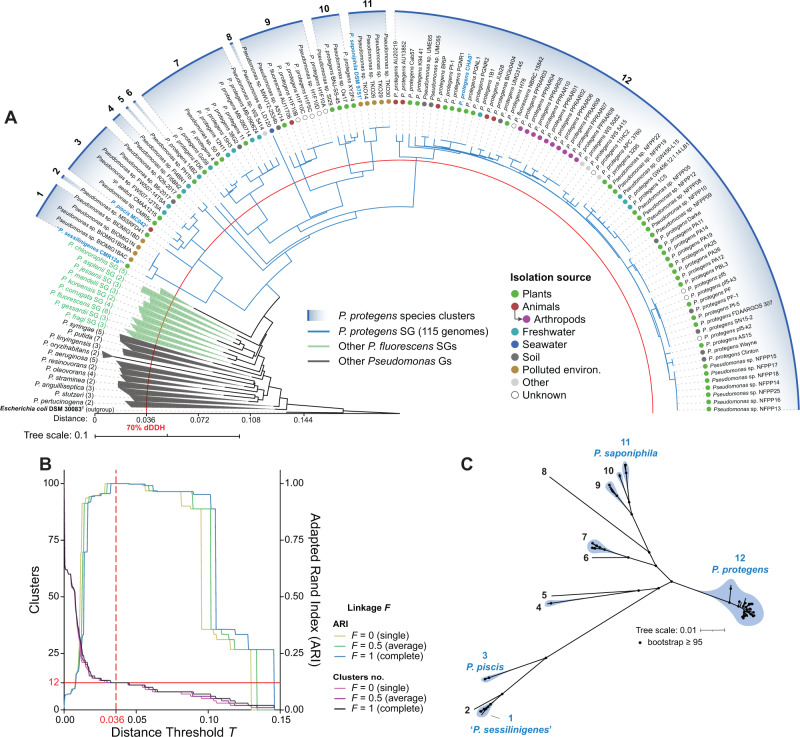
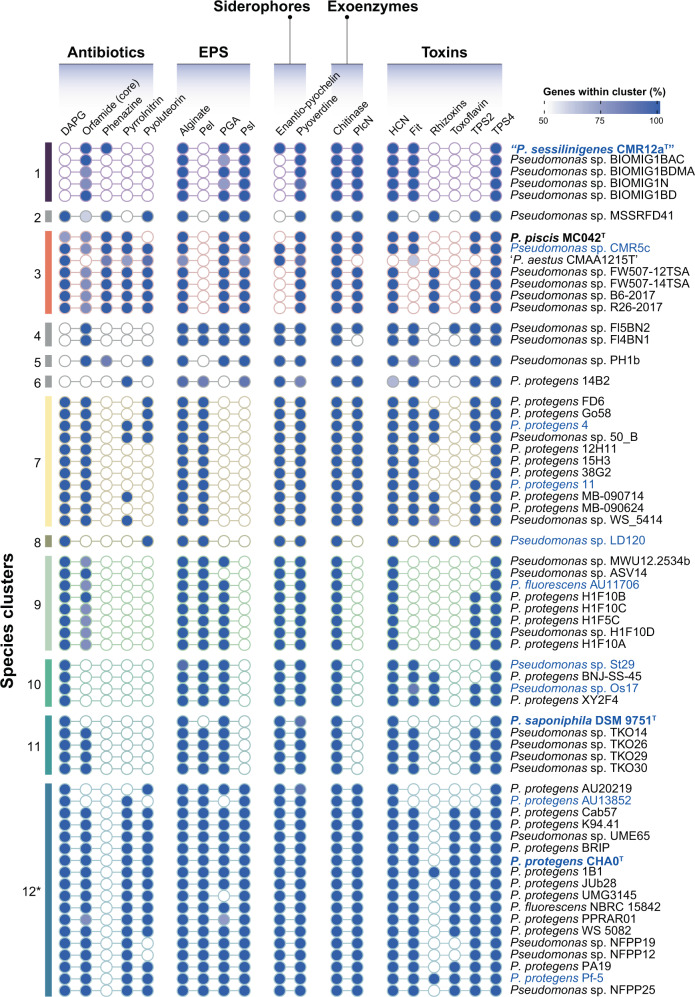
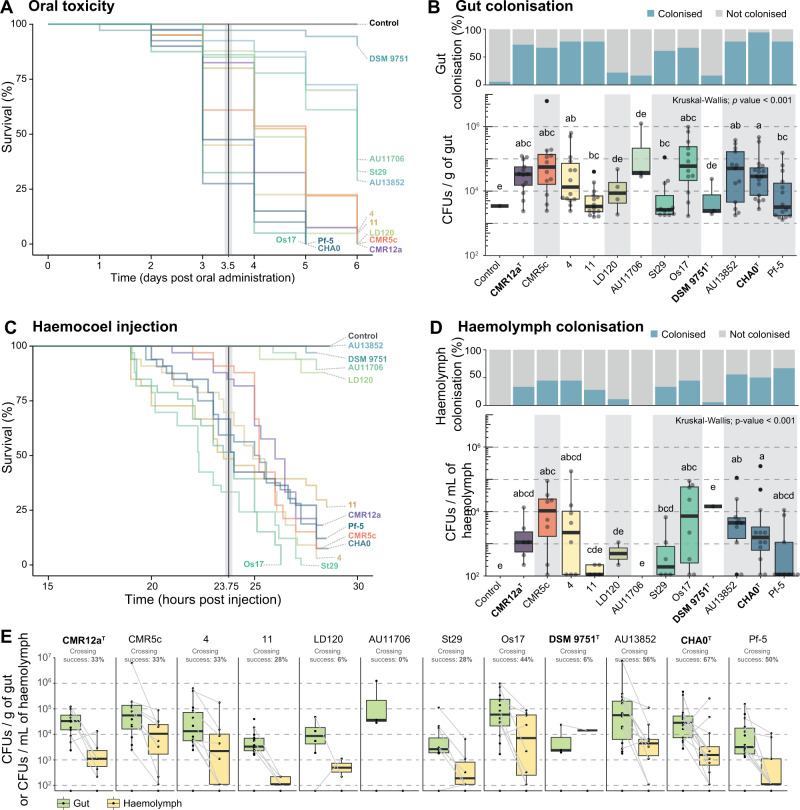
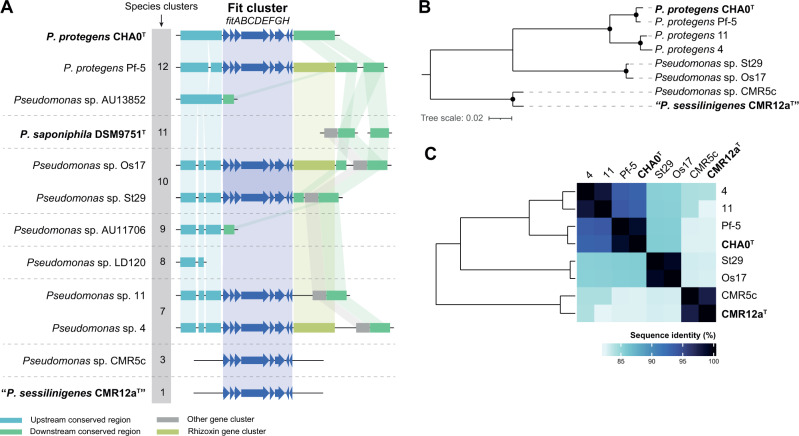
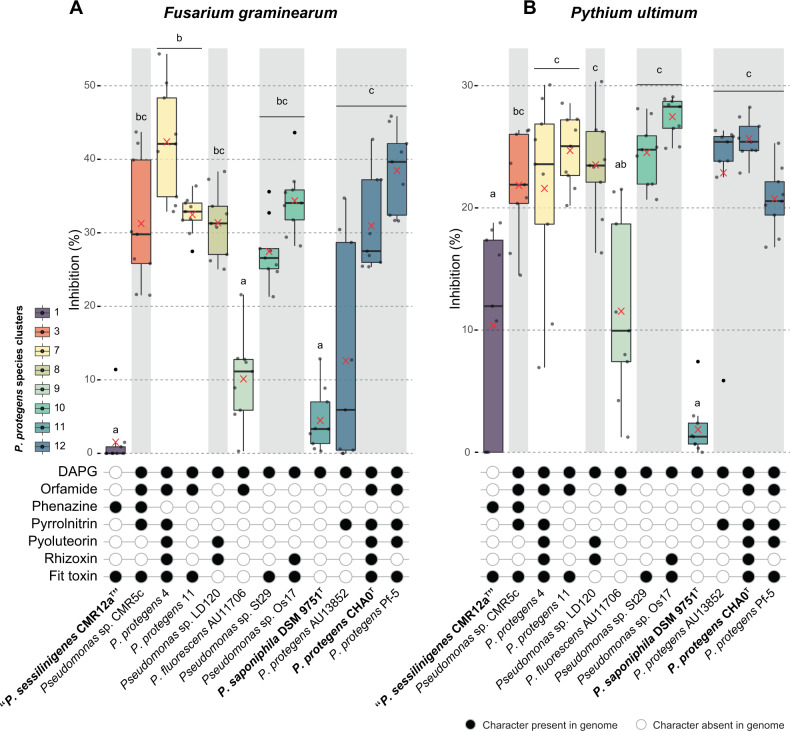
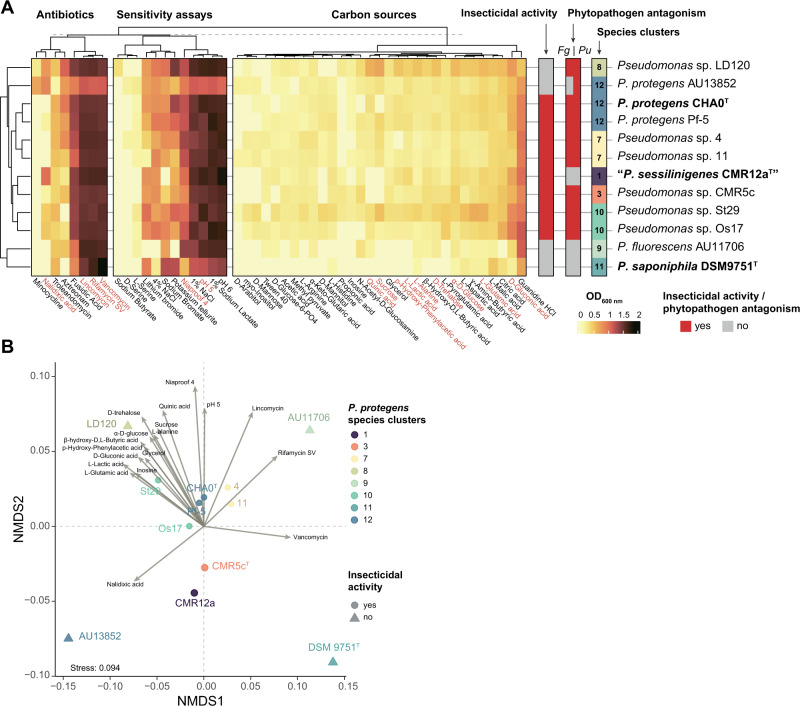
Strains belonging to the Pseudomonas protegens phylogenomic subgroup have long been known for their beneficial association with plant roots, notably antagonising soilborne phytopathogens. Interestingly, they can also infect and kill pest insects, emphasising their interest as biocontrol agents. In the present study, we used all available Pseudomonas genomes to reassess the phylogeny of this subgroup. Clustering analysis revealed the presence of 12 distinct species, many of which were previously unknown. The differences between these species also extend to the phenotypic level. Most of the species were able to antagonise two soilborne phytopathogens, Fusarium graminearum and Pythium ultimum, and to kill the plant pest insect Pieris brassicae in feeding and systemic infection assays. However, four strains failed to do so, likely as a consequence of adaptation to particular niches. The absence of the insecticidal Fit toxin explained the non-pathogenic behaviour of the four strains towards Pieris brassicae. Further analyses of the Fit toxin genomic island evidence that the loss of this toxin is related to non-insecticidal niche specialisation. This work expands the knowledge on the growing Pseudomonas protegens subgroup and suggests that loss of phytopathogen inhibition and pest insect killing abilities in some of these bacteria may be linked to species diversification processes involving adaptation to particular niches. Our work sheds light on the important ecological consequences of gain and loss dynamics for functions involved in pathogenic host interactions of environmental bacteria.


Conflict of interest statement

The authors declare no competing interests.

Figures

Fig. 1
Fig. 1. Phylogenomic analysis of the Pseudomonas protegens subgroup reveals twelve distinct species.
A Neighbour-joining phylogeny of intergenomic distances of genomes belonging to the P. protegens phylogenomic subgroup (SG, in blue) and other representative type strain genomes of the remaining SGs from the P. fluorescens species complex (green) and other Pseudomonas phylogenomic groups (Gs, in grey). Numbers are shown according to species clusters identified in this study. Names in blue, bold and T denote type strains. Numbers in parentheses denote the number of genomes included in SGs or Gs. The red line indicates a distance of 0.036, which equals a digital DNA-DNA hybridization (dDDH) of 70%. Coloured dots represent the isolation source according to the NCBI BioProject description. B Hierarchical clustering analysis at the species level (dDDH ≥ 70%). The dashed red line denotes the maximum Adapted Rand Index (ARI) achieved across different distance thresholds (T) and linkages (F) analysed. The solid red line indicates the number of clusters identified at the maximum ARI. C Maximum-likelihood phylogenetic tree based on 2266 core single-copy amino acid sequences identified in the P. protegens SG. Numbers according to species clusters. The tree scale represents the number of substitutions per site. Black dots indicate a bootstrap ≥95%.
Fig. 2
Fig. 2. The Pseudomonas protegens SG pangenome and functional genome analysis evidence distinct species-specific features.
Boxplots of the estimated sizes of the (A) core-genome, (B) pangenome and (C) genome-specific genome fractions represented as a function of the number of orthologous groups (OGs) identified over sequentially added genomes, using 100 replicates of randomly sampled genomes. Genome fractions per species cluster are included inside the panels: lines indicate mean values; shadows indicate standard deviations. Additional information can be found in Supplementary Table 6. D Non-metric multidimensional scaling (NMDS) of the relative abundances of BRITE KEGG functional categories annotated in P. protegens SG genomes. Genomes with more than 85 contigs were discarded. Arrows indicate fitted variables with a p value ≤ 0.05. Pairwise permutational multivariate analysis of variance (MANOVA) among P. protegens species clusters based on Bray-Curtis dissimilarities is listed in Supplementary Table 8.
Fig. 3
Fig. 3. Distribution of characters of interest in Pseudomonas protegens SG genomes.
The scale in blue shows the percentage of proteins within the protein cluster present in the strain. Only percentages ≥50% are considered as the presence of the character. Bold and T indicate type strain. The strains phenotypically characterised in this study are highlighted in blue. *Only 20 representative genomes of species #12 are shown. For detailed information, including specific proteins used for character description and their distribution in the 115 P. protegens SG genomes analysed in this study, refer to Supplementary Fig. 1.
Fig. 4
Fig. 4. Insecticidal activity of representative Pseudomonas protegens SG strains towards larvae of the pest insect Pieris brassicae.
A, B Kaplan-Meier survival plots of larvae of P. brassicae when exposed to the twelve P. protegens SG strains tested, either by oral administration or by haemocoel injection. The plots represent the likelihood that the insects survive through time following the administration of the different P. protegens strains. Statistical differences of the survival curves (Log-rank test; p value < 0.05) are shown in Supplementary Table 9. C, D Colonisation of the pest insect guts (C) or haemolymph (D) 24 h post feeding. The barplots represent the number of larvae colonised (blue) or not colonised (grey). The boxplots below show the number of CFUs per g of gut or per mL of haemolymph recovered. Statistically significant groups (p value < 0.05) are indicated with different letters based on Kruskal-Wallis with post hoc testing. E Paired boxplots and gut-haemolymph crossing success per strain. Strain names highlighted in bold correspond to type strains.
Fig. 5
Fig. 5. Analyses of the Fit toxin gene cluster in representative Pseudomonas protegens SG genomes.
A Synteny of the Fit toxin gene cluster (dark blue, at scale) and genetic context (not at scale) in the 12 P. protegens SG genomes phenotypically characterised. Conserved regions are represented as coloured rectangles. For detailed information, refer to the Supplementary Fig. 4. B Phylogenetic ML tree of the concatenated FitABCDEFGH amino acid sequences. Black dots represent bootstrap values equal to 100%. The scale represents the number of substitutions per site. C Heatmap of the entire fit gene cluster (nucleotide) representing sequence identity values obtained by blastn.
Fig. 6
Fig. 6. Inhibition of soilborne phytopathogens by Pseudomonas protegens SG strains.
Boxplot showing the percentage of inhibition of (A) Fusarium graminearum growing on potato dextrose agar (PDA) plates and (B) Pythium ultimum growing on malt agar (MA) plates calculated by comparing the phytopathogenic fungus or oomycete growth area in presence of the bacterial strain versus the control without bacteria. Colours are according to species clusters identified in this study. Mean values are indicated with a red cross. Statistical differences between species clusters were calculated using the Kruskal-Wallis rank sum test with Dunn’s post hoc correction. Differences between groups are shown with different letters (p value < 0.05; for additional information and detailed strain comparisons refer to Supplementary Table 11). The distribution of main antifungal characters detected in the genome of the 12 strains are reported below the boxplots. Strain names highlighted in bold correspond to type strains.
Fig. 7
Fig. 7. Phenotypic differences between the twelve representative Pseudomonas protegens SG strains.
A Heatmap and clustering analyses of the Biolog results. The Biolog data used to generate these results correspond to the carrying capacity (i.e., the maximum OD600 observed during the growth kinetic). Columns were split according to the three main phenotypic categories, i.e., antibiotic resistance, sensitivity assays and carbon sources usage. Categories written in red indicate those with a p value ≤ 0.05. B NMDS of Biolog GEN III performed in 12 representative genomes belonging to eight P. protegens SG species clusters and measured as growth expressed as OD600 nm values. Fitted variables with a p value ≤ 0.05 are represented as arrows. Insecticidal activity of the strains towards P. brassicae larvae in injection assays is indicated as circles (strain able to kill the insect) or triangles (strain uncapable of killing the insect). Fg: Fusarium graminearum, Pu: Pythium ultimum.

Similar articles

Cited by

References

    1. Haas D, Défago G. Biological control of soil-borne pathogens by fluorescent pseudomonads. Nat Rev Microbiol. 2005;3:307–19. doi: 10.1038/nrmicro1129. - DOI - PubMed
    1. Lugtenberg B, Kamilova F. Plant-growth-promoting rhizobacteria. Annu Rev Microbiol. 2009;63:541–56. doi: 10.1146/annurev.micro.62.081307.162918. - DOI - PubMed
    1. Garrido-Sanz D, Meier-Kolthoff JP, Göker M, Martín M, Rivilla R, Redondo-Nieto M. Genomic and genetic diversity within the Pseudomonas fluorescens complex. PLoS One. 2016;11:e0150183. doi: 10.1371/journal.pone.0150183. - DOI - PMC - PubMed
    1. Gomila M, Peña A, Mulet M, Lalucat J, García-Valdés E. Phylogenomics and systematics in Pseudomonas. Front Microbiol. 2015;6:214. doi: 10.3389/fmicb.2015.00214. - DOI - PMC - PubMed
    1. Lalucat J, Mulet M, Gomila M, García-Valdés E. Genomics in bacterial taxonomy: impact on the genus Pseudomonas. Genes. 2020;11:139. doi: 10.3390/genes11020139. - DOI - PMC - PubMed

Publication types

Supplementary concepts