. 2023 Jun 13;6(1):112.
doi: 10.1038/s41746-023-00857-0.

A generalizable deep learning regression model for automated glaucoma screening from fundus images

Affiliations

A generalizable deep learning regression model for automated glaucoma screening from fundus images

Ruben Hemelings et al. NPJ Digit Med. .

Abstract

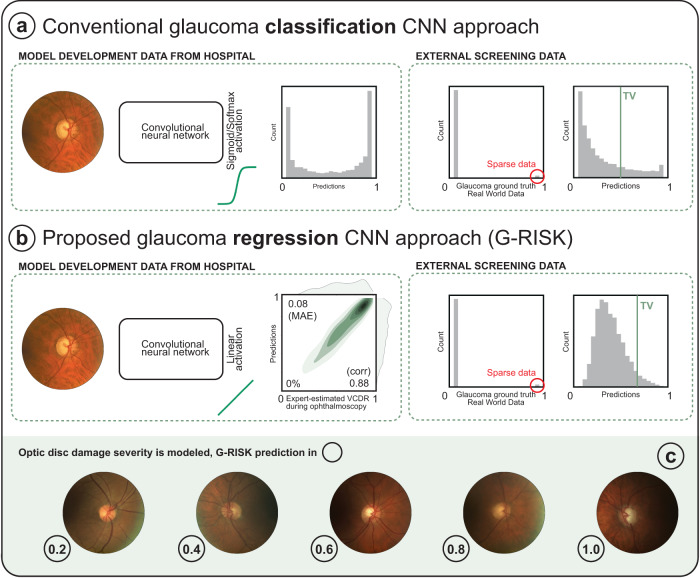
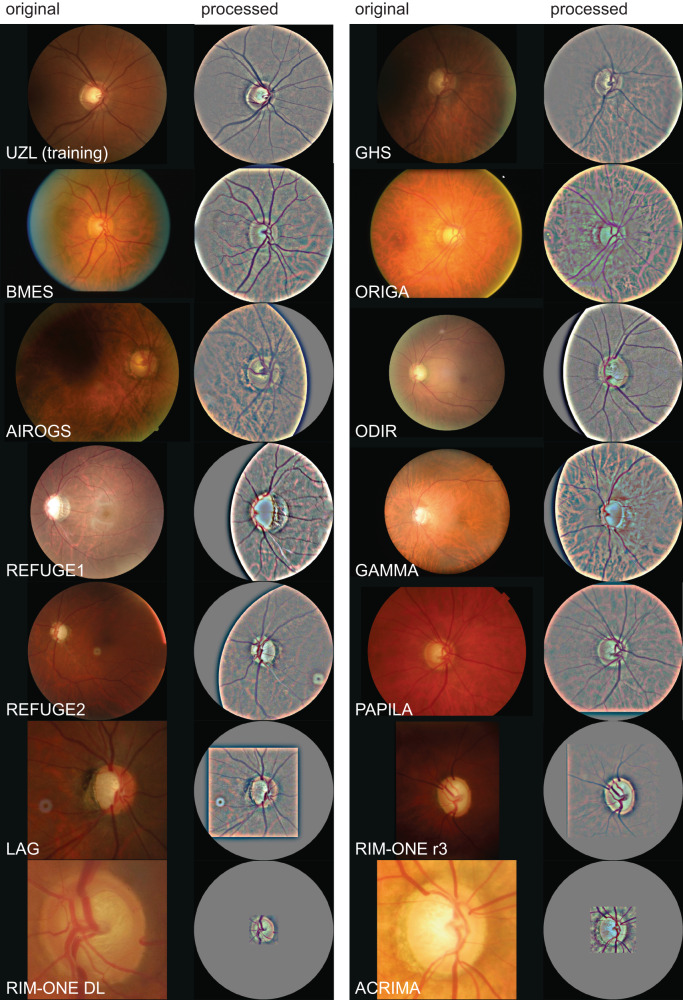
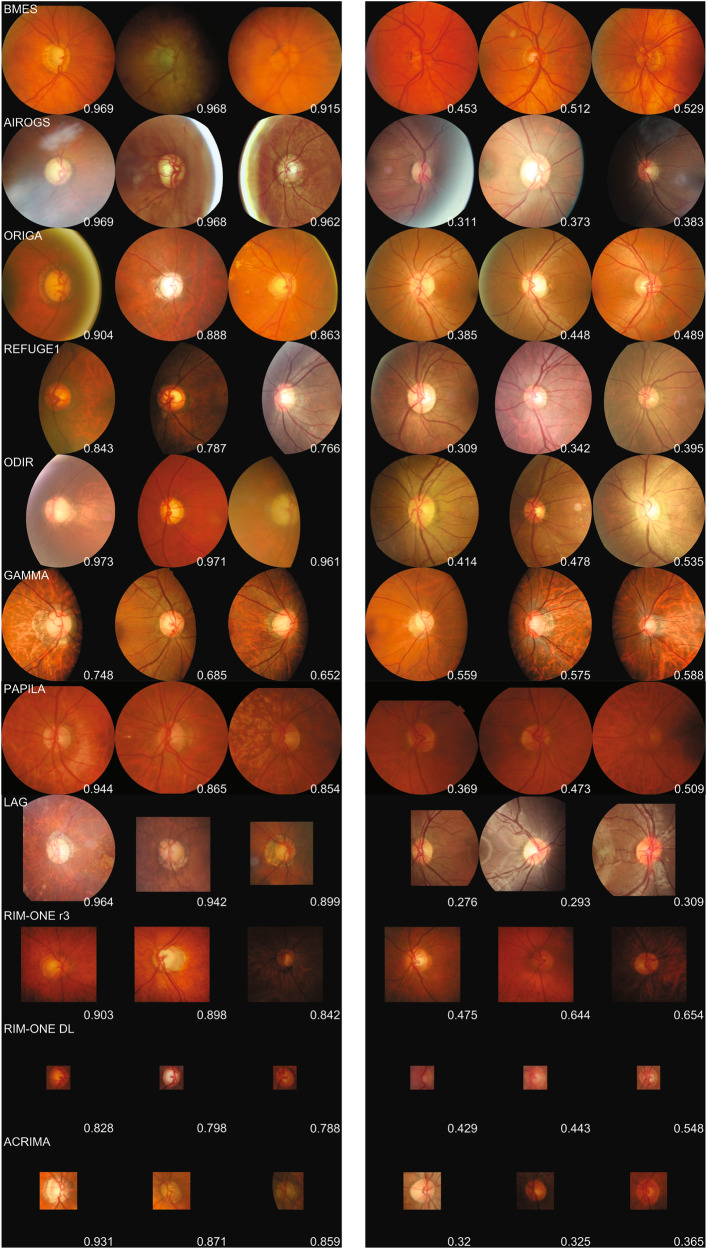
A plethora of classification models for the detection of glaucoma from fundus images have been proposed in recent years. Often trained with data from a single glaucoma clinic, they report impressive performance on internal test sets, but tend to struggle in generalizing to external sets. This performance drop can be attributed to data shifts in glaucoma prevalence, fundus camera, and the definition of glaucoma ground truth. In this study, we confirm that a previously described regression network for glaucoma referral (G-RISK) obtains excellent results in a variety of challenging settings. Thirteen different data sources of labeled fundus images were utilized. The data sources include two large population cohorts (Australian Blue Mountains Eye Study, BMES and German Gutenberg Health Study, GHS) and 11 publicly available datasets (AIROGS, ORIGA, REFUGE1, LAG, ODIR, REFUGE2, GAMMA, RIM-ONEr3, RIM-ONE DL, ACRIMA, PAPILA). To minimize data shifts in input data, a standardized image processing strategy was developed to obtain 30° disc-centered images from the original data. A total of 149,455 images were included for model testing. Area under the receiver operating characteristic curve (AUC) for BMES and GHS population cohorts were at 0.976 [95% CI: 0.967-0.986] and 0.984 [95% CI: 0.980-0.991] on participant level, respectively. At a fixed specificity of 95%, sensitivities were at 87.3% and 90.3%, respectively, surpassing the minimum criteria of 85% sensitivity recommended by Prevent Blindness America. AUC values on the eleven publicly available data sets ranged from 0.854 to 0.988. These results confirm the excellent generalizability of a glaucoma risk regression model trained with homogeneous data from a single tertiary referral center. Further validation using prospective cohort studies is warranted.


Conflict of interest statement

No outside entities have been involved in the study design, in the collection, analysis and interpretation of data, in the writing of the manuscript, nor in the decision to submit the manuscript for publication. I.S. is co-founder, shareholder, and consultant of Mona.health, a KU Leuven / VITO spin-off to which the described model was transferred. The study design was conceptualized in light of the PhD thesis of R.H., prior to the model transfer. Under their terms of employment at KU Leuven, R.H. and M.B.B. are entitled to stock options in Mona.health. R.H. has received consultancy fees from Mona.health.

Figures

Fig. 1
Fig. 1. Overview of the G-RISK regression approach versus conventional glaucoma detection CNNs that are trained with binary labels.
Both models were described in our previous work on explainable AI for glaucoma detection. The mismatch between the prevalence in a tertiary referral center (used for model development) and sparse real world data (external testing) leads to overprediction in the latter. The prediction histogram illustrates this phenomenon in the binary classification approach (a), with significantly more cases referred to as being glaucomatous than with G-RISK (b). Also note the spike in cases with prediction close to 1, versus a consistent decrease in cases as the prediction value increases for G-RISK. TV refers to the optimal threshold value. TV is typically fixed at 0.5 in binary classification models due to a sharp sigmoid/softmax activation function. In a regression approach with linear activation, TV can be set at a different value, depending on the costs associated with FP and FN. c Examples of fundus images with an increasing G-RISK score.
Fig. 2
Fig. 2. Examples of the training set and thirteen data sets used for external testing of G-RISK for generalizable glaucoma detection.
Each pair displays a randomly selected original unprocessed image that features glaucoma-induced damage (left) and the corresponding 30° disc-centered result after image manipulation (right), prepared for G-RISK input.
Fig. 3
Fig. 3. Combined ROC curve, calibration curve, and prediction histogram plots per data set that featured an available glaucoma ground truth.
The top plot area features (1) the ROC curve (light green) with false positive rate and true positive rate on the x and y axis, (2) as well as the calibration curve (dark green) with mean predicted value and the fraction of positives on the x and y axis. A diagonal dotted black line between (0,0) and (1,1) indicates the ROC curve of random prediction and optimal calibration. The vertically flipped histogram of G-RISK predictions is aligned with the calibration curve in the bottom plot, with prediction value on the x axis, and prediction count on the y axis. Best viewed in color.
Fig. 4
Fig. 4. Overview of top three most extreme false-positive cases (three first images from the left per row) and false-negative cases (three rightmost images per row) per evaluated data set (name printed in the left corner of the first image per row).
GHS data was left out as there exists no ground truth on image level. The predicted risk score is at the bottom right for each image. Best viewed in color and high resolution for optimal review by the reader. See Supplementary Fig. 3 for a view with overlaid saliency map.

References

    1. Tham Y-C, et al. Global prevalence of glaucoma and projections of glaucoma burden through 2040: a systematic review and meta-analysis. Ophthalmology. 2014;121:2081–2090. doi: 10.1016/j.ophtha.2014.05.013. - DOI - PubMed
    1. Mitchell P, Smith W, Attebo K, Healey PR. Prevalence of open-angle glaucoma in australia: the blue mountains eye study. Ophthalmology. 1996;103:1661–1669. doi: 10.1016/S0161-6420(96)30449-1. - DOI - PubMed
    1. Topouzis F, et al. Prevalence of open-angle glaucoma in Greece: the Thessaloniki Eye Study. Am. J. Ophthalmol. 2007;144:511–519. doi: 10.1016/j.ajo.2007.06.029. - DOI - PubMed
    1. Budenz DL, et al. Prevalence of glaucoma in an urban West African population: The tema eye survey. JAMA Ophthalmol. 2013;131:651–658. doi: 10.1001/jamaophthalmol.2013.1686. - DOI - PMC - PubMed
    1. Liang YB, et al. Prevalence of primary open angle glaucoma in a rural adult Chinese population: the Handan eye study. Invest. Ophthalmol. Vis. Sci. 2011;52:8250–8257. doi: 10.1167/iovs.11-7472. - DOI - PubMed