. 2023 Jun 13;11(1):131.
doi: 10.1186/s40168-022-01449-y.

RNA-based amplicon sequencing is ineffective in measuring metabolic activity in environmental microbial communities

Affiliations

RNA-based amplicon sequencing is ineffective in measuring metabolic activity in environmental microbial communities

Ya Wang et al. Microbiome. .

Abstract

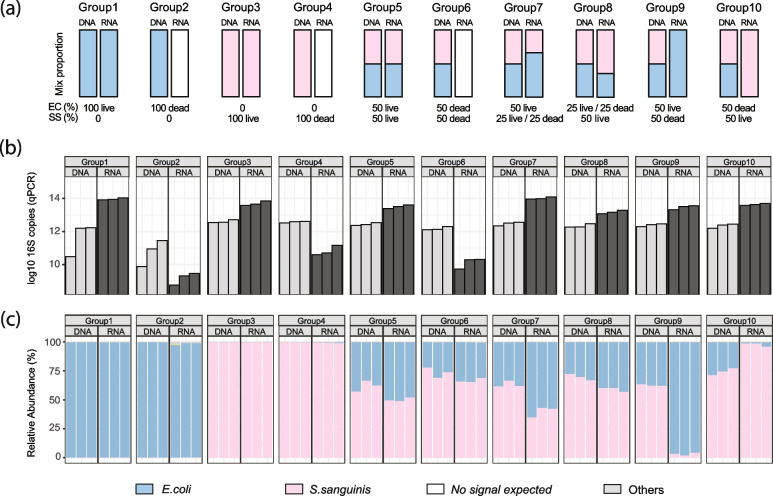
Background: Characterization of microbial activity is essential to the understanding of the basic biology of microbial communities, as the function of a microbiome is defined by its biochemically active ("viable") community members. Current sequence-based technologies can rarely differentiate microbial activity, due to their inability to distinguish live and dead sourced DNA. As a result, our understanding of microbial community structures and the potential mechanisms of transmission between humans and our surrounding environments remains incomplete. As a potential solution, 16S rRNA transcript-based amplicon sequencing (16S-RNA-seq) has been proposed as a reliable methodology to characterize the active components of a microbiome, but its efficacy has not been evaluated systematically. Here, we present our work to benchmark RNA-based amplicon sequencing for activity assessment in synthetic and environmentally sourced microbial communities.

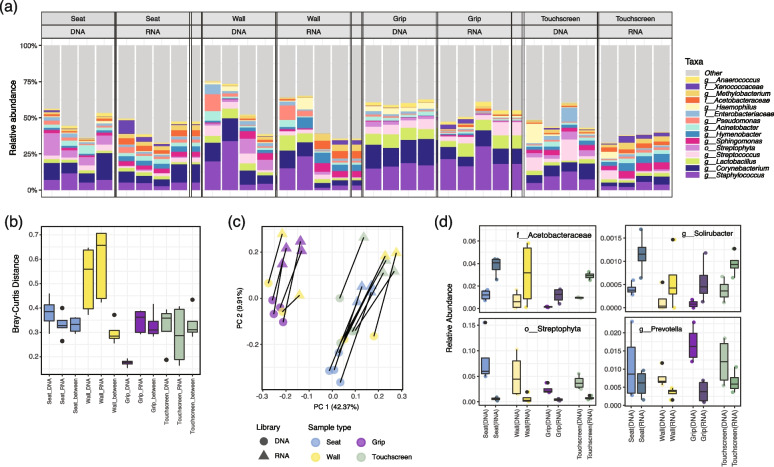
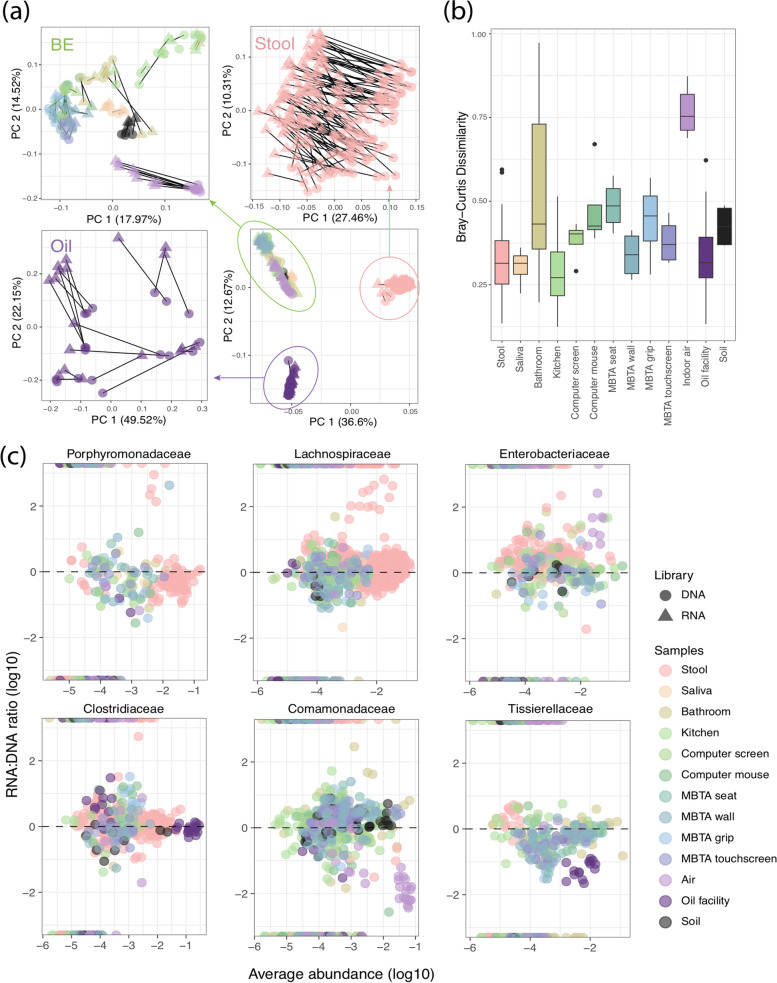
Results: In synthetic mixtures of living and heat-killed Escherichia coli and Streptococcus sanguinis, 16S-RNA-seq successfully reconstructed the active compositions of the communities. However, in the realistic environmental samples, no significant compositional differences were observed in RNA ("actively transcribed - active") vs. DNA ("whole" communities) spiked with E. coli controls, suggesting that this methodology is not appropriate for activity assessment in complex communities. The results were slightly different when validated in environmental samples of similar origins (i.e., from Boston subway systems), where samples were differentiated both by environment type as well as by library type, though compositional dissimilarities between DNA and RNA samples remained low (Bray-Curtis distance median: 0.34-0.49). To improve the interpretation of 16S-RNA-seq results, we compared our results with previous studies and found that 16S-RNA-seq suggests taxon-wise viability trends (i.e., specific taxa are universally more or less likely to be viable compared to others) in samples of similar origins.

Conclusions: This study provides a comprehensive evaluation of 16S-RNA-seq for viability assessment in synthetic and complex microbial communities. The results found that while 16S-RNA-seq was able to semi-quantify microbial viability in relatively simple communities, it only suggests a taxon-dependent "relative" viability in realistic communities. Video Abstract.

Keywords: 16S rRNA transcript-based amplicon sequencing; Built environment communities; Microbial community viability.


Conflict of interest statement

The authors declare that they have no competing interests.

Figures

Fig. 1
Fig. 1
16S-RNA-seq accurately quantifies microbe viability in simple synthetic communities. a Expected community structures of ten live/dead Escherichia coli and Streptococcus sanguinis mixtures in DNA and RNA libraries: group (1) 100% live E. coli (DNA library) and 100% E. coli expected in RNA library; (2) 100% dead E. coli (DNA) and 0% E. coli expected in RNA libraries; (3) 100% live S. sanguinis (DNA) and 100% S. sanguinis (RNA); (4) 100% dead S. sanguinis (DNA) and 0% S. sanguinis expected (RNA); (5) 50% live E. coli and 50% live S. sanguinis (DNA), same proportion expected in RNA libraries; (6) 50% dead E. coli and 50% dead S. sanguinis (DNA), no signal expected in RNA libraries; (7) 50% live E. coli, 25% live S. sanguinis, and 25% dead S. sanguinis (DNA) and 67% E. coli and 33% S. sanguinis (RNA); (8) 25% live E. coli and 25% dead E. coli, 50% live S. sanguinis (DNA), and 67% S. sanguinis and 33% E. coli (RNA); (9) 50% live E. coli, 50% dead S. sanguinis (DNA), and 100% E. coli (RNA); and (10) 50% dead E. coli and 50% live S. sanguinis (DNA) and 100% S. sanguinis (RNA). b 16S rRNA gene copy numbers detected from the DNA and RNA extractions from 10 synthetic cultures. c Relative abundances of synthetic community members by 16S-RNA-seq in DNA and RNA libraries. Each experiment had three biological replicates. As expected, the experimental results closely follow the predicted simple community composition, albeit small fluctuations in the relative abundance of the microbes
Fig. 2
Fig. 2
16S-RNA-seq was not able to differentiate active vs. whole microbiome in spiked realistic communities. Our second evaluation of 16S-RNA-seq used four environmental microbial community types (high and low biomass and high and low expected activity) spiked with varying levels of cultured/heat-killed E. coli. a Relative abundances of 15 taxa detected with the highest mean abundance across all samples with clear differences between sample types. Four biological replicates were taken for computer screens and mice and three biological replicates for saliva and soil. b Bray–Curtis dissimilarity within and between communities from DNA and RNA libraries indicated no significant differences between the RNA (cDNA) and DNA pairs (PERMANOVA R2: 2.3%, FDR q: 0.254). The RNA (cDNA) libraries showed the highest inter-replicate dissimilarity, followed by the DNA in most cases. Columns labeled with the “sample_DNA” (e.g., Screen_DNA) show dissimilarities within the indicated DNA libraries. Those annotated “type_RNA” (e.g., Screen_RNA) show calculations within the RNA libraries, and “type_between” (e.g., Screen_between) represents distances between paired samples in DNA vs. RNA libraries. c After constructing an ordination based on each sample’s pairwise Bray–Curtis dissimilarity, the dissimilarities were largely explained by sample types. With the screens and mice ordinating closest together, as expected. Lines connect identical samples in DNA and RNA libraries
Fig. 3
Fig. 3
16S-RNA-seq indicated subtle differentiation between DNA and RNA libraries in samples from the Boston (MBTA) subway system. a Relative abundances of the 15 taxa with the highest means across four sample types in DNA and RNA libraries indicated overall similar taxonomic compositions. Each column represents a biological replicate. b Bray–Curtis distance distributions between MBTA samples within/between DNA and RNA libraries. c Principal coordinate analysis (PCoA) of MBTA samples using Bray–Curtis distances. Sample type and library type are both drivers of overall community composition. d Four differentially abundant taxa that consistently enriched or depleted in RNA libraries across sample types. The Acetobacteraceae family and Solirubacter genus were consistently enriched in RNA libraries, while the Streptophyta order and the human commensal Prevotella genus were under quantified in RNA libraries (mixed-effects linear models, q-value = 0.002, 0.003, 0.002, and 0.012, respectively)
Fig. 4
Fig. 4
16S-RNA-seq indicated that some taxa may be more or less viable depending on the environment types. a PCoA analysis using Bray–Curtis dissimilarities among filtered OTUs. Sample type is the major contribution to the overall compositional dissimilarities (R2 = 64.3%, FDR q = 0.001), while library type also drives compositional change in samples of similar sources (R2 = 2.0%, FDR q = 0.001), suggesting that 16S-RNA-seq provides some differentiation between DNA vs. RNA libraries in similar samples. b Bray–Curtis distance distributions within/between DNA and RNA libraries. Generally, BE samples tend to have higher dissimilarity; indoor air samples differ most between DNA and RNA libraries. c RNA/DNA relative abundance ratios of genus in Porphyromonadaceae, Lachnospiraceae, Enterobacteriaceae, Clostridiaceae, Comamonadaceae, and Tissierellaceae. Overall trends of “relative activity” were suggested in these families by 16S-RNA-seq

References

    1. Emerson JB, Adams RI, Roman CMB, Brooks B, Coil DA, Dahlhausen K, et al. Schrodinger’s microbes: tools for distinguishing the living from the dead in microbial ecosystems. Microbiome. 2017;5(1):86. doi: 10.1186/s40168-017-0285-3. - DOI - PMC - PubMed
    1. Carini P, Marsden PJ, Leff JW, Morgan EE, Strickland MS, Fierer N. Relic DNA is abundant in soil and obscures estimates of soil microbial diversity. Nat Microbiol. 2016;2:16242. doi: 10.1038/nmicrobiol.2016.242. - DOI - PubMed
    1. Nielsen KM, Johnsen PJ, Bensasson D, Daffonchio D. Release and persistence of extracellular DNA in the environment. Environ Biosafety Res. 2007;6(1–2):37–53. doi: 10.1051/ebr:2007031. - DOI - PubMed
    1. Leung MH, Lee PK. The roles of the outdoors and occupants in contributing to a potential pan-microbiome of the built environment: a review. Microbiome. 2016;4(1):21. doi: 10.1186/s40168-016-0165-2. - DOI - PMC - PubMed
    1. Chirca I. The hospital environment and its microbial burden: challenges and solutions. Future Medicine. 2019;14:1007–10. - PubMed

Publication types

Substances