

Changes in the expression of cancer- and metastasis-related genes and proteins after metformin treatment under different metabolic conditions in endometrial cancer cells
- PMID: 37313172
- PMCID: PMC10258389
- DOI: 10.1016/j.heliyon.2023.e16678
Changes in the expression of cancer- and metastasis-related genes and proteins after metformin treatment under different metabolic conditions in endometrial cancer cells
Abstract
Research question: Hyperinsulinemia and elevated estrogen levels are known risk factors for endometrial cancer (EC) development and are associated with obesity, type 2 diabetes mellitus (T2DM), insulin resistance, among others. Metformin, an insulin-sensitizing drug, displays anti-tumor effects in cancer patients, including EC, but the mechanism of action is still not completely understood. In the present study, the effects of metformin on gene and protein expression were investigated in pre- and postmenopausal EC in vitro models in order to identify candidates that are potentially involved in the drug's anti-cancer mechanism.
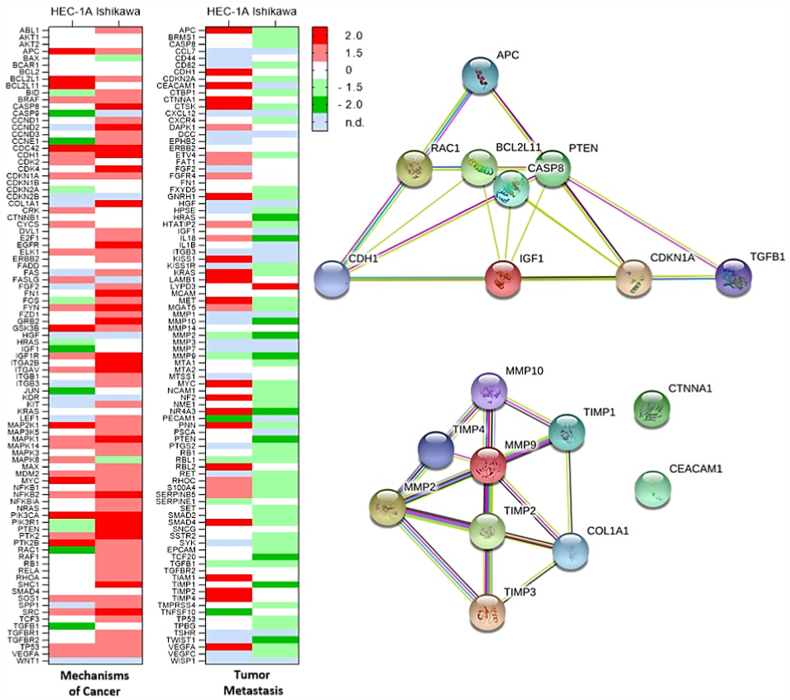
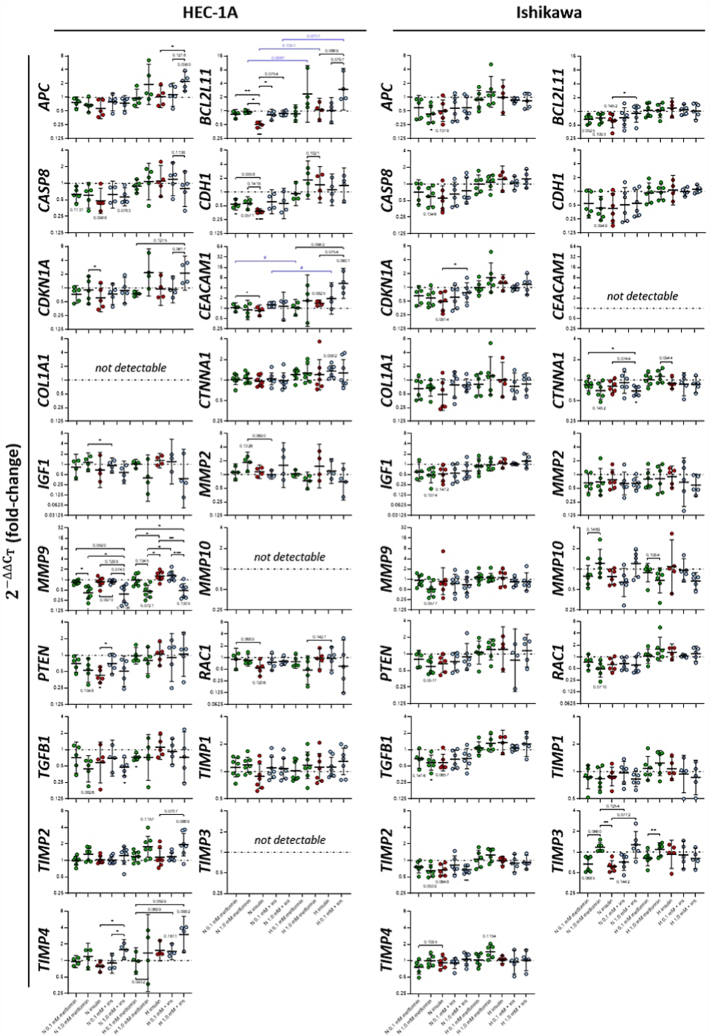
Design: After treating the cells with metformin (0.1 and 1.0 mmol/L), changes in the expression of >160 cancer- and metastasis-related gene transcripts were evaluated with RNA arrays. A total of 19 genes and 7 proteins were selected for a follow-up expression analysis, including further treatment conditions, in order to evaluate the influence of hyperinsulinemia and hyperglycemia on metformin-induced effects.
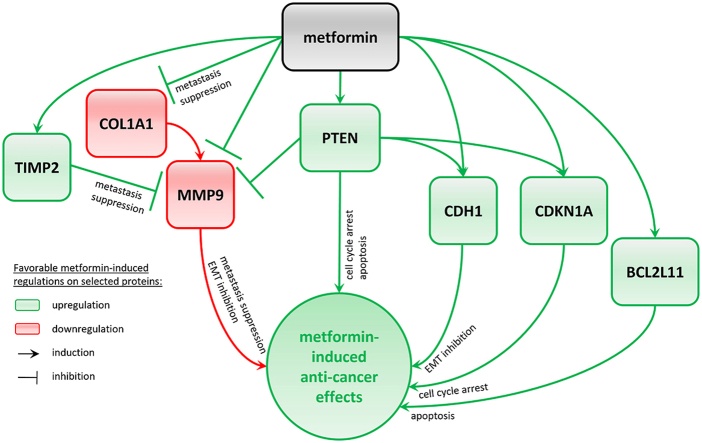
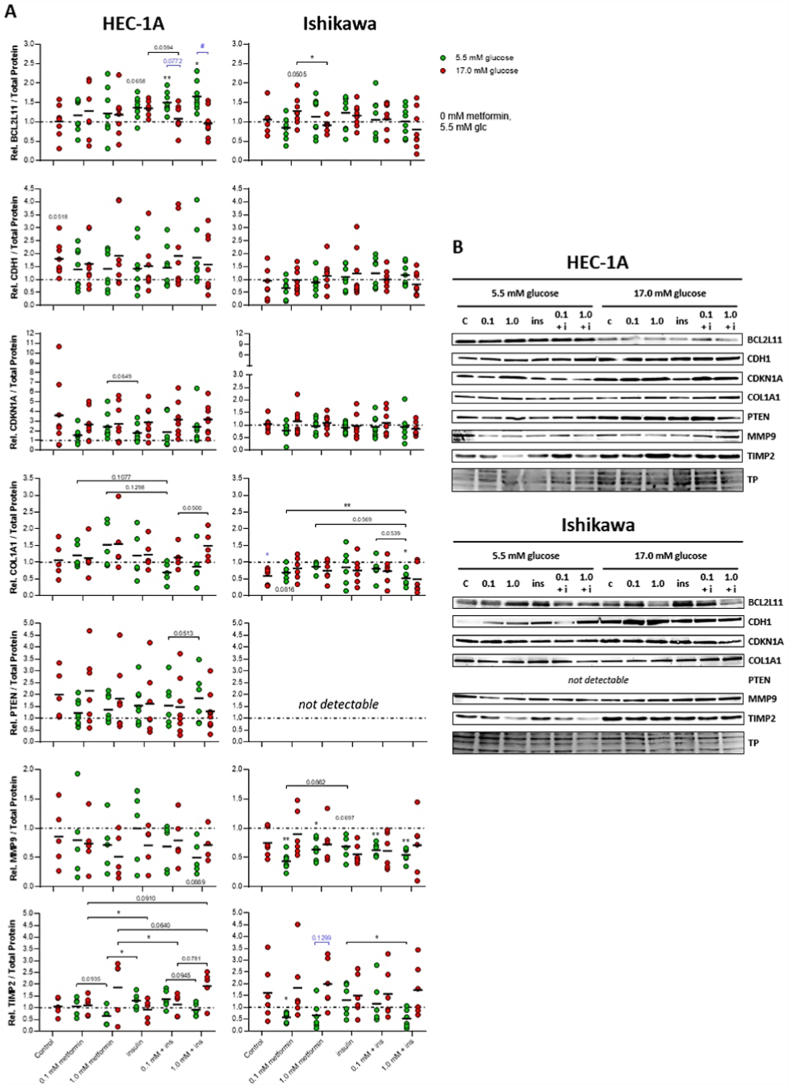
Results: Changes in the expression of BCL2L11, CDH1, CDKN1A, COL1A1, PTEN, MMP9 and TIMP2 were analyzed on gene and protein level. The consequences resulting from the detected expression changes as well as the influence of varying environmental influences are discussed in detail. With the presented data, we contribute to a better understanding of the direct anti-cancer activity of metformin as well as its underlying mechanism of action in EC cells.
Conclusions: Although further research will be necessary to confirm the data, the influence of different environmental settings on metformin-induced effects could be highlighted with the presented data. Additionally, gene and protein regulation were not similar in the pre- and postmenopausal in vitro models.
Keywords: Endometrial cancer; Hyperglycemia; Hyperinsulinemia; Metformin.
© 2023 The Authors.
Conflict of interest statement
The authors declare that they have no known competing financial interests or personal relationships that could have appeared to influence the work reported in this paper.
Figures
Similar articles
-
Changes in protein expression due to metformin treatment and hyperinsulinemia in a human endometrial cancer cell line.PLoS One. 2021 Mar 9;16(3):e0248103. doi: 10.1371/journal.pone.0248103. eCollection 2021. PLoS One. 2021. PMID: 33690729 Free PMC article.
-
[Molecular action of insulin-sensitizing agents].Endokrynol Pol. 2005 May-Jun;56(3):308-13. Endokrynol Pol. 2005. PMID: 16350724 Review. Polish.
-
Chemopreventive effects of metformin on obesity-associated endometrial proliferation.Am J Obstet Gynecol. 2013 Jul;209(1):24.e1-24.e12. doi: 10.1016/j.ajog.2013.03.008. Epub 2013 Mar 15. Am J Obstet Gynecol. 2013. PMID: 23500454 Free PMC article.
-
Metformin augments the levels of molecules that regulate the expression of the insulin-dependent glucose transporter GLUT4 in the endometria of hyperinsulinemic PCOS patients.Hum Reprod. 2013 Aug;28(8):2235-44. doi: 10.1093/humrep/det116. Epub 2013 Apr 17. Hum Reprod. 2013. PMID: 23595973
-
Diabetes mellitus and endometrial carcinoma: Risk factors and etiological links.Medicine (Baltimore). 2022 Aug 26;101(34):e30299. doi: 10.1097/MD.0000000000030299. Medicine (Baltimore). 2022. PMID: 36042597 Free PMC article. Review.
References
LinkOut - more resources
Full Text Sources
Research Materials
Miscellaneous
