. 2023 May 26:31:100516.
doi: 10.1016/j.pacs.2023.100516. eCollection 2023 Jun.

Homogeneous-resolution photoacoustic microscopy for ultrawide field-of-view neurovascular imaging in Alzheimer's disease

Affiliations

Homogeneous-resolution photoacoustic microscopy for ultrawide field-of-view neurovascular imaging in Alzheimer's disease

Ting Guo et al. Photoacoustics. .

Abstract

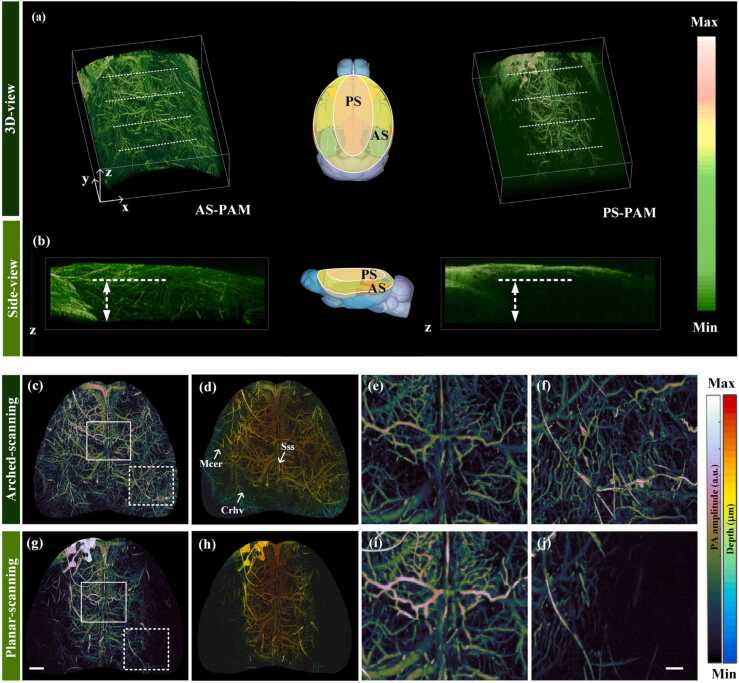
Neurovascular imaging is essential for investigating neurodegenerative diseases. However, the existing neurovascular imaging technology suffers from a trade-off between a field of view (FOV) and resolution in the whole brain, resulting in an inhomogeneous resolution and lack of information. Here, homogeneous-resolution arched-scanning photoacoustic microscopy (AS-PAM), which has an ultrawide FOV to cover the entire mouse cerebral cortex, was developed. Imaging of the neurovasculature was performed with a homogenous resolution of 6.9 µm from the superior sagittal sinus to the middle cerebral artery and caudal rhinal vein in an FOV of 12 × 12 mm2. Moreover, using AS-PAM, vascular features of the meninges and cortex were quantified in early Alzheimer's disease (AD) and wild-type (WT) mice. The results demonstrated high sensitivity to the pathological progression of AD on tortuosity and branch index. The high-fidelity imaging capability in large FOV enables AS-PAM to be a promising tool for precise brain neurovascular visualization and quantification.

Keywords: Alzheimer’s disease; Homogenous resolution; Large FOV; Neurovascular imaging; Photoacoustic microscopy.


Conflict of interest statement

The authors declare that they have no known competing financial interests or personal relationships that could have appeared to influence the work reported in this paper.

Figures

Fig. 1
Fig. 1
AS-PAM system. (a) Schematic diagram of the system. VCM, voice coil motor; LM, linear motor; CS, cantilever structure; L1, lens 1; L2, lens 2; PD, photodiode. (b) Schematic diagram of the scanning and the close-up schematic of the optical path integrated into the cantilever structure. CL, collimating lens; FL, focus lens; UT, ultrasonic transducer. (c) FOV of the system and scanning angle. (d) Measured and fitted edge spread function (ESF) and derived line spread function (LSF). (e) Acoustic axial resolution.
Fig. 2
Fig. 2
Phantom imaging of arched scanning and planar scanning. (a) Schematic diagram of the focus trajectories. (b) Schematic diagram of blade arrangement. (c) The PA images of the blade. (d) Measured and fitted edge spread function (ESF) and derived line spread function (LSF) of arched-scanning imaging. (e) Measured and fitted edge spread function (ESF) and derived line spread function (LSF) of planar scanning. Scale bar in (c), 0.5 mm.
Fig. 3
Fig. 3
Comparisons between arched-scanning imaging and planar-scanning imaging. (a) 3D image of mouse brain vasculature and the model map. (b) Side view of the 3D brain image in (a). (c) and (g) Maximum amplitude projection (MAP) from arched-scanning and planar-scanning. (d)and (h) The color-coded depth microvasculature image of the mouse brain vasculature over the entire cortex. Sss, superior sagittal sinus, Mcer, middle cerebral artery, Crhv, caudal rhinal vein . (e) and (i) Close-up images of the solid box region in (c) and (g), showing the vascular details of the center area. (f) and (j) Close-up images of the dashed box region in (c) and (g), showing the vascular details of the lateral area. Scale bar in (g), 1 mm and scale bar in (j), 300 µm.
Fig. 4
Fig. 4
Data analysis and quantification. (a) Elevation variation of the brain contour in the sagittal plane. (b) Focal deviation statistics of arched-scanning and planar-scanning at different positions. 1, 2, 3, and 4 correspond to Fig. 3(a). (c-d) Vessel density and vessel length of the central and lateral regions in the MAP of Fig. 3(c) and (f).
Fig. 5
Fig. 5
AS-PAM brain imaging at different weeks of ages. (a-f) AS-PAM images of the mice’s brains at weeks 2, 4, 6, 8, 10, and 12. (g) Effective area ratio for mouse brain imaging. (h) The distance of the signal position from the focus position in coronal brain images of mice at different weeks of age. Scale bar, 1 mm.
Fig. 6
Fig. 6
Imaging and quantization of AD model mice and WT mice at different periods. (a, b) PA imaging and close-up images of AD model mice and WT mice. The numbers represent the sample number. (c) Statistics of the proportion of different vessel diameters in (a, b). (d-g) Comparison of plaque density, vessel density, branch index and tortuosity. AD, n = 3 for all age groups; WT, n = 3 for all age groups, Scale bar in (b), 1 mm.

References

    1. C.Y. Santos, P.J. Snyder, W.-C. Wu, M. Zhang, A. Echeverria, J. Alber, Alzheimer’s & Dementia: Diagnosis, Assessment & Disease Monitoring 2017, 7 69. - PubMed
    1. Sweeney M.D., Kisler K., Montagne A., Toga A.W., Zlokovic B.V. Nat. Neurosci. 2018;21(10):1318. - PMC - PubMed
    1. Nasiriavanaki M., Xia J., Wan H., Bauer A.Q., Culver J.P., Wang L.V. Proc. Natl. Acad. Sci. 2014;111(1):21. - PMC - PubMed
    1. Sweeney M.D., Montagne A., Sagare A.P., Nation D.A., Schneider L.S., Chui H.C., Harrington M.G., Pa J., Law M., Wang D.J. Alzheimer’s Dement. 2019;15(1):158. - PubMed
    1. Ding R., Hase Y., Ameen-Ali K.E., Ndung’u M., Stevenson W., Barsby J., Gourlay R., Akinyemi T., Akinyemi R., Uemura M.T., et al. Brain Pathol. 2020;30(6):1087. - PMC - PubMed