. 2023 May 29:14:1158905.
doi: 10.3389/fimmu.2023.1158905. eCollection 2023.

Machine learning analysis of humoral and cellular responses to SARS-CoV-2 infection in young adults

Affiliations

Machine learning analysis of humoral and cellular responses to SARS-CoV-2 infection in young adults

Ricards Marcinkevics et al. Front Immunol. .

Abstract

The severe acute respiratory syndrome coronavirus 2 (SARS-CoV-2) induces B and T cell responses, contributing to virus neutralization. In a cohort of 2,911 young adults, we identified 65 individuals who had an asymptomatic or mildly symptomatic SARS-CoV-2 infection and characterized their humoral and T cell responses to the Spike (S), Nucleocapsid (N) and Membrane (M) proteins. We found that previous infection induced CD4 T cells that vigorously responded to pools of peptides derived from the S and N proteins. By using statistical and machine learning models, we observed that the T cell response highly correlated with a compound titer of antibodies against the Receptor Binding Domain (RBD), S and N. However, while serum antibodies decayed over time, the cellular phenotype of these individuals remained stable over four months. Our computational analysis demonstrates that in young adults, asymptomatic and paucisymptomatic SARS-CoV-2 infections can induce robust and long-lasting CD4 T cell responses that exhibit slower decays than antibody titers. These observations imply that next-generation COVID-19 vaccines should be designed to induce stronger cellular responses to sustain the generation of potent neutralizing antibodies.

Keywords: SARS-CoV-2; T cell response; antibody titers; machine learning; neutralizing antibodies.


Conflict of interest statement

CD, MSc, BS, PZ, FH, AR, Y-JH, GL, and HB are employees of Miltenyi Biotec B.V. & Co. KG. LP is an employee of Humabs BioMed SA, a subsidiary of Vir Biotechnology. The remaining authors declare that the research was conducted in the absence of any commercial or financial relationships that could be construed as a potential conflict of interest.

Figures

Figure 1
Figure 1
Study overview. The CoV-ETH study was launched in May 2020 and comprised of 2,911 individuals without previous knowledge on SARS-CoV-2 immune state. A serological screening assessed 65 seroconverted individuals at the first screening in May 2020. From these and 69 randomly chosen non-seroconverted negative controls, blood samples from May and September 2020 were analyzed for humoral and T cell response. As positive and negative controls, 56 samples from 36 PCR-confirmed hospitalized SARS-CoV-2 infected individuals and pre-pandemic samples from 56 healthy individuals were used, respectively.
Figure 2
Figure 2
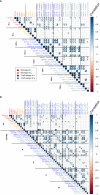
Correlation analyses relating to the assessed humoral and cellular parameters at time points t1 and t2 relating to (A) CD3, CD4 and CD8 T cells and a detailed analysis of (B) the different stimulating peptides in CD4 T cells. Text color indicates serology and T cell assay measurements at t1 and t2. The magnitude of correlation coefficients is indicated by the color bar to the right. Statistically non-significant correlations are not displayed (t-test at significance level α=0.05). Correlation test p-values were adjusted for multiple comparisons using the Benjamini-Hochberg method.
Figure 3
Figure 3
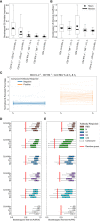
Results of applying logistic regression (LR) and gradient boosting (GB) to relate T cell and antibody responses. (A, B) Variable importance values for the top 5 most relevant predictors in the (A) GB and (B) LR models, trained on T cell percentages. Box plots were obtained by resampling the dataset 1,000 times with replacement. We attribute large variations in importance and coefficient values to the small sample size and correlations among features. (C) Changes in the normalized and standardized percentage of CD4 IL-2+/CD154+ T cells stimulated with CoV-Mix at t1 and t2. Participants with negative and positive compound antibody responses can be differentiated quite well based on this measurement alone. (D, E) Test-set bootstrapped areas under (D) receiver operating characteristic (AUROC) and (E) precision-recall (AUPRC) curves of GB models predicting various antibody responses based on different treatments. For reference, we plotted the expected performance of a random guess in red.
Figure 4
Figure 4
Boxplots of normalized and standardized T cell percentages against the compound symptoms score across two time points (by taking the maximum score) for (A, B) CD4 IL-2+/CD154+ and (C, D) CD4 IFN-γ+/TNF+ T cells, which were previously found to be important predictors of the compound antibody response. Herein, symptoms scores were reported as 0 for subjects without symptoms, 1 for subjects with any one or several symptoms but no fever, and 2 for subjects with fever alone or with any other symptoms. A compound symptoms score was assessed across t1 and t2 by taking the maximum of the two scores for each participant.

References

    1. Quinti I, Lougaris V, Milito C, Cinetto F, Pecoraro A, Mezzaroma I, et al. . A possible role for b cells in COVID-19? lesson from patients with agammaglobulinemia. J Allergy Clin Immunol (2020) 146:211–213.e4. doi: 10.1016/j.jaci.2020.04.013 - DOI - PMC - PubMed
    1. Ponsford MJ, Shillitoe BMJ, Humphreys IR, Gennery AR, Jolles S. COVID-19 and X-linked agammaglobulinemia (XLA) - insights from a monogenic antibody deficiency. Curr Opin Allergy Clin Immunol (2021) 21:525–34. doi: 10.1097/ACI.0000000000000792 - DOI - PubMed
    1. Van Assen S, Holvast A, Benne CA, Posthumus MD, Van Leeuwen MA, Voskuyl AE, et al. . Humoral responses after influenza vaccination are severely reduced in patients with rheumatoid arthritis treated with rituximab. Arthritis Rheumatism (2010) 62:75–81. doi: 10.1002/art.25033 - DOI - PubMed
    1. Eisenberg RA, Jawad AF, Boyer J, Maurer K, McDonald K, Prak ETL, et al. . Rituximab-treated patients have a poor response to influenza vaccination. J Clin Immunol (2013) 33:388–96. doi: 10.1007/s10875-012-9813-x - DOI - PMC - PubMed
    1. Rydyznski Moderbacher C, Ramirez SI, Dan JM, Grifoni A, Hastie KM, Weiskopf D, et al. . Antigen-specific adaptive immunity to SARS-CoV-2 in acute COVID-19 and associations with age and disease severity. Cell (2020) 183:996–1012.e19. doi: 10.1016/j.cell.2020.09.038 - DOI - PMC - PubMed

Publication types