Body water percentage from childhood to old age
- PMID: 37313612
- PMCID: PMC10265208
- DOI: 10.23876/j.krcp.22.062
Body water percentage from childhood to old age
Abstract
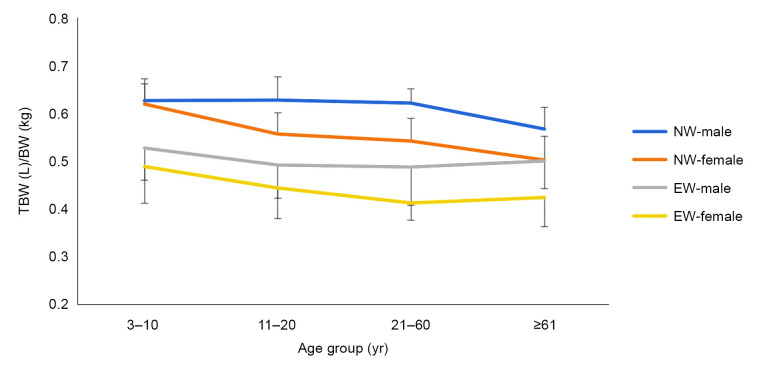
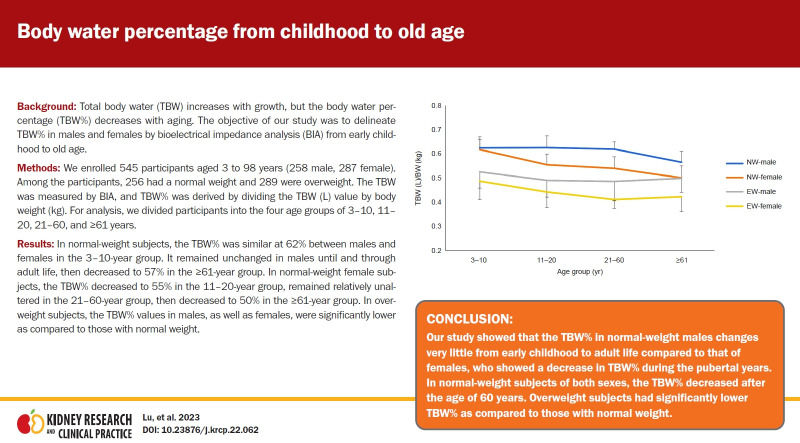
Background: Total body water (TBW) increases with growth, but the body water percentage (TBW%) decreases with aging. The objective of our study was to delineate TBW% in males and females by bioelectrical impedance analysis (BIA) from early childhood to old age.
Methods: We enrolled 545 participants aged 3 to 98 years (258 male, 287 female). Among the participants, 256 had a normal weight and 289 were overweight. The TBW was measured by BIA, and TBW% was derived by dividing the TBW (L) value by body weight (kg). For analysis, we divided participants into the four age groups of 3-10, 11-20, 21-60, and ≥61 years.
Results: In normal-weight subjects, the TBW% was similar at 62% between males and females in the 3-10-year group. It remained unchanged in males until and through adult life, then decreased to 57% in the ≥61-year group. In normal-weight female subjects, the TBW% decreased to 55% in the 11-20-year group, remained relatively unaltered in the 21-60-year group, then decreased to 50% in the ≥61-year group. In overweight subjects, the TBW% values in males, as well as females, were significantly lower as compared to those with normal weight.
Conclusion: Our study showed that the TBW% in normal-weight males changes very little from early childhood to adult life compared to that of females, who showed a decrease in TBW% during the pubertal years. In normal-weight subjects of both sexes, the TBW% decreased after the age of 60 years. Overweight subjects had significantly lower TBW% as compared to those with normal weight.
Keywords: Aged; All ages; Bioelectrical impedance analysis; Body water; Child; Obesity.
Conflict of interest statement
All authors have no conflicts of interest to declare.
Figures
Similar articles
-
A new prediction model for total body water estimation by BIA in children with normal and excessive weight.Clin Nutr ESPEN. 2023 Feb;53:53-59. doi: 10.1016/j.clnesp.2022.11.014. Epub 2022 Nov 26. Clin Nutr ESPEN. 2023. PMID: 36657930
-
Assessment of body composition using dry mass index and ratio of total body water to estimated volume based on bioelectrical impedance analysis in chronic kidney disease patients.J Ren Nutr. 2013 Jan;23(1):28-36. doi: 10.1053/j.jrn.2011.12.006. Epub 2012 Mar 9. J Ren Nutr. 2013. PMID: 22406124
-
Body composition in 5-18-y-old obese children and adolescents before and after weight reduction as assessed by deuterium dilution and bioelectrical impedance analysis.Am J Clin Nutr. 1996 Jul;64(1):1-6. doi: 10.1093/ajcn/64.1.1. Am J Clin Nutr. 1996. PMID: 8669403
-
Estimation of total body water from bioelectrical impedance spectroscopy in oncology outpatients receiving radiotherapy and agreement with three prediction equations.J Hum Nutr Diet. 2009 Feb;22(1):50-4. doi: 10.1111/j.1365-277X.2008.00919.x. J Hum Nutr Diet. 2009. PMID: 19192026
-
Body fluid volumes measurements by impedance: A review of bioimpedance spectroscopy (BIS) and bioimpedance analysis (BIA) methods.Med Eng Phys. 2008 Dec;30(10):1257-69. doi: 10.1016/j.medengphy.2008.06.009. Epub 2008 Aug 3. Med Eng Phys. 2008. PMID: 18676172 Review.
Cited by
-
Effects of Kt/Vurea on outcomes according to age in patients on maintenance hemodialysis.Clin Kidney J. 2024 Apr 13;17(5):sfae116. doi: 10.1093/ckj/sfae116. eCollection 2024 May. Clin Kidney J. 2024. PMID: 38766271 Free PMC article.
-
Impact of wearable-assisted walking on sarcopenia and body composition in older adults.BMC Geriatr. 2025 Jul 2;25(1):466. doi: 10.1186/s12877-025-06142-x. BMC Geriatr. 2025. PMID: 40604455 Free PMC article. Clinical Trial.
-
Seasonal variation in vascular dehydration risk: insights from the Kobe Orthopedic and Biomedical Epidemiologic (KOBE) study.Environ Health Prev Med. 2024;29:62. doi: 10.1265/ehpm.24-00132. Environ Health Prev Med. 2024. PMID: 39496441 Free PMC article.
-
Bioelectrical impedance analysis of bone mineral content based on dual-energy X-ray absorptiometry: evaluation of age-stratified optimized models.Sci Rep. 2025 Jul 9;15(1):24658. doi: 10.1038/s41598-025-08304-8. Sci Rep. 2025. PMID: 40634401 Free PMC article.
-
Cognitive impairment among alcohol treatment service users in South Wales: an exploratory examination of typologies of behaviour, impairment, and service attendance.Front Psychiatry. 2024 Jul 17;15:1377039. doi: 10.3389/fpsyt.2024.1377039. eCollection 2024. Front Psychiatry. 2024. PMID: 39091457 Free PMC article.
References
-
- Morgan AP, Boyden CM, Moore FD. Radioisotope dilution techniques for measurement of body composition in health and disease. Radiol Clin North Am. 1967;5:193–204. - PubMed
-
- Wotton MJ, Thomas BJ, Cornish BH, Ward LC. Comparison of whole body and segmental bioimpedance methodologies for estimating total body water. Ann N Y Acad Sci. 2000;904:181–186. - PubMed
-
- Sun SS, Chumlea WC, Heymsfield SB, et al. Development of bioelectrical impedance analysis prediction equations for body composition with the use of a multicomponent model for use in epidemiologic surveys. Am J Clin Nutr. 2003;77:331–340. - PubMed
-
- Ritz P. Body water spaces and cellular hydration during healthy aging. Ann N Y Acad Sci. 2000;904:474–483. - PubMed
-
- Martinoli R, Mohamed EI, Maiolo C, et al. Total body water estimation using bioelectrical impedance: a meta-analysis of the data available in the literature. Acta Diabetol. 2003;40 Suppl 1:S203–S206. - PubMed
Grants and funding
LinkOut - more resources
Full Text Sources