. 2024 May;479(5):1059-1078.
doi: 10.1007/s11010-023-04779-z. Epub 2023 Jun 14.

Exogenous interleukin-1 beta stimulation regulates equine tenocyte function and gene expression in three-dimensional culture which can be rescued by pharmacological inhibition of interleukin 1 receptor, but not nuclear factor kappa B, signaling

Affiliations

Exogenous interleukin-1 beta stimulation regulates equine tenocyte function and gene expression in three-dimensional culture which can be rescued by pharmacological inhibition of interleukin 1 receptor, but not nuclear factor kappa B, signaling

Ross Eric Beaumont et al. Mol Cell Biochem. 2024 May.

Abstract

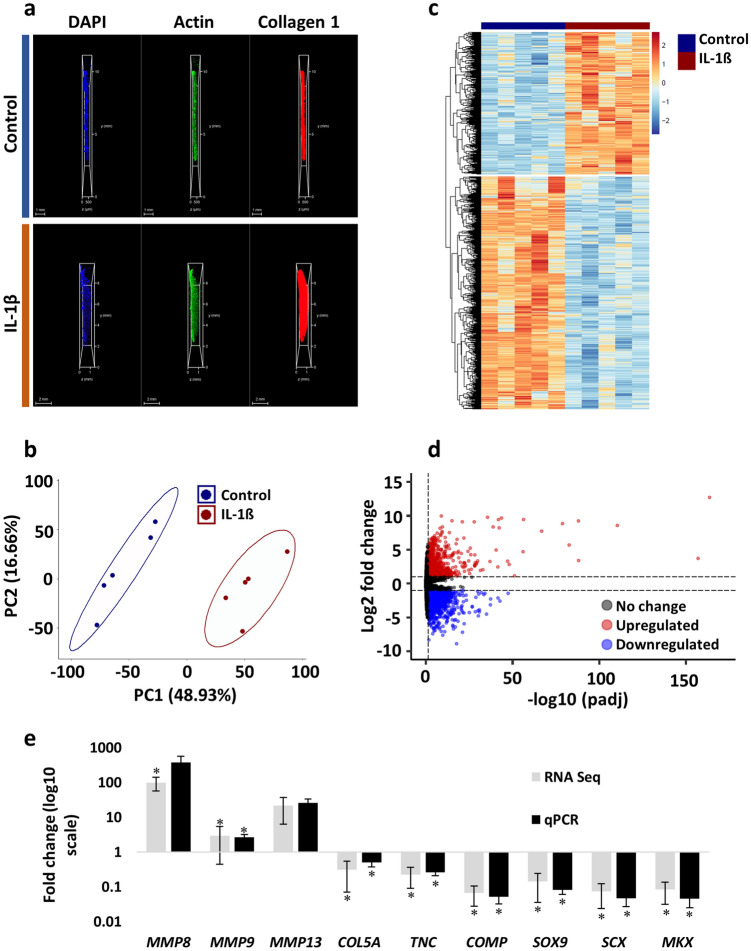
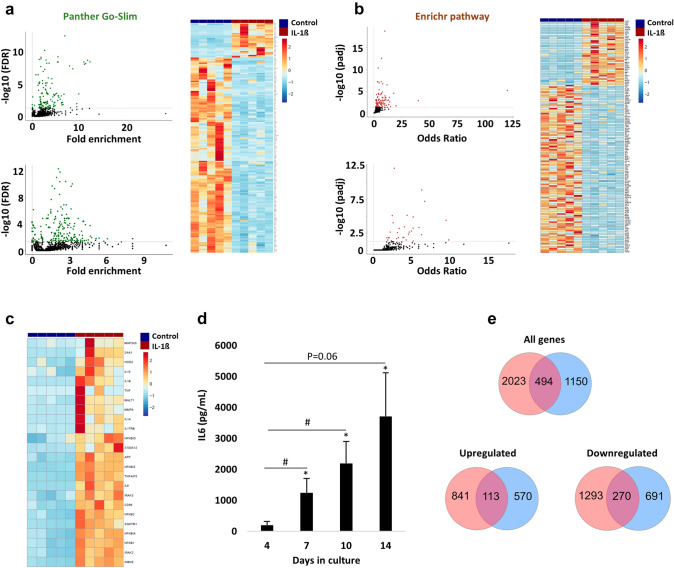
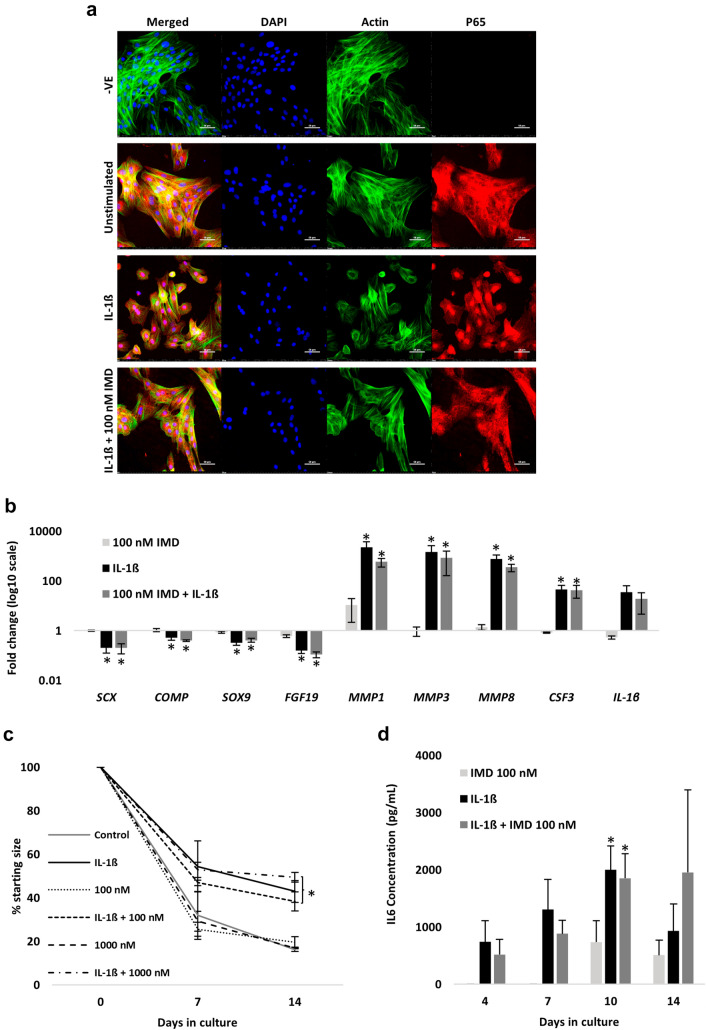
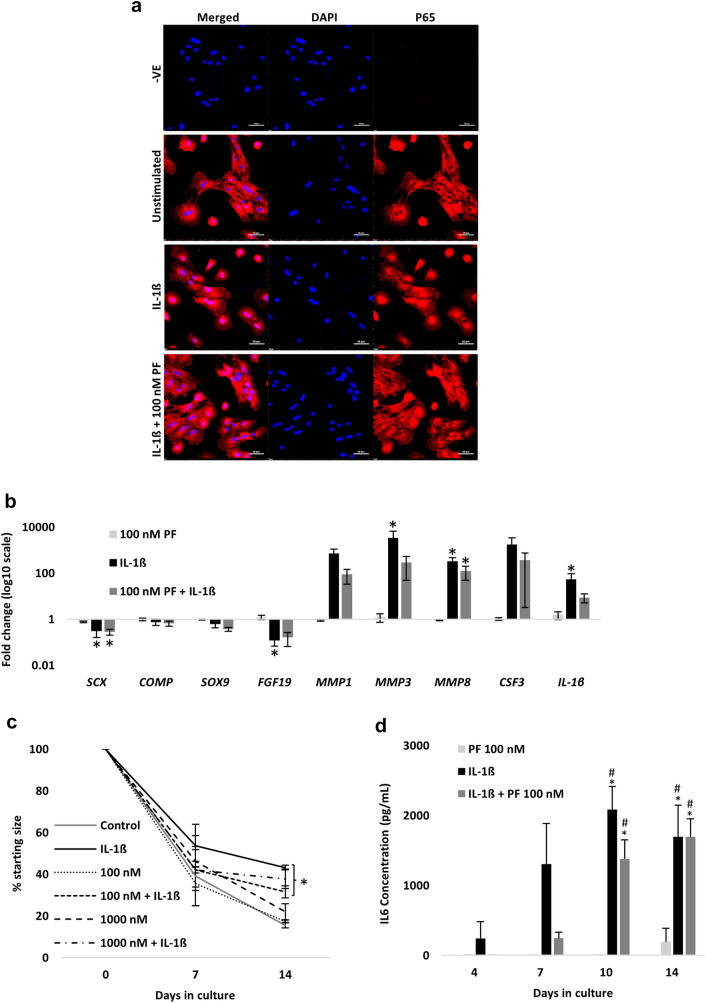
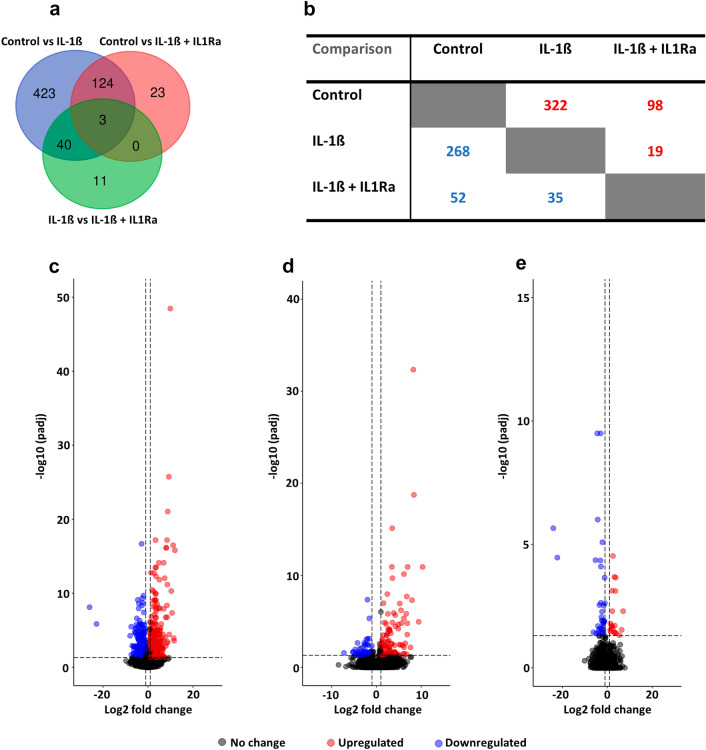
We investigated how Interleukin 1 beta (IL-1β) impacts equine tenocyte function and global gene expression in vitro and determined if these effects could be rescued by pharmacologically inhibiting nuclear factor-κB (NF-KB) or interleukin 1 signalling. Equine superficial digital flexor tenocytes were cultured in three-dimensional (3D) collagen gels and stimulated with IL-1β for two-weeks, with gel contraction and interleukin 6 (IL6) measured throughout and transcriptomic analysis performed at day 14. The impact of three NF-KB inhibitors on gel contraction and IL6 secretion were measured in 3D culture, with NF-KB-P65 nuclear translocation by immunofluorescence and gene expression by qPCR measured in two-dimensional (2D) monolayer culture. In addition, daily 3D gel contraction and transcriptomic analysis was performed on interleukin 1 receptor antagonist-treated 3D gels at day 14. IL-1β increased NF-KB-P65 nuclear translocation in 2D culture and IL6 secretion in 3D culture, but reduced daily tenocyte 3D gel contraction and impacted > 2500 genes at day 14, with enrichment for NF-KB signaling. Administering direct pharmacological inhibitors of NF-KB did reduce NF-KB-P65 nuclear translocation, but had no effect on 3D gel contraction or IL6 secretion in the presence of IL-1β. However, IL1Ra restored 3D gel contraction and partially rescued global gene expression. Tenocyte 3D gel contraction and gene expression is adversely impacted by IL-1β which can only be rescued by blockade of interleukin 1 receptor, but not NF-KB, signalling.

Keywords: Cytokine; Equine; Horse; Inflammation; Musculoskeletal; Tendon.


Conflict of interest statement

The authors have any competing interests to declare.

Figures

Fig. 1
Fig. 1
Morphological and transcriptomic responses of equine adult tenocytes exposed to IL-1β for 14 days in 3D culture. A Whole-mount confocal images of the tendon constructs at day 14; collagen 1 is shown in red, actin filaments in green and nuclear staining by DAPI is shown in blue. Scale bars = 1 mm for the control and 2 mm for the IL-1β samples. Images are representative of n = 2. B PCA of global gene expression profiles from five biological replicates in control (blue) and IL-1β (red) conditions. C Heatmap depicting the 2517 DE genes (adjusted p value < 0.05 and log2-fold change ± 1). Samples are visualised in columns (control blue, IL1-β red) and genes are represented and clustered (euclidean) by row. D Volcano plot highlighting the 18,435 genes in the final dataset; red (n = 954) and blue (1563) dots represent the significantly up-and-down regulated genes, respectively. The X-axis represents the -log 10 (adjusted p value) and the y-axis depicts the log2-fold change. E In-house qPCR validation of nine genes impacted by IL-1β. Values are mean ± SEM (n = 5) of fold change versus the unstimulated control. *denotes p < 0.05 versus control determined by the Wald test (RNA Seq) or an Independent t-test (qPCR)
Fig. 2
Fig. 2
Enrichment analysis, IL6 secretion, and overlap of DE genes impacted by IL-1β in 3D culture. A Scatter plots highlighting the GO biological processes terms. Significant terms (FDR < 0.05) are shown in green for the upregulated (upper, n = 159 hits) and downregulated (lower, n = 198 hits) DE genes. The heatmap shows the DE genes (normalised counts) mapping to ‘Inflammatory response’ (top cluster) and ‘Anatomical structure development’ (bottom cluster); samples are visualised by column (control in blue, IL-1β in red) and genes are visualised and clustered (euclidean) by row. B Scatter plots highlighting the Enrichr pathway analysis. Significant terms (padj < 0.05) are shown in red for the upregulated (upper, n = 104 hits) and downregulated (lower, n = 31 hits) DE genes. The heatmap shows the DE genes (normalised counts) mapping to ‘Interleukin-1 regulation of ECM’ (top cluster) and ‘TGF-beta regulation of ECM’ (bottom cluster); samples are visualised by column (control in blue, IL-1β in red) and genes are visualised and clustered (euclidean) by row. C Heatmap depicting various NF-KB regulatory and target genes (normalised counts) significantly upregulated by IL-1β. Samples are visualised by column and genes are visualised and clustered (euclidean) by row. D Secretion of IL6 measured from the conditioned media of 3D constructs throughout the 14-day culture period. No IL6 was detected in the control samples. *and # denotes p < 0.05 versus control (i.e., 0) and day 4 (IL-1β condition), respectively, determined by Bonferroni post hoc following a significant (p < 0.05) two-way ANOVA. Values are mean ± SEM (n = 4). E Overlap of DE genes with Gehwolf et al. [29] after applying the same statistical filtering (adjusted p value < 0.05 and log2-fold change ± 1). Red (our data), blue [29]
Fig. 3
Fig. 3
P65 inhibition by JSH23 does not restore tenocyte gene expression, collagen gel contraction or IL6 secretion in the presence of IL-1β. A 2D immunofluorescence staining of P65 cytosol/nuclear shuttling following 60 min of IL-1β stimulation (1 nM) with and without JSH23 (1 µM). Unstimulated cells served as the control. P65 is shown in red, actin filaments in green, and nucleus staining by DAPI in blue. Scale bar = 50 µM. Images are representative of three biological replicates. B Fold change in gene expression following 72 h stimulation with JSH23 (1 µM), IL-1β (1 nM), or both. Unstimulated cells served as the control (i.e., 1). *Denotes p < 0.05 versus control with Tukey or Dunn post hoc following a significant (p < 0.05) one-way or Kruskal–Wallis ANOVA. Values are mean ± SEM (n = 3). C Day 14 gel size expressed as a percentage relative to day 0. Concentrations of JSH23 ranged from 1–50 µM with (black bars) and without (grey bars) IL-1β (1 nM), respectively. Values are mean ± SEM (n = 2). D IL6 secretion over the 14-day 3D culture period with IL-1β (1 nM) or IL-1β (1 nM) + JSH23 (1 µM). No IL6 was detected in the JSH23 (1 µM)-only or control conditions. Values are mean ± SEM (n = 3)
Fig. 4
Fig. 4
IKKβ inhibition by IMD0354 does not rescue the impact of IL-1β on tenocyte gene expression, collagen gel contraction or IL6 secretion. A 2D immunofluorescence staining of P65 cytosol/nuclear translocation following 60 min of IL-1β stimulation (1 nM) with and without IMD0354 (100 nM). Unstimulated cells served as the control. P65 is shown in red, actin filaments in green, and nucleus staining by DAPI in blue. Scale bar = 50 µM. Images representative of n = 3. B Fold change in gene expression following 72 h stimulation with IMD0354 (100 nM), IL-1β (1 nM), or both. Unstimulated cells served as the control (i.e., 1). *denotes p < 0.05 versus control with Tukey or Dunn post hoc following a significant (p < 0.05) one-way or Kruskal–Wallis ANOVA. Values are mean ± SEM (n = 3). C Changes in collagen gel size over the 14-day period expressed as a percentage relative to day 0. Concentrations of IMD0354 were 100 and 1000 nM, respectively, with and without IL-1β (1 nM). Values are mean ± SEM (n = 3). *denotes p < 0.05 versus control and IMD3054-only conditions following a significant (p < 0.05) two-way (time x condition) ANOVA. D IL6 secretion over the 14-day 3D culture period with IL-1β (1 nM) or IL-1β (1 nM) + IMD0354 (100 nM). No IL6 was detected in the control conditions. Values are mean ± SEM (n = 3). *denotes p < 0.05 versus control following a significant (p < 0.05) two-way (time x condition) ANOVA. IMD = IMD0354
Fig. 5
Fig. 5
IRAK4 inhibition by PF-06650833 confers moderate rescue of tenocyte gene expression in the presence of IL-1β. A 2D immunofluorescence analysis of P65 cytosol/nuclear staining following 60 min of IL-1β stimulation (1 nM) with and without PF-06650833 (100 nM). Unstimulated cells served as the control. P65 is shown in red and nucleus staining by DAPI in blue. Scale bar = 50 µM. Images are representative of three biological replicates. B Fold change in gene expression following 72 h stimulation with PF-06650833 (100 nM), IL-1β (1 nM), or both. Unstimulated cells served as the control (i.e., 1). *denotes p < 0.05 versus control with Tukey or Dunn post hoc following a significant (p < 0.05) one-way or Kruskal–Wallis ANOVA. Values are mean ± SEM (n = 3). C Changes in collagen gel size over the 14-day period expressed as a percentage relative to day 0. Concentrations of PF-06650833 were 100 and 1000 nM, respectively, with and without IL-1β (1 nM). Values are mean ± SEM (n = 3). *denotes p < 0.05 versus control and PF-06650833-only conditions following a significant (p < 0.05) two-way (time x condition) ANOVA. D IL6 secretion over the 14-day 3D culture period with IL-1β (1 nM), PF-06650833 (100 nM), or IL-1β (1 nM) + PF-06650833 (100 nM). No IL6 was detected in the control condition. Values are mean ± SEM (n = 3). * and # denotes p < 0.05 versus control and PF-06650833 (100 nM), respectively, following a significant (p < 0.05) two-way (time x condition) ANOVA. PF = PF-06650833
Fig. 6
Fig. 6
Magnitude of change in DE gene expression by IL1Ra after 14 days in 3D culture. A Venn diagram highlighting the common and unique DE genes for each pairwise comparison from the DESeq2 analysis. B Direction of change in DE gene expression for each of the three conditions; red and blue numbers denote up-and-down regulation of gene expression, respectively. C–E Volcano plots depicting the upregulated (red) and downregulated (blue) DE genes in the control vs IL-1β (C), control vs IL-1β + IL1Ra (D), and IL-1β vs IL-1β + IL1Ra (E) conditions, respectively. DE genes were determined based on a log2FC > 1 and padj < 0.05
Fig. 7
Fig. 7
Network analysis and magnitude of change in expression of the DE genes suggested to regulate tenocyte collagen gel contraction. A Functional network interaction of the 33 DE genes conducted with STRING; only the proteins (nodes) with a predicted interaction score > 0.4 (medium confidence) are displayed (n = 10), with the remaining DE genes omitted. A thicker line (edges) indicates a stronger interaction score. GO enrichment analysis revealed significant hits (FDR < 0.05) in the molecular function category shown in red (GO:0004528), green (GO:0004551), and blue (GO:0036218), respectively. KEGG pathway indicated enrichment of one term (ecb00500) shown in yellow. B Heatmap depicting the normalised count data for the 10 DE genes isolated in the network analysis. Samples are visualised and clustered (euclidean) in columns (control blue, IL1-β red, IL-1β + IL1Ra green) and genes are represented and clustered (euclidean) by row

Similar articles

Cited by

References

    1. Benjamin M, Kaiser E, Milz S. Structure-function relationships in tendons: a review. J Anatomy. 2008;212:211–218. doi: 10.1111/j.1469-7580.2008.00864.x. - DOI - PMC - PubMed
    1. Kannus P. Tendons—a source of major concern in competative and recreational athletes. ScandaJ. Med Sci Sports. 1997;7:53–54. doi: 10.1111/j.1600-0838.1997.tb00118.x. - DOI - PubMed
    1. Docheva D, Muller SA, Majewski M, Evans CH. Biologics for tendon repair. Adv Drug Deliv Rev. 2015;84:222–230. doi: 10.1016/j.addr.2014.11.015. - DOI - PMC - PubMed
    1. Nourissat G, Berenbaum F, Duprez D. Tendon injury: from biology to tendon repair. Nat Rev Rheumatol. 2015;11:223–233. doi: 10.1038/nrrheum.2015.26. - DOI - PubMed
    1. Williams RB, Harkins LS, Hammond CJ, Wood JL. Racehorses injuries, clinical problems and fatalities recorded on British racecourses from flat racing and National Hunt racing during 1996, 1997 and 1998. Equine Vet J. 2001;33:478–486. doi: 10.2746/042516401776254808. - DOI - PubMed

MeSH terms