. 2023 Sep 1;21(9):958-974.
doi: 10.1158/1541-7786.MCR-23-0108.

Targeting the ATF6-Mediated ER Stress Response and Autophagy Blocks Integrin-Driven Prostate Cancer Progression

Affiliations

Targeting the ATF6-Mediated ER Stress Response and Autophagy Blocks Integrin-Driven Prostate Cancer Progression

Amanda J Macke et al. Mol Cancer Res. .

Abstract

Prostate cancer progression to the lethal metastatic castration-resistant phenotype (mCRPC) is driven by αv integrins and is associated with Golgi disorganization and activation of the ATF6 branch of unfolded protein response (UPR). Overexpression of integrins requires N-acetylglucosaminyltransferase-V (MGAT5)-mediated glycosylation and subsequent cluster formation with Galectin-3 (Gal-3). However, the mechanism underlying this altered glycosylation is missing. For the first time, using HALO analysis of IHC, we found a strong association of integrin αv and Gal-3 at the plasma membrane (PM) in primary prostate cancer and mCRPC samples. We discovered that MGAT5 activation is caused by Golgi fragmentation and mislocalization of its competitor, N-acetylglucosaminyltransferase-III, MGAT3, from Golgi to the endoplasmic reticulum (ER). This was validated in an ethanol-induced model of ER stress, where alcohol treatment in androgen-refractory PC-3 and DU145 cells or alcohol consumption in patient with prostate cancer samples aggravates Golgi scattering, activates MGAT5, and enhances integrin expression at PM. This explains known link between alcohol consumption and prostate cancer mortality. ATF6 depletion significantly blocks UPR and reduces the number of Golgi fragments in both PC-3 and DU145 cells. Inhibition of autophagy by hydroxychloroquine (HCQ) restores compact Golgi, rescues MGAT3 intra-Golgi localization, blocks glycan modification via MGAT5, and abrogates delivery of Gal-3 to the cell surface. Importantly, the loss of Gal-3 leads to reduced integrins at PM and their accelerated internalization. ATF6 depletion and HCQ treatment synergistically decrease integrin αv and Gal-3 expression and temper orthotopic tumor growth and metastasis.

Implications: Combined ablation of ATF6 and autophagy can serve as new mCRPC therapeutic.


Conflict of interest statement

Competing interests. The authors declare that they have no competing interests.

Figures

Figure 1.
Figure 1.
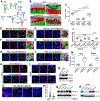
Differential distribution of MGAT3 and MGAT5 in PCa cells. (A) Schema of the N-glycosylation of proteins in ER and Golgi. High-Man-bearing proteins shift from ER to Golgi, where the (Man)5(GlcNAc)2 structure occurs after trimming by Mannosidase I (Man-I, α−1,2-specific). MGAT1 then adds an N-acetylglucosamine (GlcNAc) residue to the terminal Man residue, followed by the removal of two Man residues by Mannosidase II (Man-II, α−1,3/6-specific). Further processing by MGAT2 is followed by one of three glycosyltransferases: MGAT3, MGAT4, or MGAT5. Importantly, bisecting GlcNAc formed by MGAT3 (asterisk) blocks MGAT5-mediated glycan branching. Note that each variation will result in complex-type oligosaccharides (not shown). (B) Representative 3D SIM images of Golgi membranes in LNCaP cells stained for MGAT3 or MGAT5 and Golgi markers: GM130 (cis-Golgi) or Giantin (medial-Golgi); bars, 2 μm. (C) Quantification of Pearson’s correlation coefficient (PCC) for indicated proteins from B. Tukey Method, p-adjusted using Benjamini-Hochberg; n indicates the number of Golgi stacks counted, median ± SD. (D-I) 3D SIM images of normal prostate and PCa (grades 2–3) immunostained for MGAT3 or MGAT5 and Golgi markers: GRASP65 (cis-Golgi) or Giantin. Representative reconstruction by Imaris is presented to the right of each panel; bars, 10 μm. Panels H and I represent only reconstructed 3D images. (J) Quantification of PCC for indicated proteins from D-I. Tukey Method, p-adjusted using Benjamini-Hochberg; n indicates the number of Golgi counted, median ± SD. (K, L) Immunostaining of MGAT3 or MGAT5 with GM130 or Giantin in PC-3 (K) and DU145 (L) cells; bars, 10 μm. (M) Quantification of PCC for indicated proteins from K and L. Tukey Method, p-adjusted using Benjamini-Hochberg; n indicates the number of images analyzed, median ± SD. (N) MGAT3 W-B of ER fraction isolated from LNCaP, PC-3, and DU145 cells; samples were normalized by HSP70. (O) Proximity ligation assay (PLA) of normal prostate and PCa (grades 1–5) using Ms-anti-GM130 and Rb-anti-MGAT3 Abs; bars, 10 μm. (P) Quantification of PLA intensity (red) in normal and PCa tissue samples (all grades). Kruskal-Wallis test; medians with individual values. (Q, R) Integrin αv (Q) and Gal-3 (R) W-B of lysate samples from RWPE-1, LNCaP, 22Rv1, PC-3, and DU145 cells; β-actin is a loading control. All data presented are representative of at least three independent experiments. For all statistics: ****p<0.0001.
Figure 2.
Figure 2.
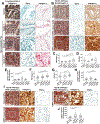
(A) IHC analysis of Integrin αv and Gal-3 expression in prostate tumor. Representative images of triple IHC staining of Integrin αv (red), Gal-3 (green), and E-cadherin (brown) in normal prostate and tumor tissues from PCa patients with different grades. (B) Representative images of triple IHC staining of Na+/K+-ATPase (red), Integrin αv (brown), and Gal-3 (green) in tumor tissues from PCa patients: non-metastatic (grade 4) and mCRPC patients with tissue or bone metastasis. Black boxes are highlighted at the right to present deconvoluted images of Gal-3 and Integrin αv. Bars for A and B, 100 μm. (C, D) Quantification of Integrin αv (C) and Gal-3 (D) H-scores at PM in patients from A; this includes only patients that demonstrate the correlation of parameters in different combinations of anti-Integrin αv and anti-Gal-3 Abs (see Supplemental Table S1 and supplemental methods). Pairwise comparisons using Wilcoxon rank sum exact test, p-adjusted using Benjamini-Hochberg. (E) Quantification of Integrin αv and Gal-3 colocalization at PM within different grades of PCa from images in A. Pairwise comparisons using Wilcoxon rank sum exact test, p-adjusted using Benjamini-Hochberg. (F, G) Quantification of Integrin αv (F) and Gal-3 (G) H-score at PM in patients from B. Pairwise comparisons using Wilcoxon rank sum exact test, p-adjusted using Benjamini-Hochberg. For G, non-metastatic group includes patients with all grades. (H) Quantification of Integrin αv and Gal-3 colocalization at PM in patients from B. Pairwise comparisons using Wilcoxon rank sum exact test, p-adjusted using Benjamini-Hochberg. (I) Representative images of triple IHC staining of Na+/K+-ATPase (red), Integrin αv (brown), and PHA-L lectin (green) in the tumor tissues from PCa patients: non-metastatic (grade 4) and CRPC patients with tissue or bone metastasis. Black boxes are presented at the right as deconvoluted images of Integrin αv and PHA-L lectin; bars, 100 μm. (J) Quantification of Integrin αv/PHA-L PM colocalization for samples from I; non-metastatic group includes patients with all grades Pairwise comparisons using Wilcoxon rank sum exact test, p-adjusted using Benjamini-Hochberg. For all graphs, n indicates the number of tissue samples. For all statistics: ****p<0.0001, ***p<0.001, **p<0.01, and *p<0.05, median ± SD.
Figure 3.
Figure 3.
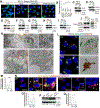
The effect of HCQ on Golgi in PCa cells. (A) Representative images of Golgi in PC-3 cells stained by GM130 (green): control and ATF6 KD cells treated with 50 μM HCQ for 72 h or an appropriate amount of water (Ctrl); bars, 20 μm. (B) Quantification of Golgi spots per cell in samples from A. Pairwise comparisons using Wilcoxon rank sum exact test, p-adjusted using Benjamini-Hochberg; n represents the cells counted. (C) ATF6 W-B of the lysates of PC-3 cells transfected with control or ATF6α shRNA; β-actin is a loading control. (D-I) ERp72 (D), GRP78 (E), PERK (F), PERK-P (G), IRE1 (H), and IRE1-P (I) W-Bs of the lysates from control and ATF6 KD PC-3 cells. (J) Giantin W-B of the lysates from control and ATF6 KD cells. The samples were prepared under low (1%) concentrations of β-mercaptoethanol. Giantin-dimer and monomer are indicated by arrows. The Nesprin 2 band at 800 kDa in control PC-3 lysate corresponds to the size of the Giantin dimer. (K) Representative EM images of control and HCQ-treated PC-3 cells. Note multiple Golgi (G) fragments in control cells (insets a and b) and compact reorganized Golgi in HCQ-treated; N, nucleus. Orange squares indicate the areas of Golgi enlarged at the right; bars, 1 μm. (L) IF staining of cis-Golgi (GRASP65) and MGAT3 in PC-3 cells treated with HCQ. The right panels show representative Z-stack images collected by SIM and reconstructed using Imaris. Bar sizes are: 5 μm and 3 μm for Ctrl and Ctrl-Golgi 3D SIM, respectively, and 7 μm and 2 μm for HCQ and HCQ-Golgi 3D SIM, accordingly. (M) Quantification of GRASP65 and MGAT3 colocalization from the cells in L; only images of 3D SIM were counted. Unpaired t test; n indicates number of cells. (N) PC-3 cells were treated with HCQ and then transfected with the Premo Autophagy Tandem Sensor RFP-GFP-LC3B. The Golgi membranes were stained using Alexa Fluor 647 anti-GM130 Ab. White squares indicate an area of LC3B punctae around the Golgi membranes enlarged at the right. Bar size, 5 μm. (O) The autophagic index was counted as the ratio of the areas of autophagosomes (overlapped red and green) to autolysosomes (red); Mann Whitney test. (P) LC3B W-B of the lysates of cells from A. All data presented are representative of at least three independent experiments. (Q) Quantification of PCC between yellow punctae and GM130 (magenta). Unpaired t test. For O and Q, n indicates the number of cells. For all statistics: ****p<0.0001, ***p<0.001, **p<0.01, and *p<0.05, median ± SD.
Figure 4.
Figure 4.
HCQ-induced redistribution of Integrin αv and Gal-3. (A) PHA-L lectin affinity chromatography of the lysate samples from control and HCQ-treated PC-3 cells. Integrin αv W-B of the input (top panel) and eluate (bottom panel). The input was normalized by β-actin and eluate by total protein concentration. (B) Representative images of PC-3 cells IF co-staining of Integrin αv (green) and Na+/K+-ATPase (red) in control and HCQ-treated cells; bars, 100 μm. (C) Quantification of Integrin αv IF intensity at PM in cells from B; Mann Whitney test. (D, E) Integrin αv (D) and Gal-3 (E) W-B of the PM samples from control and HCQ-treated PC-3 and DU145 cells. (F) PLA in control and HCQ-treated PC-3 cells, using Ms-anti-Gal-3 and Rb-anti-Integrin αv, and co-stained with Gt-anti-E-cadherin (green); bars, 20 μm. Asterisks indicate PLA-specific red spots at PM. (G) Quantification of PLA spots at PM per cell in samples from F; unpaired t test. (H) Adhesion of PC-3 and DU145 cells (control and HCQ-treated) to polystyrene microtiter plates coated with fibronectin; Mann Whitney test. (I) Representative reconstructions of the distribution of Gal-3 (green), Integrin αv (red), and early endosomal marker EEA1 (magenta) in control and HCQ-treated PC-3 cells. Z-stack images were collected, and a 3D image projection was created using Imaris for visualization; bars, 5 μm. (J) Mander’s coefficient of colocalization for Gal-3 and Integrin αv merged spots with EEA1. Unpaired t test. (K) W-B analysis of PC-3 cells treated with two different combinations of Integrin αv siRNAs. Lysate samples were tested for Integrin αv (top peanel) and Gal-3 (middle panel); PM samples were tested for Gal-3 (bottom panel). (L) Representative reconstructions of Gal-3 (green) and EEA1 (magenta) distribution in control and Integrin αv KD PC-3 cells; bars, 5 μm. (M) PCC between Gal-3 and EEA1; Mann Whitney test. (N) W-B analysis of PC-3 cells treated with two different combinations of Gal-3 siRNAs. Lysate samples were tested for Gal-3 (top panel) and Integrin αv (middle panel); PM samples were tested for Integrin αv (bottom panel). (O) Representative reconstructions of pulse-chase endocytosis experiment. Integrin αv Ab (red) was internalized by control or HCQ-treated PC-3 cells, which were then stained for Gal-3 (green) and EEA1 (magenta); bars, 5 μm. (P) Mander’s coefficient of colocalization for Gal-3 and Integrin αv merged spots with EEA1; Mann Whitney test. (Q) RT-qPCR analysis of Integrin αv mRNA in control and HCQ-treated PC-3 and DU145, calculated using the 2−ΔΔCT method with GAPDH as the reference gene. Results are the means of three independent experiments performed in triplicate. (R) Integrin αv W-B of the lysate samples from PC-3 and DU145 cells: control and treated with HCQ. (S, T) Integrin αv (S) and MGAT5 (T) W-B of the PM samples from PC-3 cells: control and ATF6 KD treated with HCQ. For W-B data: E-cadherin and Na+/K+-ATPase are the loading controls for PM samples, and lysates were normalized by β-actin. For all statistics: median ± SD, ***p<0.001, ****p<0.0001, *p<0.05; n indicates the number of cells. All data presented are representative of at least three independent experiments.
Figure 5.
Figure 5.
Analysis of Integrin αv and Gal-3 distribution using immunogold EM. (A) Representative micrographs of double pre-embedding immunogold EM analyses of Integrin αv and Gal-3 in PC-3 cells using Abs conjugated to 1.4-nm and 10-nm gold particles, respectively. Cells were treated with 50 μM HCQ or a proper amount of water (Ctrl). The two upper left panels (Ctrl-PM) demonstrate the merged Integrin αv-Gal-3 spots at PM: single or clusters. Others indicate their distribution in the cytoplasm, late endosomes (LE), Golgi, and early endosomes (EE). (B, C) Quantification of merged Integrin αv-Gal-3 spots at PM (B) and in EE (C) in cells from A per area in μm2. (D) Representative micrographs of single pre-embedding immunogold EM analyses of Integrin αv in PC-3 cells treated with 50 μM HCQ for 72 h or an appropriate amount of water. (E) Quantification of Integrin αv spots at PM from cells in D. (F) Quantification of Integrin αv spots at PM from control and Gal-3 KD PC-3 cells. (G) Representative micrographs of single pre-embedding immunogold EM analyses of Integrin αv in PC-3 cells treated with control or Gal-3 siRNAs; MVB, multivesicular bodies; TGN, trans-Golgi network; ER, endoplasmic reticulum. (H, I) Quantification of Integrin αv spots in EE and ER, respectively, in cells from G. For all graphs, n is the number of cells, bars 200 nm. Mann Whitney test for all graphs; ****p<0.0001, median ± SD.
Figure 6.
Figure 6.
The impact of alcohol on Golgi morphology and expression of Integrin αv and MGAT5. (A-F) Representative IF images of Golgi (GM130, green), PM (Na+/K+-ATPase, red), and Integrin αv (magenta) in PC-3 (A) and DU145 (D) cells treated with 11.5 μM ethanol (EtOH) or isocaloric amount of media (Ctrl) for 72 hours; bars, 10 μm. B and E: quantification of the number of Golgi fragments per cell from images in A and D, respectively; C and F: quantification of Integrin αv integrated fluorescence intensity at PM from images in A and D, respectively. Mann Whitney test for B, E, and F, unpaired t test for C. For B, C, E, and F, n indicates the number of cells. (G) Correlation analysis between the number of Golgi spots (blue) and PM Integrin αv (red) counted as the average for each parameter in the cells from one field of view. Spearman Rank Correlation Coefficient, rs; p<0.0001. (H, I) Integrin αv W-B of the PM samples from the cells in A and D, respectively; Na+/K+-ATPase and E-cadherin are loading controls. (J, K) Representative micrographs of single pre-embedding immunogold EM analyses of Integrin αv in control (J) and EtOH-treated (K) DU145 cells. Arrowheads indicate Integrin αv-specific spots on PM. (L) Quantification of Integrin αv spots per area of PM (in μm2) in cells from J and K; Mann Whitney test. (M, N) MGAT5 W-B of the lysate samples from the cells in A and D, respectively; β-actin is a loading control. (O) Triple IHC staining of Integrin αv (red, deconvoluted in the middle), Gal-3 (green), and E-cadherin (brown) in tumor tissues from PCa patients: non-alcoholic or consuming alcohol at a moderate or high level; bars, 100 μm. (P, Q) Quantification of Integrin αv PM H-score (P) and colocalization of Integrin αv with Gal-3 at the PM (Q) from the samples in O. For P: Tukey Method, p-adjusted using Benjamini-Hochberg. For Q: Dunn Test (1964) Kruskal-Wallis multiple comparisons; n indicates the number of samples. (R) MGAT5 IHC (brown) in tumor tissues from PCa patients: non-alcoholic or consuming alcohol at the moderate or high level; bars, 100 μm. (S) Quantification of the percent of MGAT5-positive cells from the samples in R. Tukey Method, p-adjusted using Benjamini-Hochberg. For all statistics: median ± SD, ****p<0.0001, **p<0.005, *p<0.05. All data presented are representative of at least three independent experiments.
Figure 7.
Figure 7.
In vivo implication of ATF6 ablation and HCQ treatment, and the working model of HCQ treatment and ATF6 depletion on glycosylation and distribution of Integrin αv and Gal-3. (A) Representative images of orthotopic tumors in nude mice derived from control and ATF6 KD PC-3 cells. In the control group, images at the right indicate metastases (arrowheads) in regional (top panel) and mediastinal (middle panel) lymph nodes and in the liver (bottom panel). In HCQ and ATF6 KD groups, insets show metastases in regional lymph nodes. (B) Quantification of tumor size from mice in A. Pairwise comparisons using Wilcoxon rank sum exact test, p-adjusted using Benjamini-Hochberg. (C) Golgi disorganization in advanced PCa cells results in the mislocalization of MGAT3 from Golgi to ER; however, it does not affect Golgi localization for MGAT5. (1) Integrins are delivered to the cell surface via canonical (ER→Golgi→PM) trafficking and modified in Golgi by MGAT5, followed by interaction with pentameric Gal-3 and the formation of clusters at the PM. (2) The magnifying glass indicates the details of Golgi-associated autophagy at the left. Under normal conditions, the Golgi fragments in PCa cells can serve as a source of phagophores. The complex of Integrin αv and Gal-3 is internalized into early endosomes (EE), which, in turn, can fuse with autophagosome (AV). Most EEs mature into late endosomes (LE) or multivesicular bodies (MVB), followed by recycling or formation of an amphisome. The latter fuses with lysosomes to form autophagolysosomes. Hydroxychloroquine (HCQ) does not inhibit the maturation of EE, but it accelerates the internalization of Integrin αv/Gal-3 (3) due to a deficiency of Gal-3 at the cell surface. This, in addition to HCQ blocking the fusion of EE with AV, results in the aggregation of integrins in EE. Also, HCQ prevents the fusion of lysosomes with amphisomes and the formation of phagophores from Golgi membranes. Reconstitution of compact Golgi by ATF6 depletion and HCQ treatment (4) is associated with the recovery of intra-Golgi localization of MGAT3, which significantly reduces the retention of integrins at the cell surface. (D) Flow chart of HCQ’s effect on trafficking of Gal-3 and Integrin αv. Abrogation of MGAT5-mediated glycosylation and Gal-3 delivery to the cell surface destabilize the retention of integrins at PM, which accelerates their internalization.

Similar articles

Cited by

References

    1. Goel HL, Li J, Kogan S, Languino LR. Integrins in prostate cancer progression. Endocr Relat Cancer 2008;15:657–64 - PMC - PubMed
    1. Yadav RK, Chae SW, Kim HR, Chae HJ. Endoplasmic reticulum stress and cancer. J Cancer Prev 2014;19:75–88 - PMC - PubMed
    1. Kellokumpu S, Sormunen R, Kellokumpu I. Abnormal glycosylation and altered Golgi structure in colorectal cancer: dependence on intra-Golgi pH. FEBS Lett 2002;516:217–24 - PubMed
    1. Petrosyan A, Holzapfel MS, Muirhead DE, Cheng PW. Restoration of compact Golgi morphology in advanced prostate cancer enhances susceptibility to galectin-1-induced apoptosis by modifying mucin O-glycan synthesis. Mol Cancer Res 2014;12:1704–16 - PMC - PubMed
    1. McKinnon CM, Mellor H. The tumor suppressor RhoBTB1 controls Golgi integrity and breast cancer cell invasion through METTL7B. BMC Cancer 2017;17:145. - PMC - PubMed

Publication types

MeSH terms