

Racial, Ethnic, and Socioeconomic Differences in Food Allergies in the US
- PMID: 37314805
- PMCID: PMC10267771
- DOI: 10.1001/jamanetworkopen.2023.18162
Racial, Ethnic, and Socioeconomic Differences in Food Allergies in the US
Abstract
Importance: Food allergies affect approximately 8% of children and 11% of adults in the US. Racial differences in food allergy outcomes have previously been explored among Black and White children, but little is known about the distribution of food allergies across other racial, ethnic, and socioeconomic subpopulations.
Objective: To estimate the national distribution of food allergies across racial, ethnic, and socioeconomic groups in the US.
Design, setting, and participants: In this cross-sectional survey study, conducted from October 9, 2015, to September 18, 2016, a population-based survey was administered online and via telephone. A US nationally representative sample was surveyed. Participants were recruited using both probability- and nonprobability-based survey panels. Statistical analysis was performed from September 1, 2022, through April 10, 2023.
Exposures: Demographic and food allergy-related participant characteristics.
Main outcomes and measures: Stringent symptom criteria were developed to distinguish respondents with a "convincing" food allergy from those with similar symptom presentations (ie, food intolerance or oral allergy syndrome), with or without physician diagnosis. The prevalence of food allergies and their clinical outcomes, such as emergency department visits, epinephrine autoinjector use, and severe reactions, were measured across race (Asian, Black, White, and >1 race or other race), ethnicity (Hispanic and non-Hispanic), and household income. Complex survey-weighted proportions were used to estimate prevalence rates.
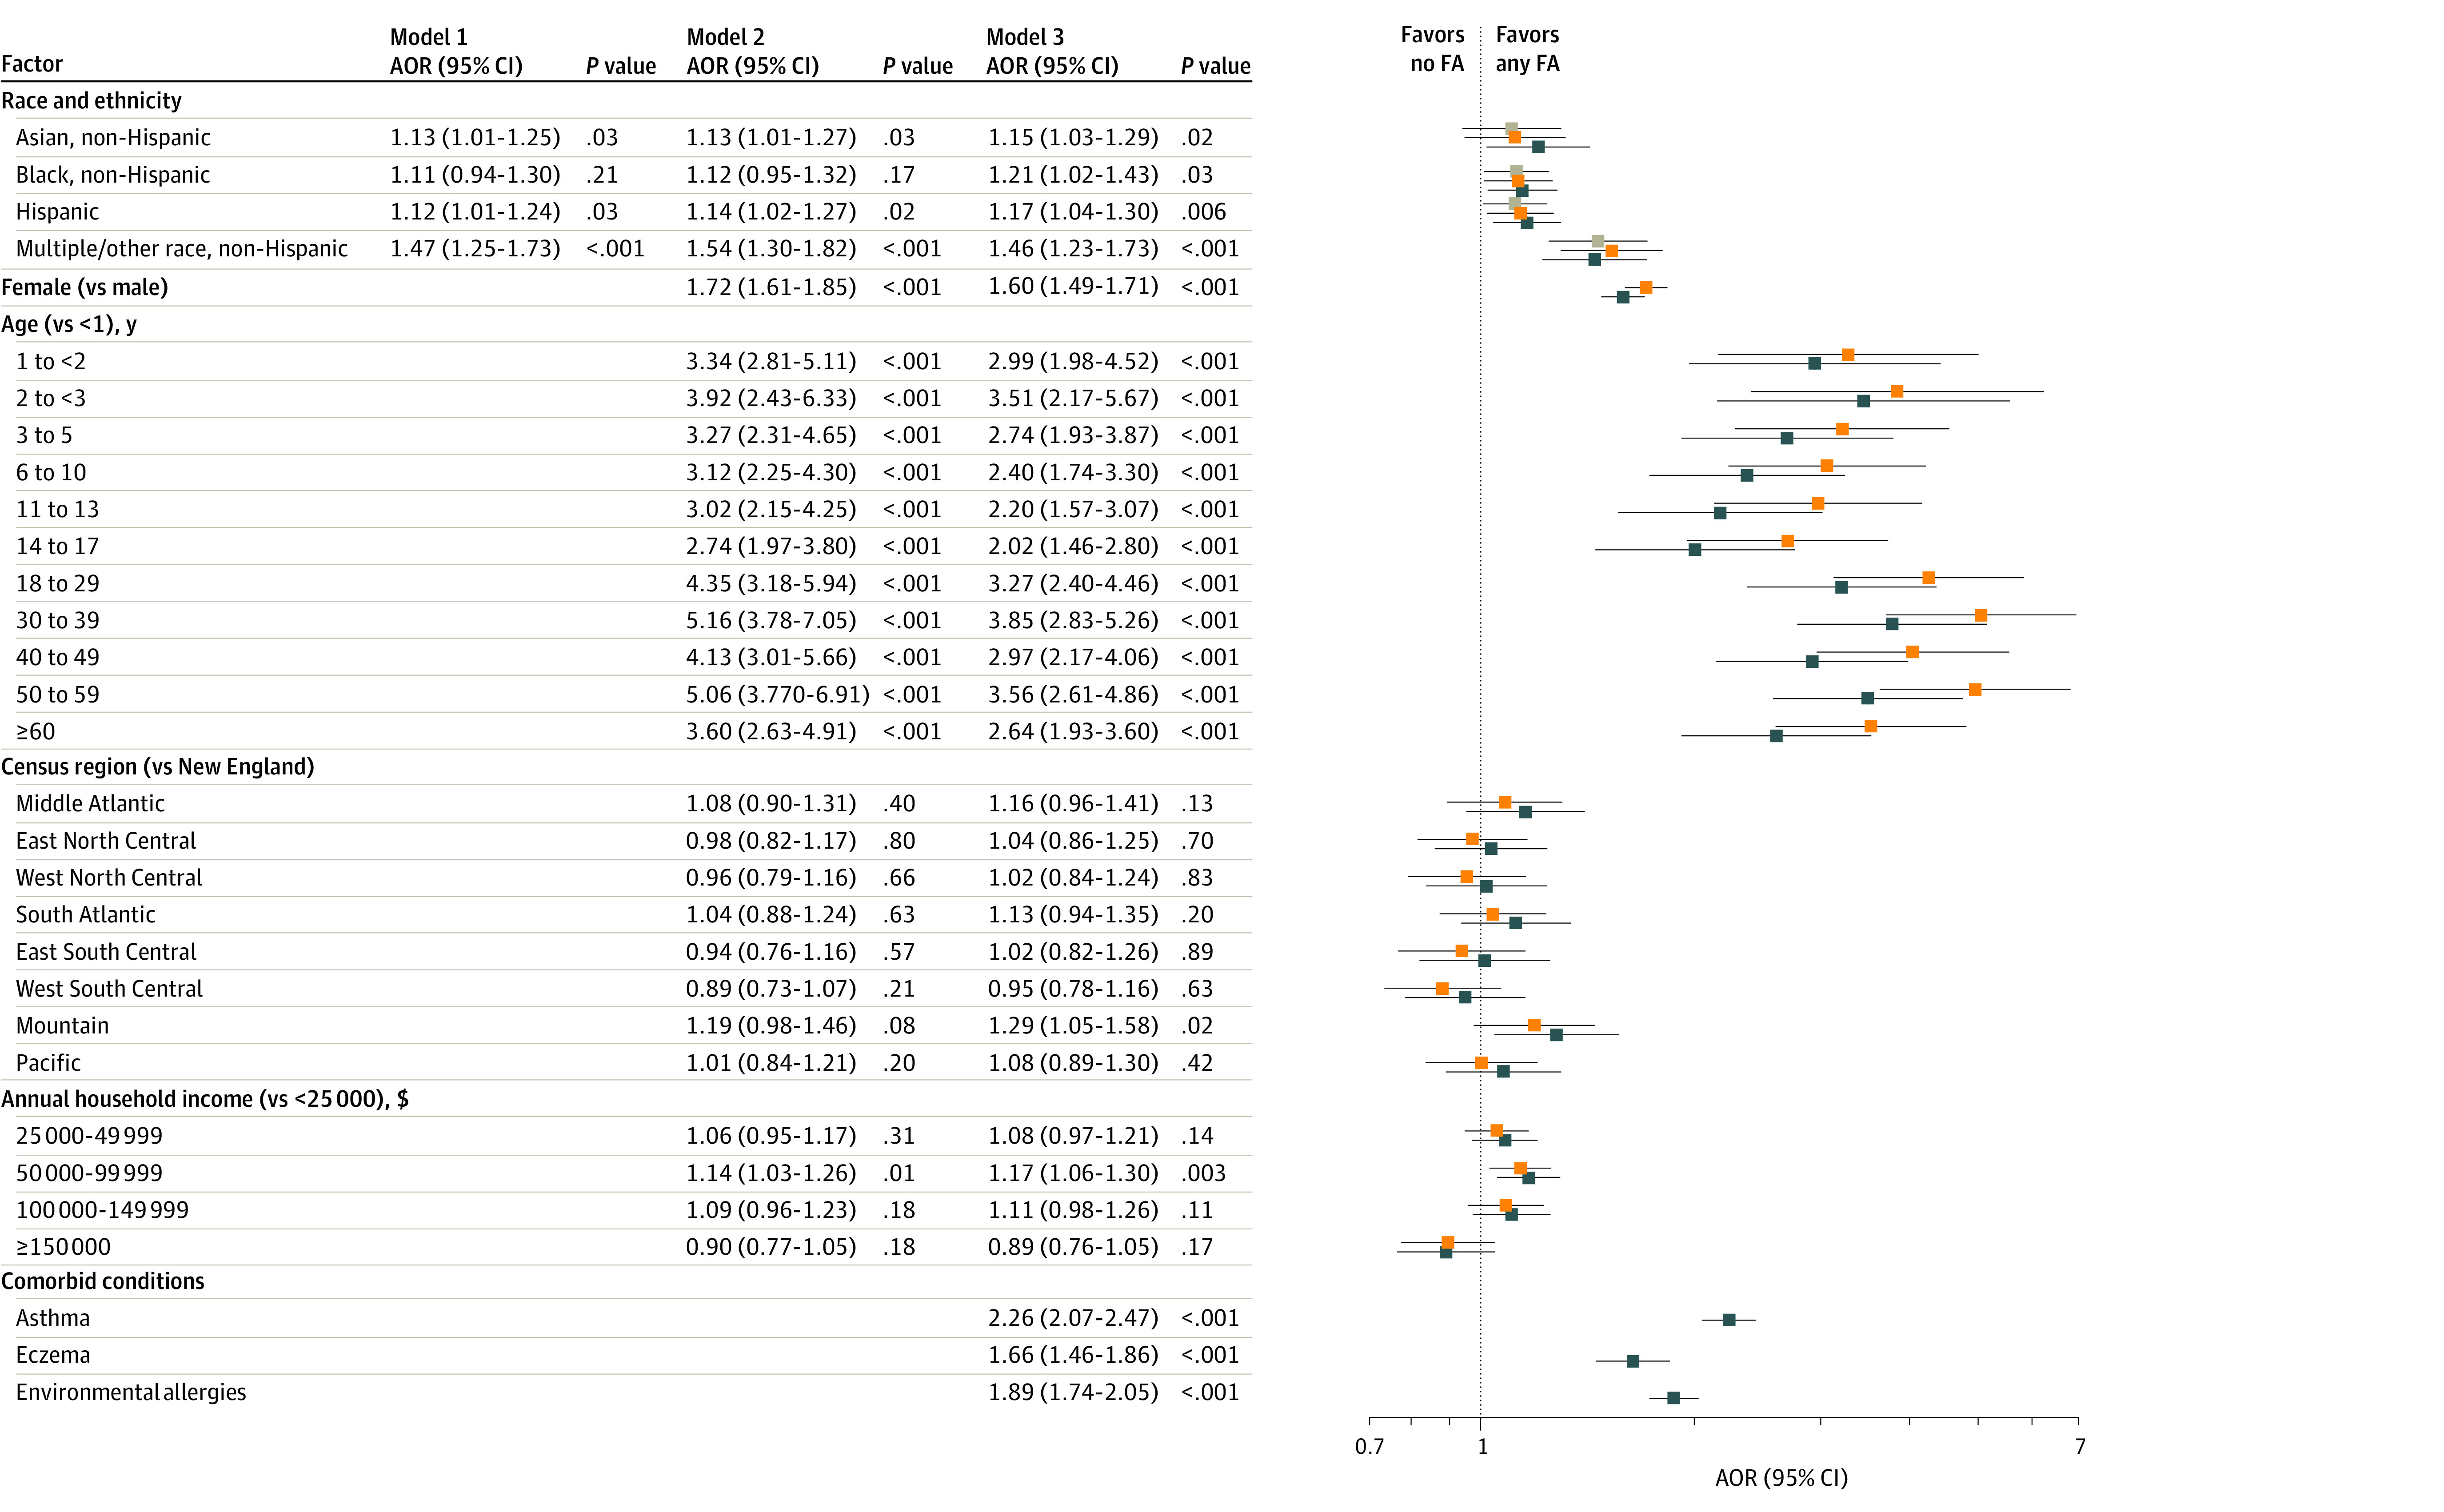
Results: The survey was administered to 51 819 households comprising 78 851 individuals (40 443 adults and parents of 38 408 children; 51.1% women [95% CI, 50.5%-51.6%]; mean [SD] age of adults, 46.8 [24.0] years; mean [SD] age of children, 8.7 [5.2] years): 3.7% Asian individuals, 12.0% Black individuals, 17.4% Hispanic individuals, 62.2% White individuals, and 4.7% individuals of more than 1 race or other race. Non-Hispanic White individuals across all ages had the lowest rate of self-reported or parent-reported food allergies (9.5% [95% CI, 9.2%-9.9%]) compared with Asian (10.5% [95% CI, 9.1%-12.0%]), Hispanic (10.6% [95% CI, 9.7%-11.5%]), and non-Hispanic Black (10.6% [95% CI, 9.8%-11.5%]) individuals. The prevalence of common food allergens varied by race and ethnicity. Non-Hispanic Black individuals were most likely to report allergies to multiple foods (50.6% [95% CI, 46.1%-55.1%]). Asian and non-Hispanic White individuals had the lowest rates of severe food allergy reactions (Asian individuals, 46.9% [95% CI, 39.8%-54.1%] and non-Hispanic White individuals, 47.8% [95% CI, 45.9%-49.7%]) compared with individuals of other races and ethnicities. The prevalence of self-reported or parent-reported food allergies was lowest within households earning more than $150 000 per year (8.3% [95% CI, 7.4%-9.2%]).
Conclusions and relevance: This survey study of a US nationally representative sample suggests that the prevalence of food allergies was highest among Asian, Hispanic, and non-Hispanic Black individuals compared with non-Hispanic White individuals in the US. Further assessment of socioeconomic factors and corresponding environmental exposures may better explain the causes of food allergy and inform targeted management and interventions to reduce the burden of food allergies and disparities in outcomes.
Conflict of interest statement
Figures
References
Publication types
MeSH terms
Grants and funding
LinkOut - more resources
Full Text Sources
Medical
Miscellaneous
