Review
. 2023 Jun 14;16(1):253-284.
doi: 10.1146/annurev-anchem-091922-073057.

Recent Advances in Single-Molecule Tracking and Imaging Techniques

Affiliations
Review

Recent Advances in Single-Molecule Tracking and Imaging Techniques

Trung Duc Nguyen et al. Annu Rev Anal Chem (Palo Alto Calif). .

Abstract

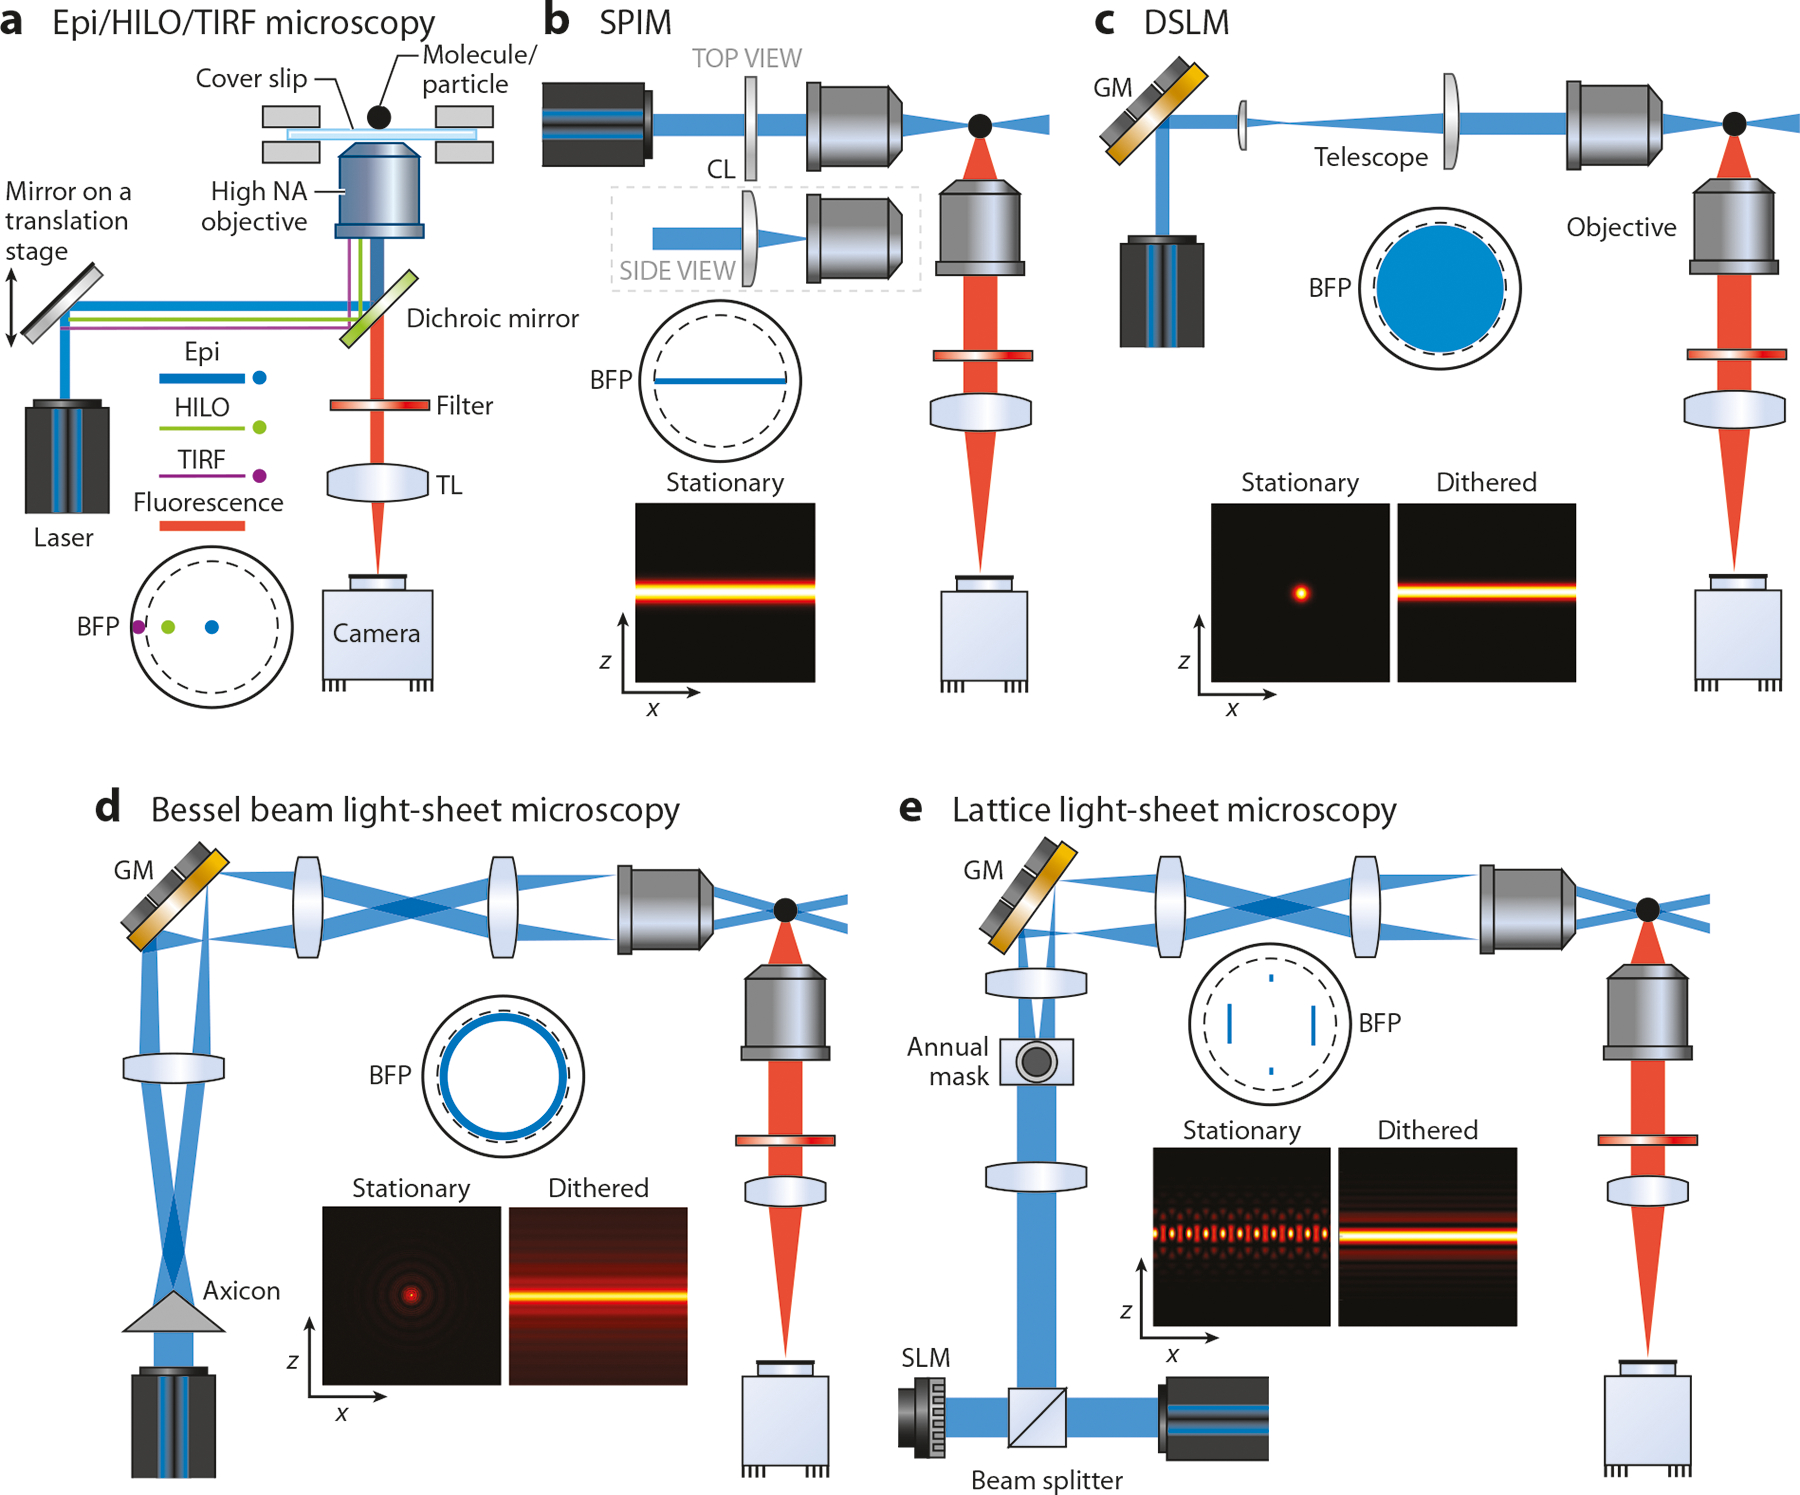
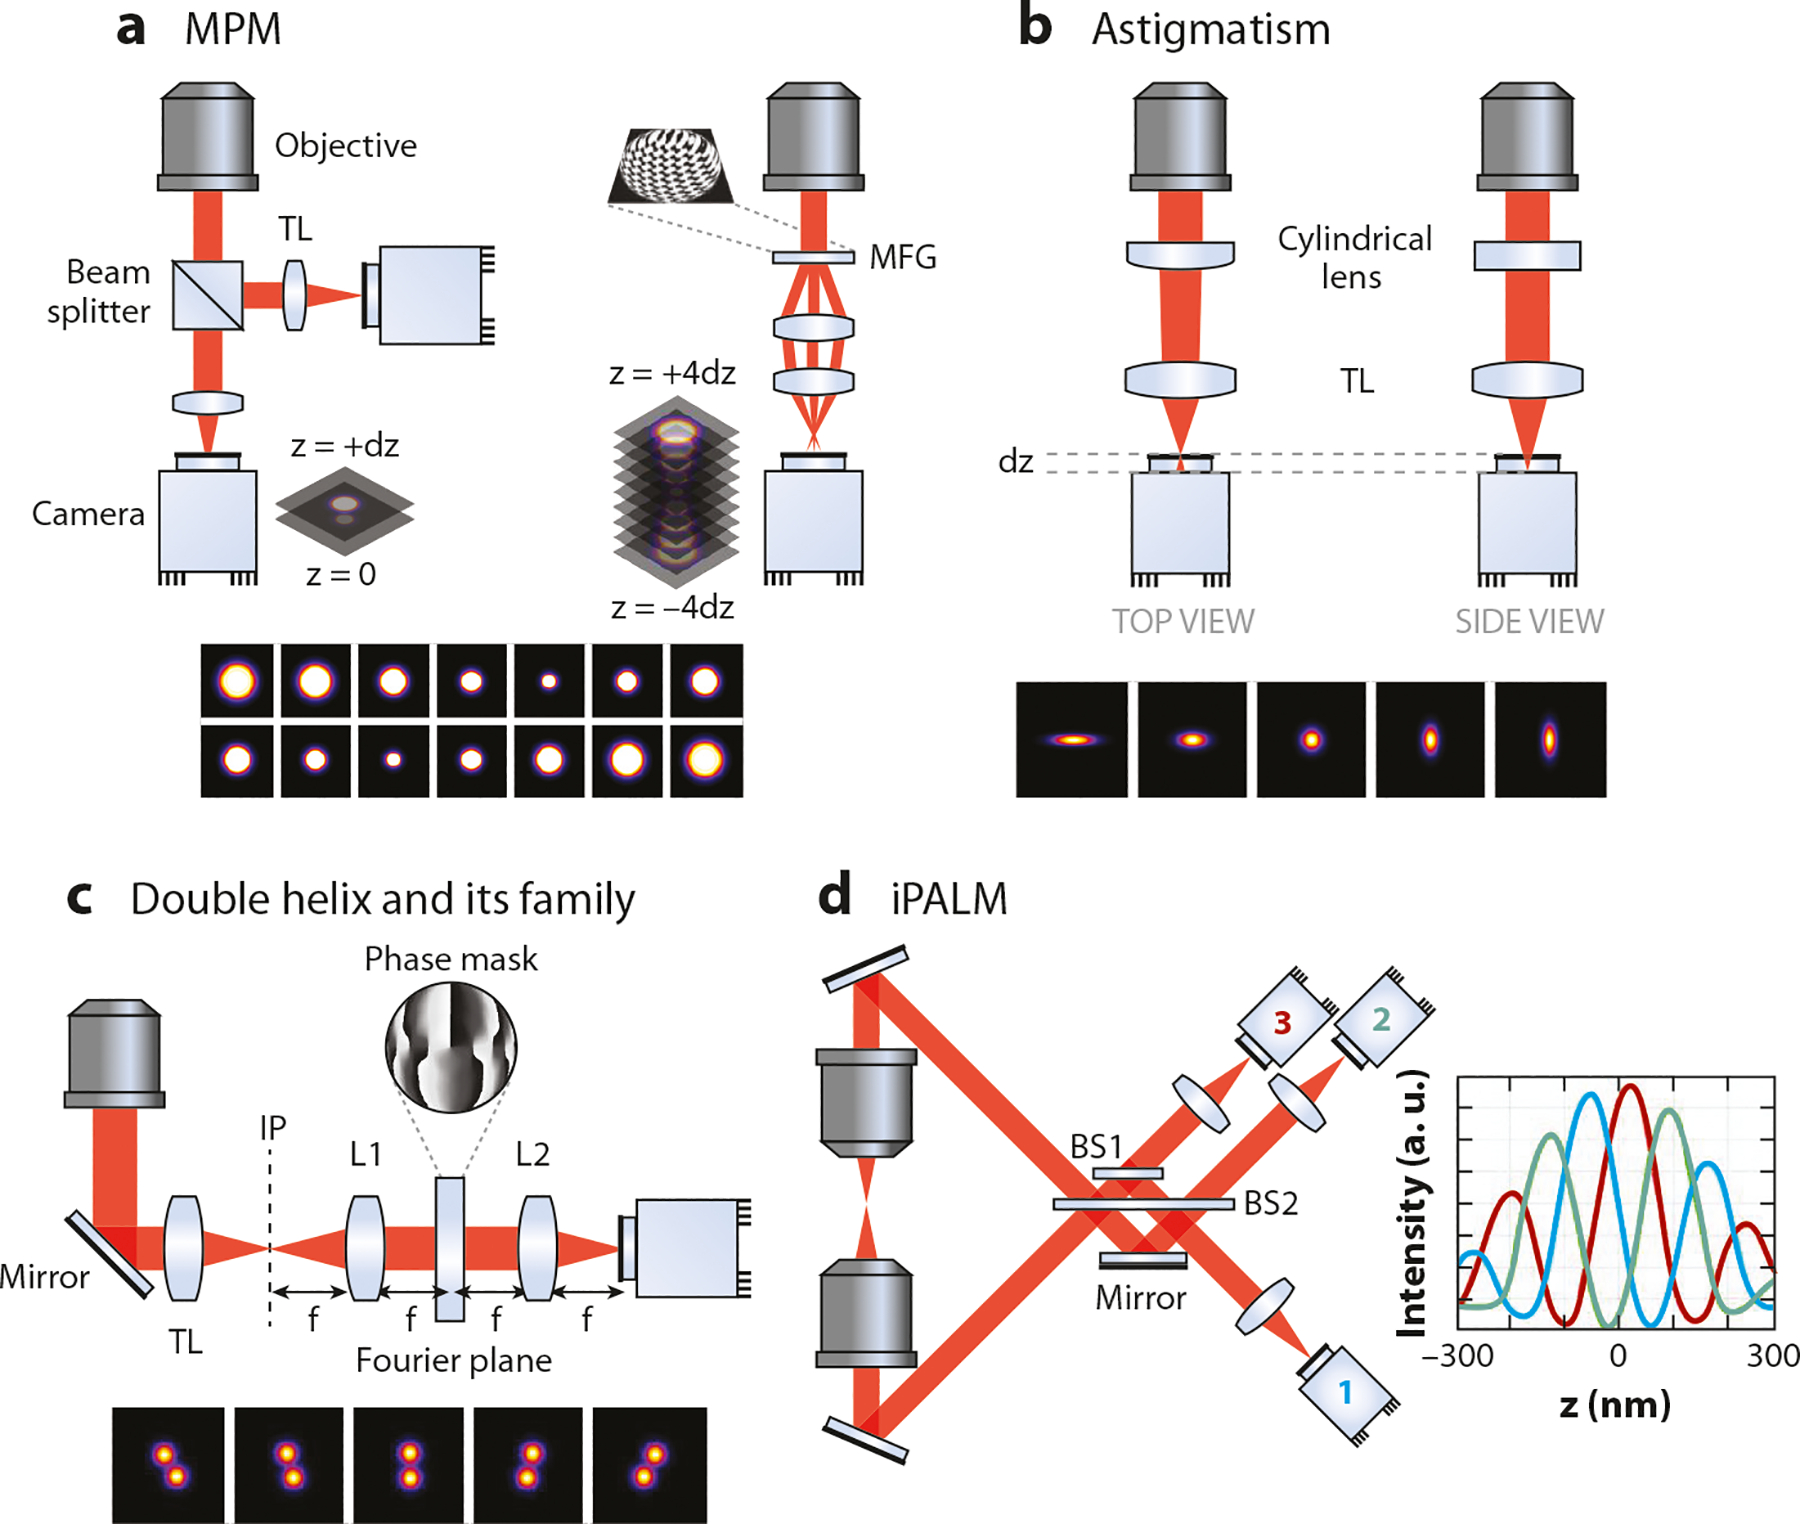
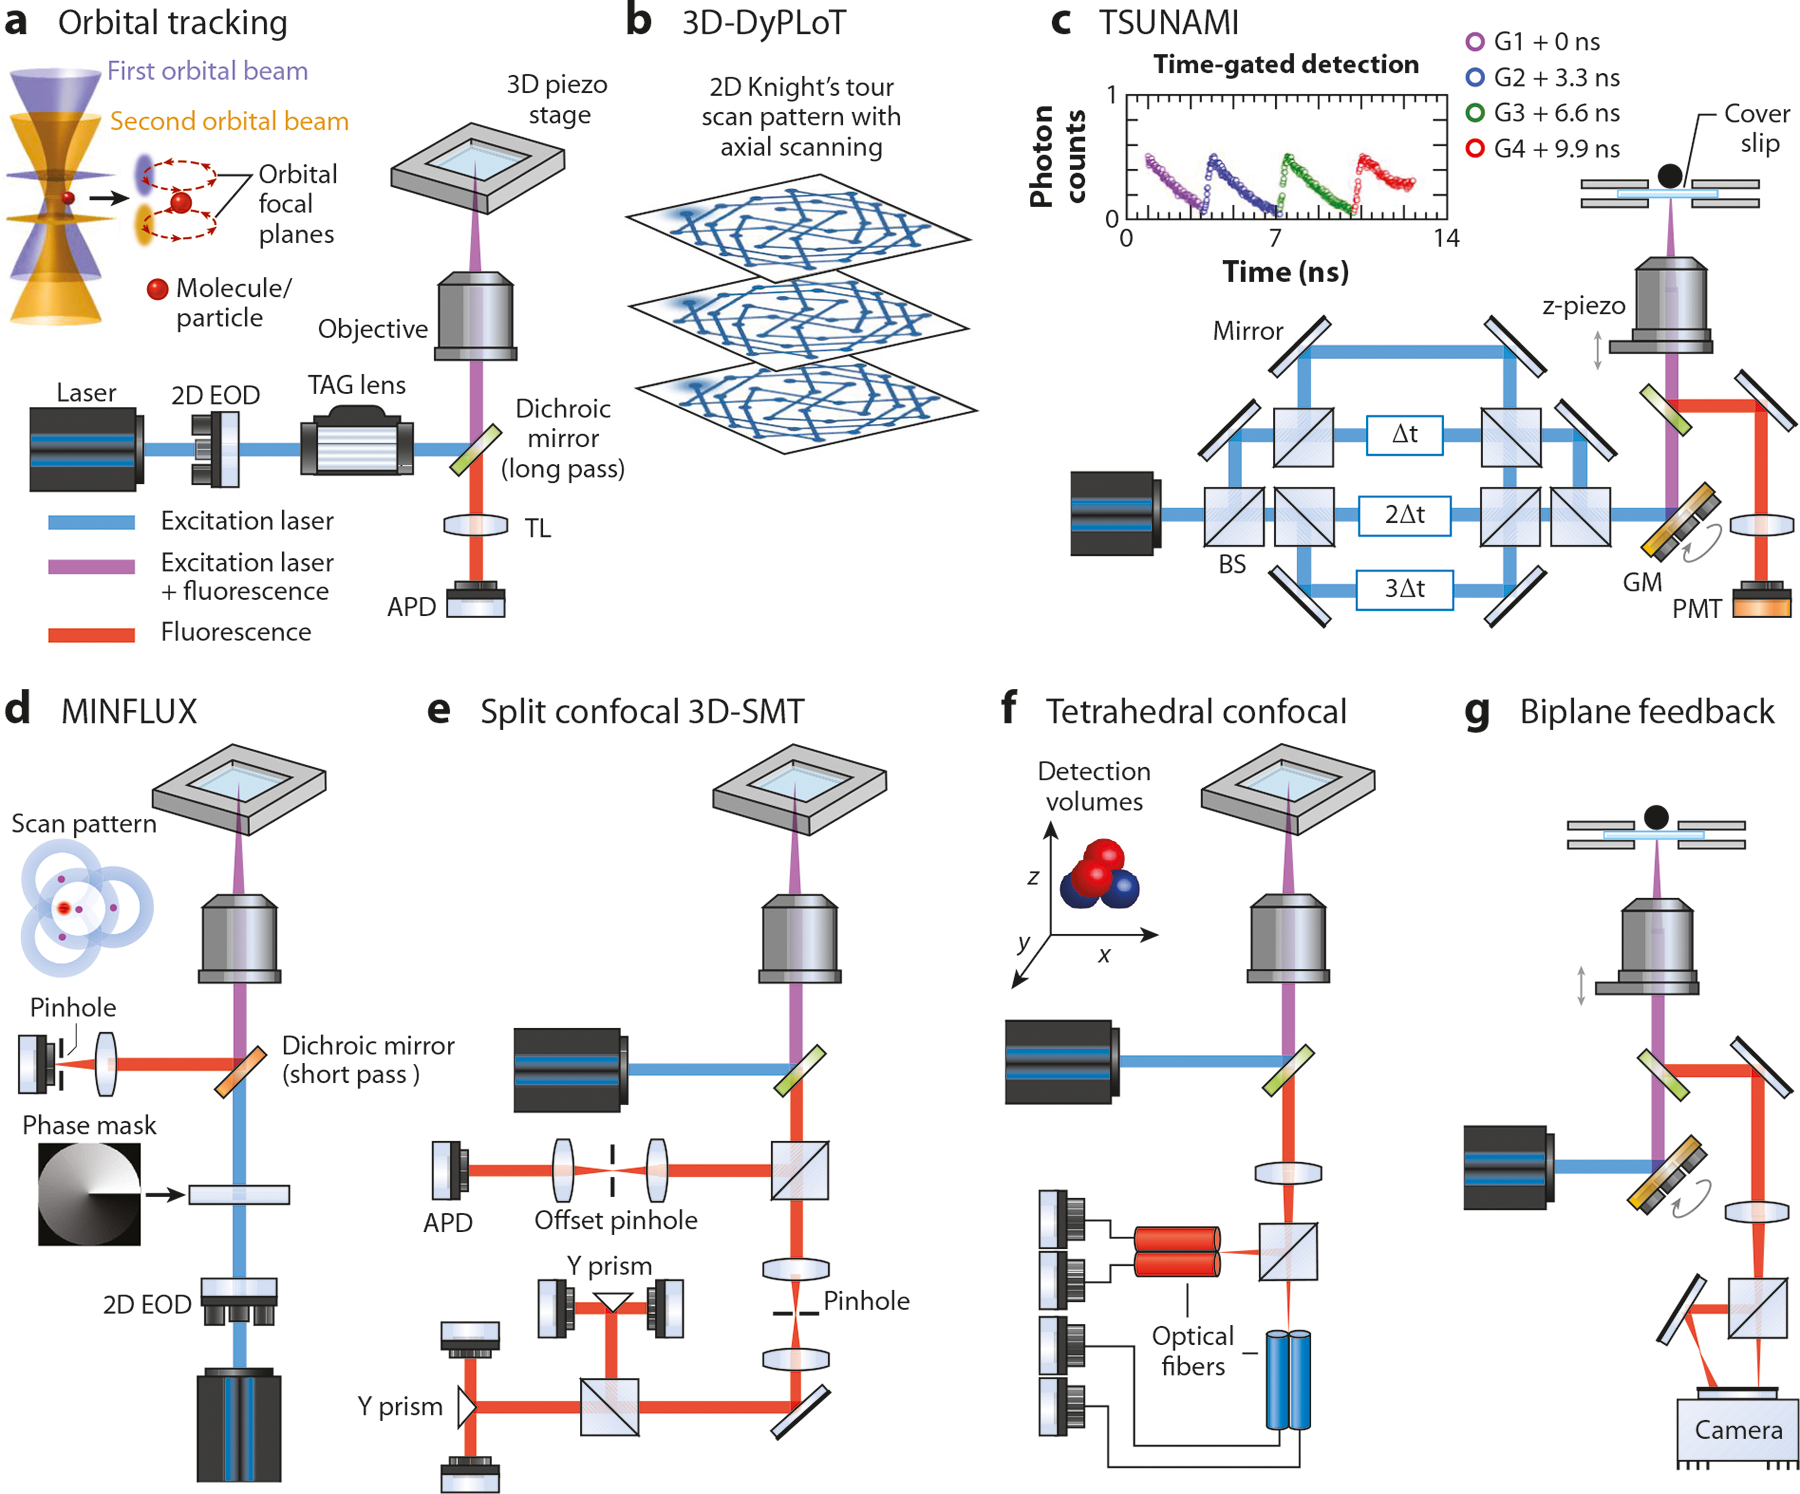
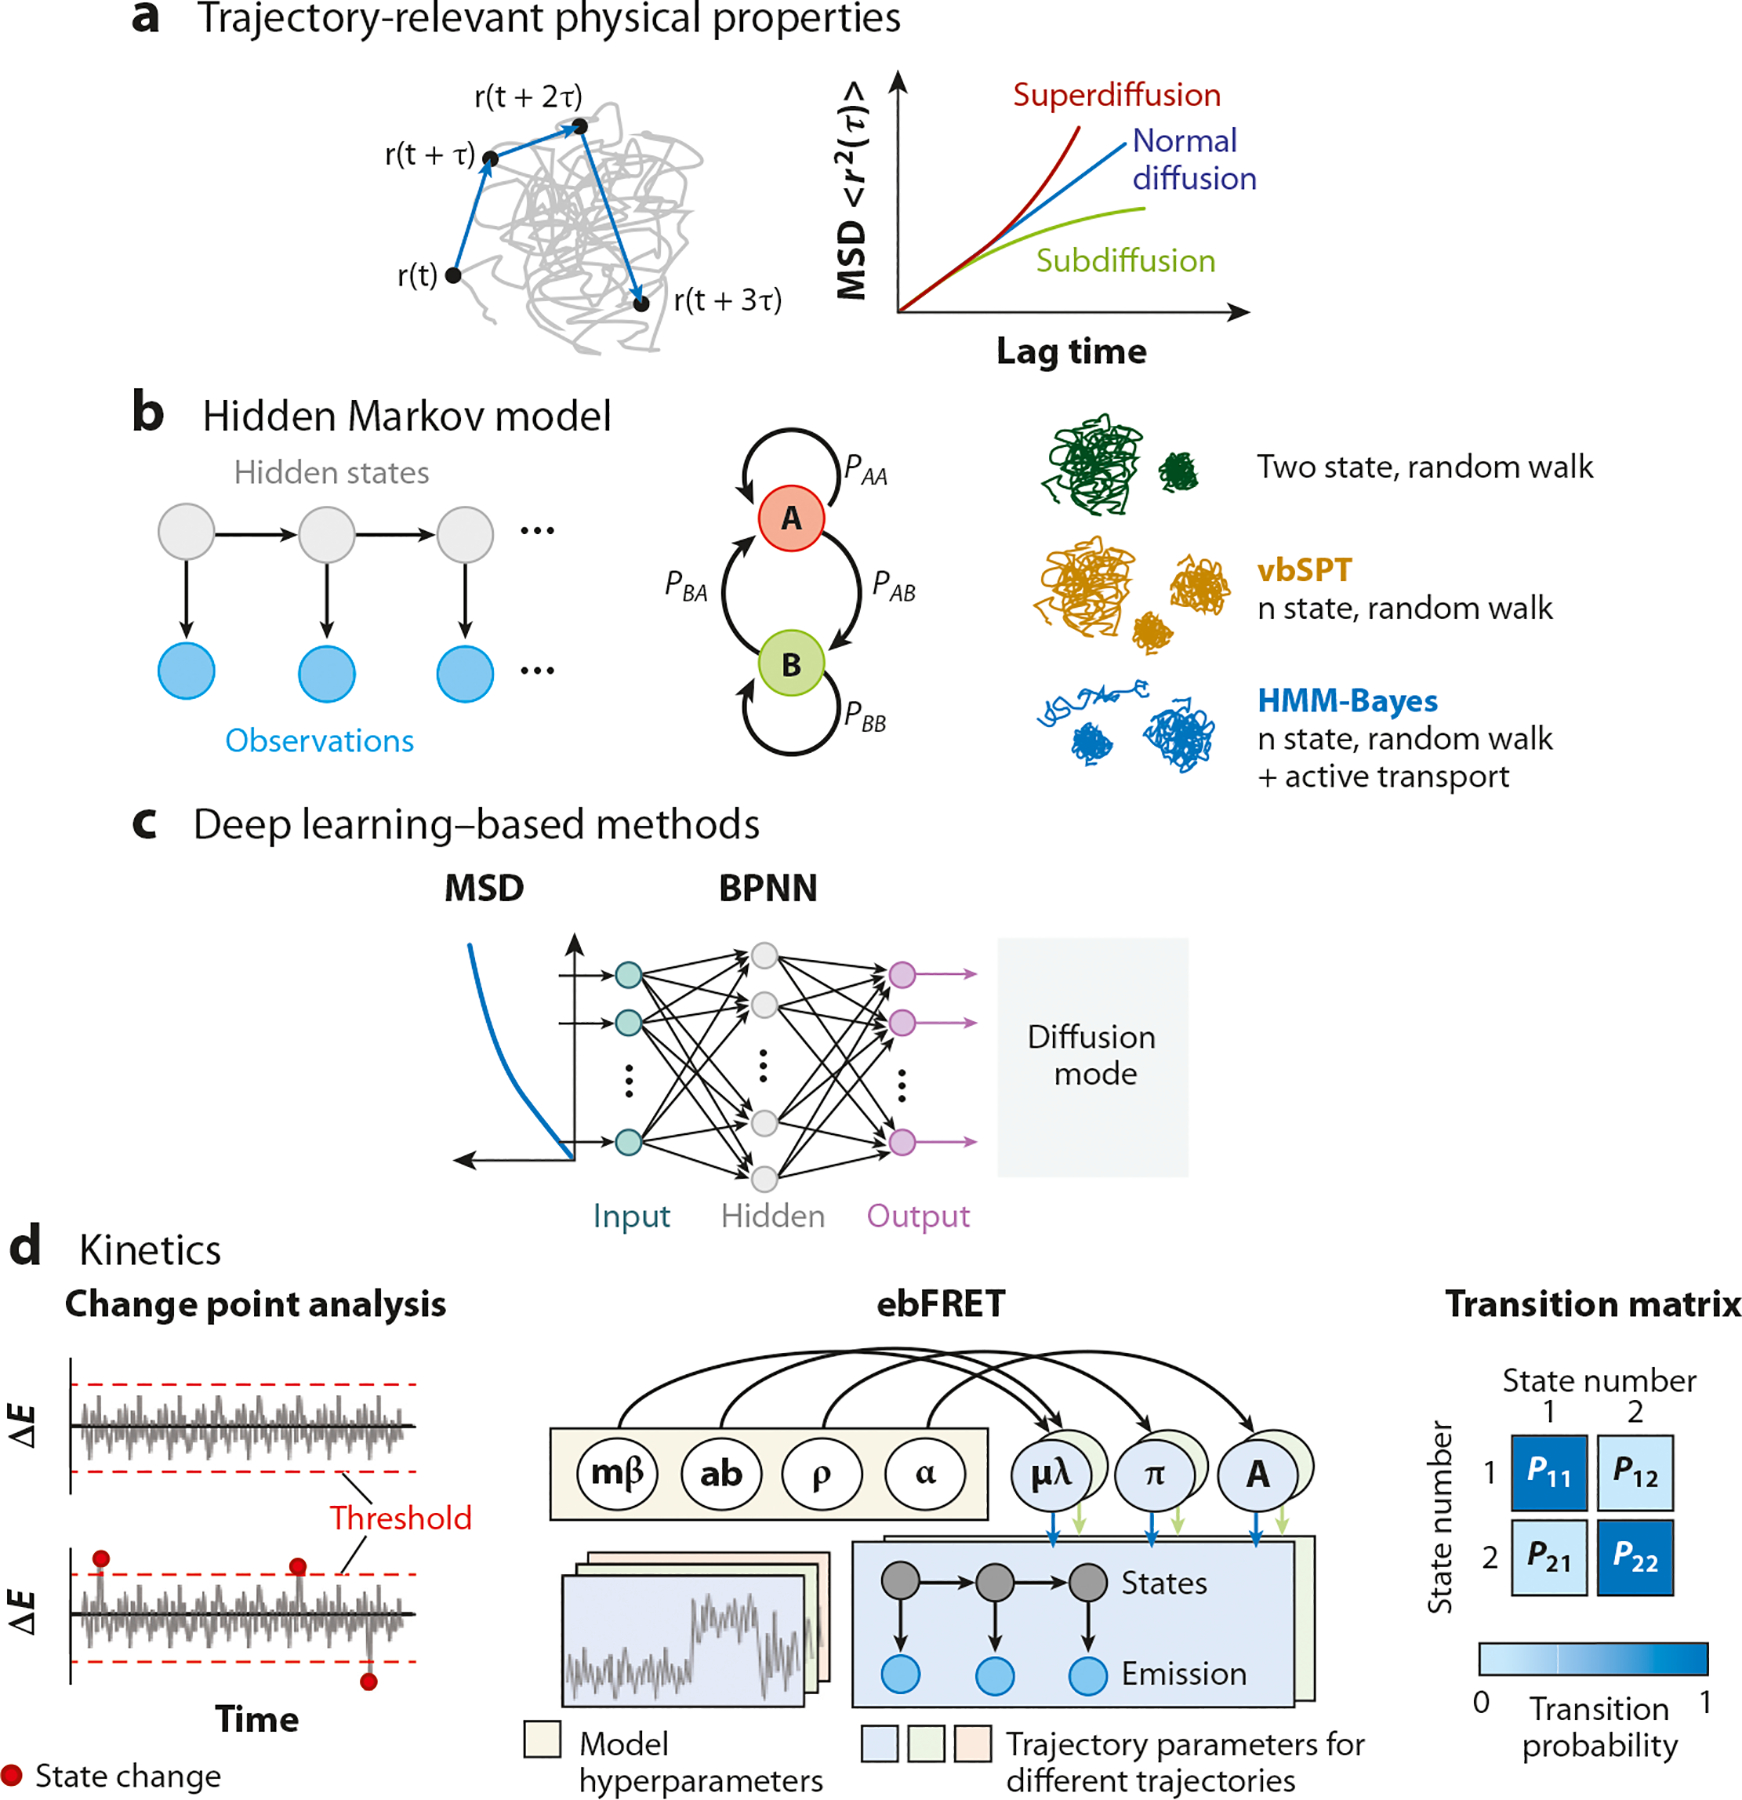
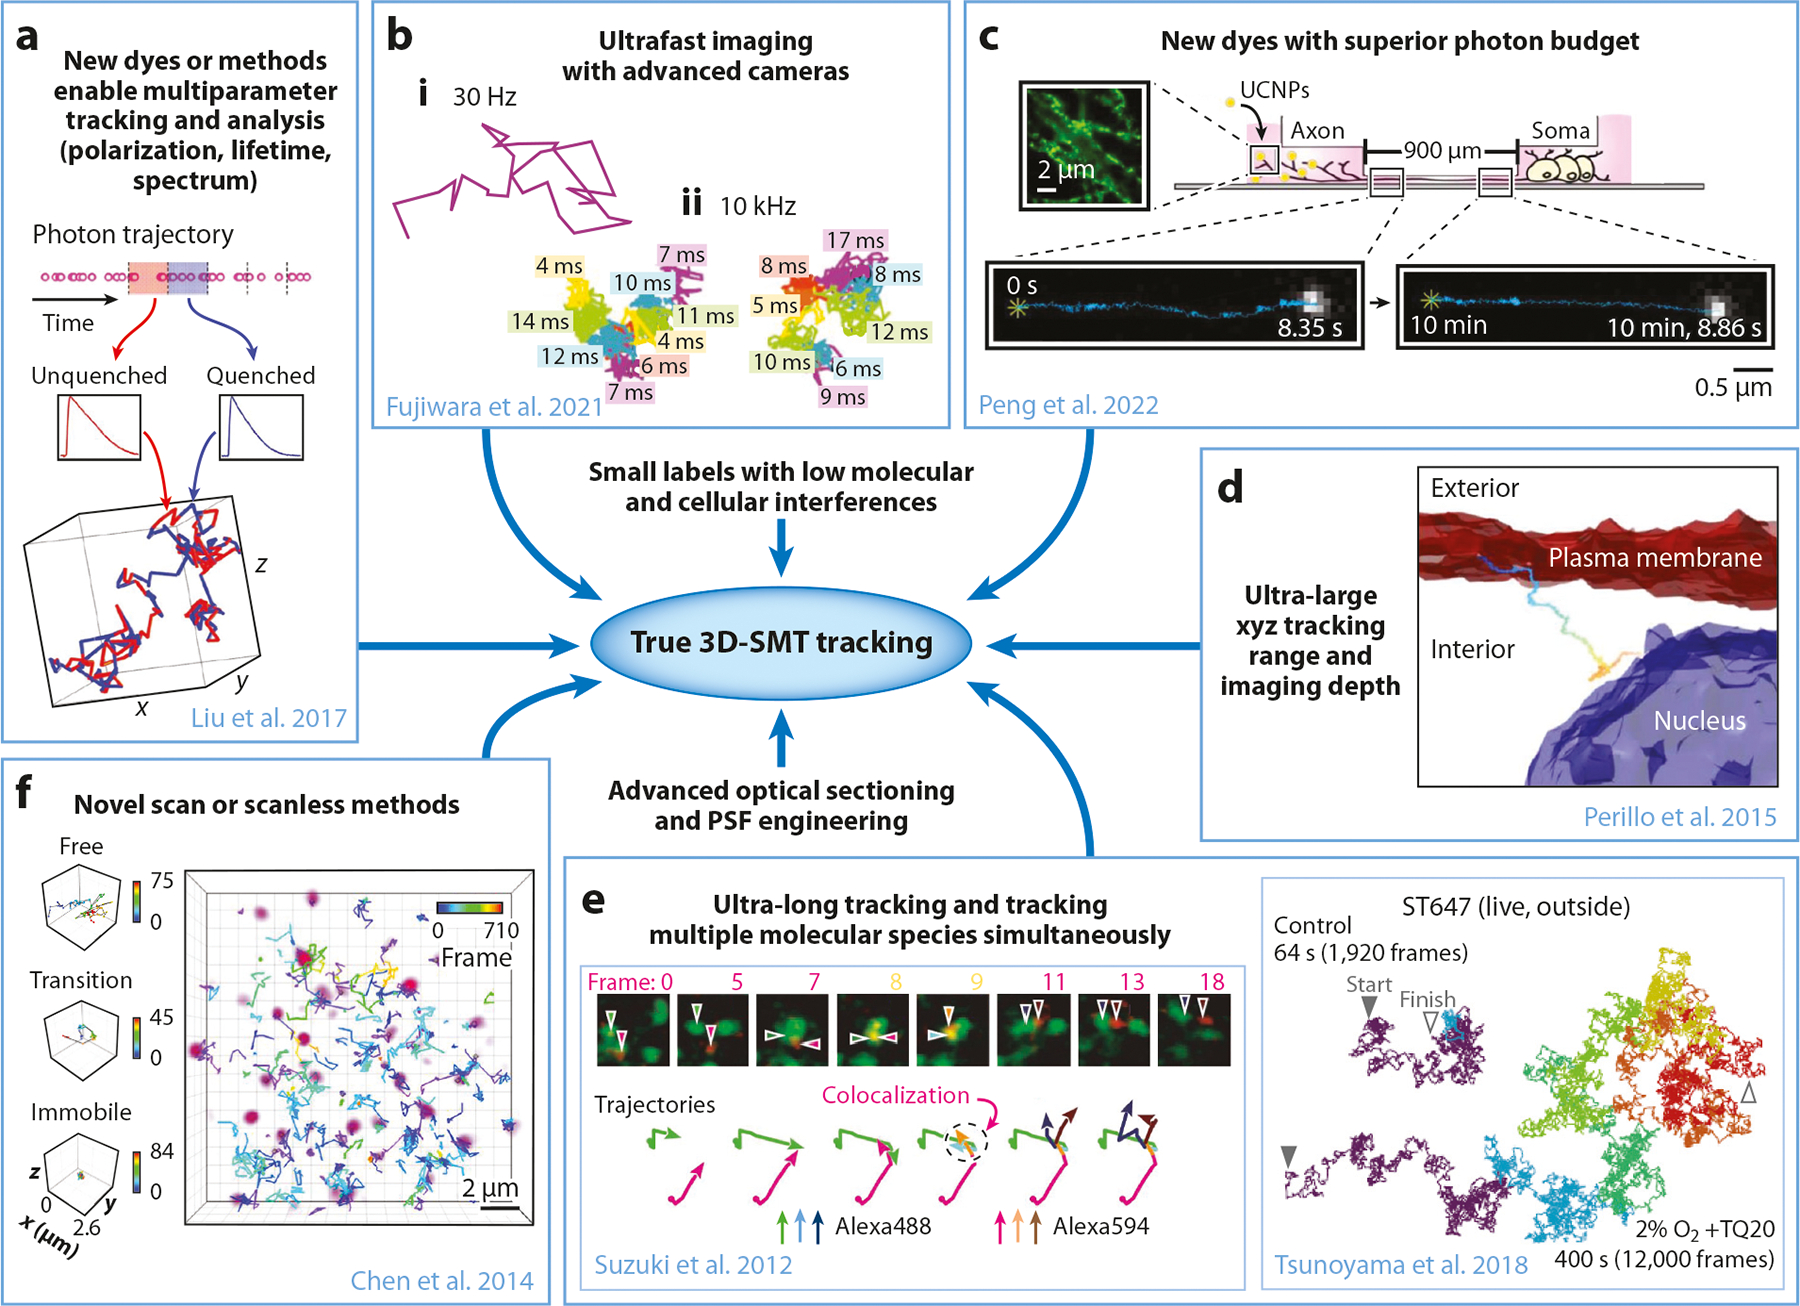
Since the early 1990s, single-molecule detection in solution at room temperature has enabled direct observation of single biomolecules at work in real time and under physiological conditions, providing insights into complex biological systems that the traditional ensemble methods cannot offer. In particular, recent advances in single-molecule tracking techniques allow researchers to follow individual biomolecules in their native environments for a timescale of seconds to minutes, revealing not only the distinct pathways these biomolecules take for downstream signaling but also their roles in supporting life. In this review, we discuss various single-molecule tracking and imaging techniques developed to date, with an emphasis on advanced three-dimensional (3D) tracking systems that not only achieve ultrahigh spatiotemporal resolution but also provide sufficient working depths suitable for tracking single molecules in 3D tissue models. We then summarize the observables that can be extracted from the trajectory data. Methods to perform single-molecule clustering analysis and future directions are also discussed.

Keywords: clustering analysis; feedback-control tracking; multiple plane microscopy; point-spread-function engineering; single-molecule tracking; trajectory analysis.


Figures

Figure 1
Figure 1
Different 2D-SMT and imaging techniques. (a) Epi/HILO/TIRF microscopy (87), HILO (80), and TIRF (88). (b) SPIM (83). (c) DSLM (89). (d) Bessel beam light-sheet microscopy (90). (e) Lattice light-sheet microscopy (91) for generating an ultrathin illumination plane and a large field of view. The dashed circle at the BFP denotes the critical angle position (assuming a glass/water interface). Abbreviations: 2D, two-dimensional; BFP, back focal plane; CL, cylindrical lens; DSLM, digital scanned laser light-sheet fluorescence microscopy; Epi, epiluminescence; GM, galvo mirror; HILO, highly inclined and laminated optical sheet; NA, numerical aperture; SLM, spatial light modulator; SMT, single-molecule tracking; SPIM, selective plane illumination microscopy; TIRF, total internal reflection fluorescence; TL, tube lens.
Figure 2
Figure 2
Different 3D-SMT and imaging techniques. (a) MPM: (left) biplane microscopy (92) and (right) 9-plane MPM (95). (b) PSF engineering with astigmatism (60, 102, 103). (c) PSF engineering using a phase mask in the Fourier plane (31, 104). L1 and L2: two lenses in the 4f system. (d) iPALM (96). Abbreviations: 3D, three-dimensional; BS1, 66:33 beam splitter; BS2, 50:50 beam splitter; dz, focus step between successive planes; f, lens focal length; IP, intermediate plane; iPALM, interferometric photoactivation and localization microscope; MFG, multifocus grating; MPM, multifocal plane microscopy; PSF, point-spread-function; TL, tube lens.
Figure 3
Figure 3
Different tracking modalities developed for 3D-SMT tracking. (a) Orbital tracking (129), (b) 3D-DyPLoT (132, 133), (c) TSUNAMI SMT (21, 136), (d) MINFLUX (–142), and (e) split confocal 3D-SMT (125, 126). (f) Tetrahedral confocal detection feedback tracking (127, 195). (g) Biplane feedback tracking (196). Abbreviations: 2D, two-dimensional; 3D, three-dimensional; APD, avalanche photodiode; BS, beam splitter; EOD, electro-optic deflector; GM, galvo mirror; PMT, photomultiplier tube; SMT, single-molecule tracking; TAG lens, tunable acoustic gradient index of refraction lens; TSUNAMI, tracking of single particles using nonlinear and multiplexed illumination.
Figure 4
Figure 4
Trajectory analysis methods. (a) Trajectory-relevant physical properties (156, 157). Each trajectory yields an MSD curve, which can be used to characterize the diffusion type. (b) HMM (149, 161, 162). HMM is a probabilistic model to predict the sequence of hidden states and observations, where each state can have different diffusion coefficients or types. (c) Deep learning–based methods (155). The BPNN or convolutional neural network can detect the local and transient diffusion behavior from hundreds of tracking data. (d) Algorithm to calculate molecular association/dissociation kinetics (11, 72, 164, 168). Change point analysis and ebFRET applied to the single-molecular trajectory allow characterization of kinetics information of the molecular interaction. Abbreviations: BPNN, back-propagation neural network; ebFRET, empirical Bayesian-based fluorescence resonance energy transfer; HMM, hidden Markov model; MSD, mean-squared displacement; vbSPT, variational Bayes single-particle tracking.
Figure 5
Figure 5
Roadmap to true 3D-SMT in live cells. (a) Spatiotemporally resolved single DNA annealing-melting kinetics measurement with fluorescence lifetime. In our DNA model system, the longer lifetime (from unquenched dye) represents the single-stranded DNA state (red segments) while the shorter lifetime (from quenched dye) indicates the double-stranded DNA state (blue segments). The acquired single-molecule lifetime trace is mapped onto the molecule’s 3D trajectory, providing the temporal and spatial information of annealing-melting events that take place along this 1,015-ms trajectory. Panel adapted with permission from Reference ; copyright 2017 Royal Society of Chemistry. (b) Typical single-molecule trajectories of Cy3-DOPE in intact apical plasma membranes recorded at (i) normal video rate and (ii) enhanced rates with advanced cameras. Panel adapted from Reference with permission from the authors. (c) UCNPs enabled superlong tracking of individual cargos transported by dynein motors in live neurons. Panel adapted with permission from Reference with permission from the authors. (d) 3D tracking of epidermal growth factor receptor complexes at a depth of ~100 μm in live tumor spheroids. This example trajectory shows slow diffusive transport in cytosol and interaction with the nucleus. Isocontours of the zoomed-in image stack taken 90 μm deep in a spheroid with plasma membrane (red) and nucleus (blue) are overlaid with the trajectory (rainbow path). Panel adapted with permission from Reference ; copyright 2015 Springer Nature. (e, right) Typical trajectories for ST647 molecules linked to CD47 in the live cell plasma membrane that could be tracked without photoblinking and photobleaching for periods longer than 400 s. (e, left) Typical two-color, single-molecule image sequences. CD59 and DAF molecules, labeled with Alexa488-Fab–CD59 (green) and Alexa594-Fab–DAF (red), respectively. The colocalization of two spots with different colors was determined by measuring the distances between the two determined coordinates. Panel adapted with permission from Reference , copyright 2018 Springer Nature; and Reference , copyright 2012 Springer Nature. (f) Volume rendering of 3D Sox2 single-molecule image (purple) superimposed with single-molecule trajectories generated by simultaneous multifocal plane microscopy. Three molecules with distinct behaviors were selectively displayed on the right (from top to bottom: freely diffusing particle, particle undergoing a free/bound transition, and immobile molecule). Color bar shows the corresponding frame number. Panel adapted with permission from Reference ; copyright 2014 Elsevier. Abbreviations: 3D, three-dimensional; PSF, point-spread-function; SMT, single-molecule tracking; UCNP, upconversion nanoparticle.

Similar articles

Cited by

References

    1. Dovichi NJ, Martin JC, Jett JH, Trkula M, Keller RA. 1984. Laser-induced fluorescence of flowing samples as an approach to single-molecule detection in liquids. Anal. Chem 56:348–54 - PubMed
    1. Peck K, Stryer L, Glazer AN, Mathies RA. 1989. Single-molecule fluorescence detection—autocorrelation criterion and experimental realization with phycoerythrin. PNAS 86:4087–91 - PMC - PubMed
    1. Keller RA, Ambrose WP, Goodwin PM, Jett JH, Martin JC, Wu M. 1996. Single-molecule fluorescence analysis in solution. Appl. Spectrosc 50:12A–32A
    1. Shera EB, Seitzinger NK, Davis LM, Keller RA, Soper SA. 1990. Detection of single fluorescent molecules. Chem. Phys. Lett 174:553–57
    1. Soper SA, Shera EB, Martin JC, Jett JH, Hahn JH, et al. 1991. Single-molecule detection of Rhodamine 6G in ethanolic solutions using continuous wave laser excitation. Anal. Chem 63:432–37

Publication types

LinkOut - more resources