. 2023 Jun 14;19(6):e1011219.
doi: 10.1371/journal.pcbi.1011219. eCollection 2023 Jun.

Stochastic simulations of self-organized elastogenesis in the developing lung

Affiliations

Stochastic simulations of self-organized elastogenesis in the developing lung

Xiru Fan et al. PLoS Comput Biol. .

Abstract

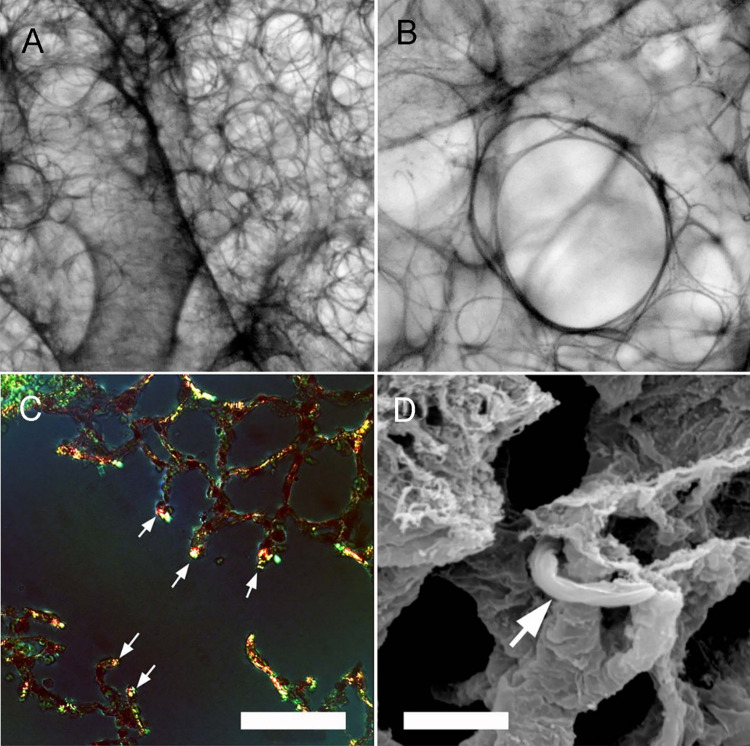
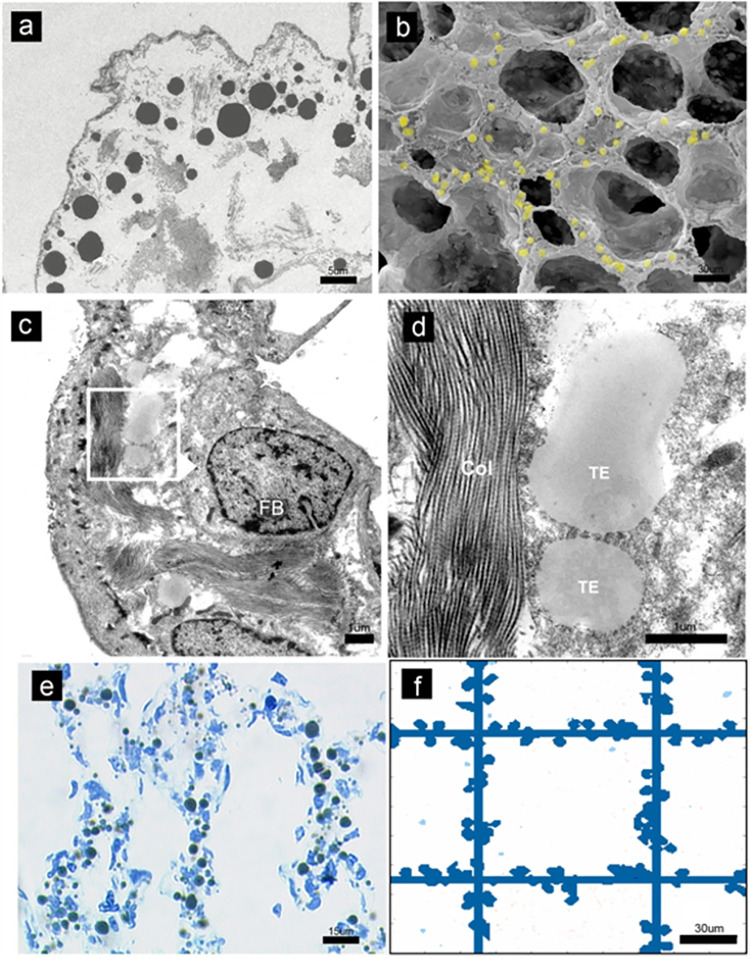
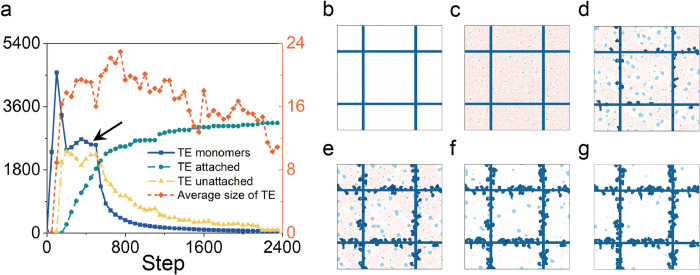
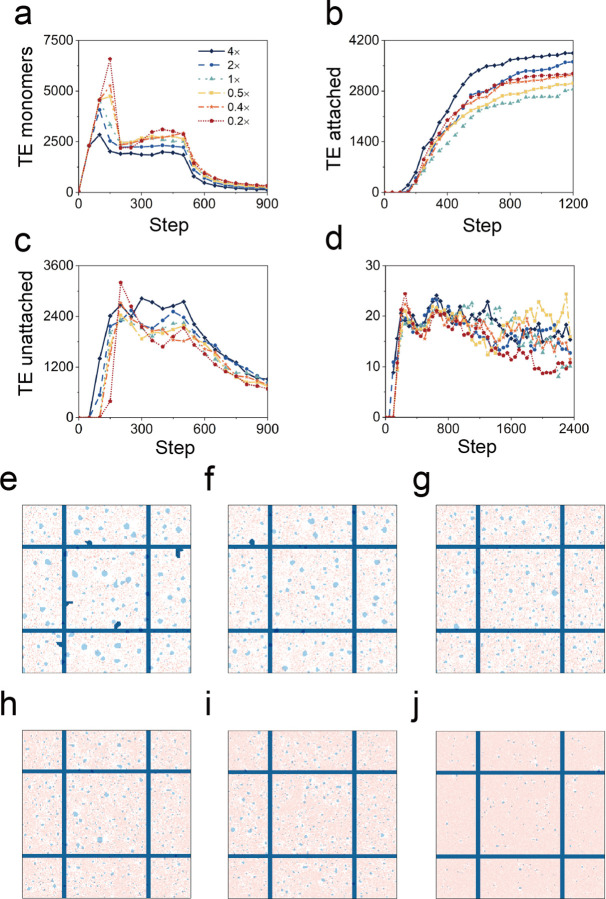
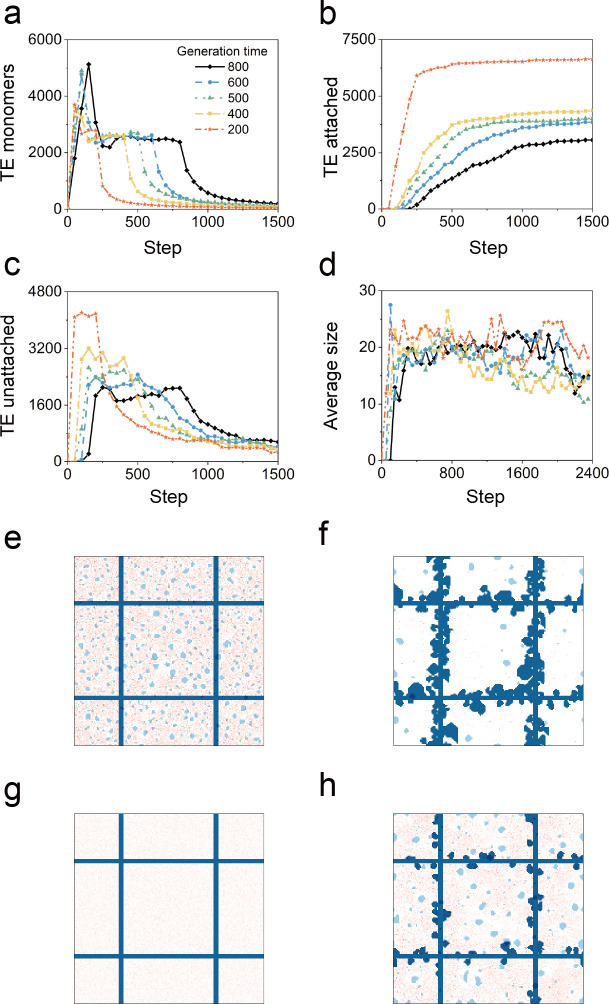
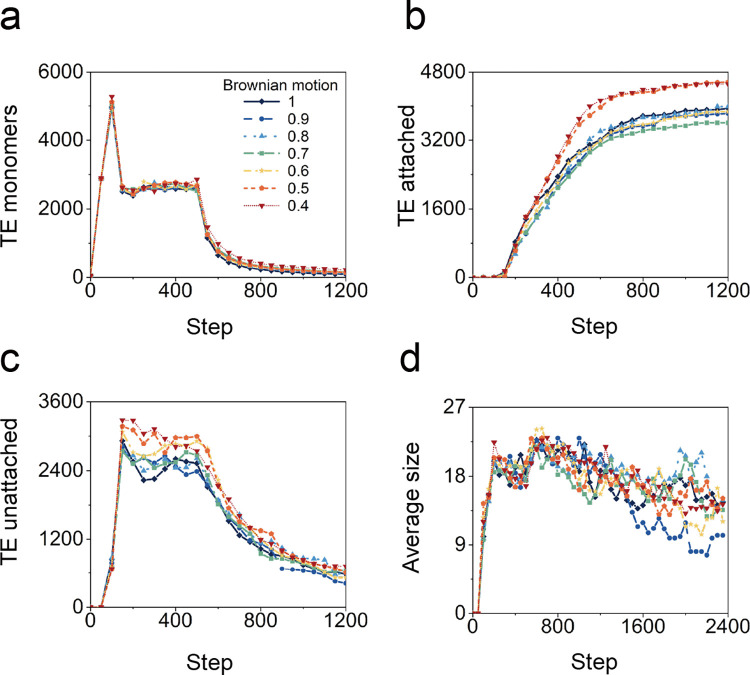
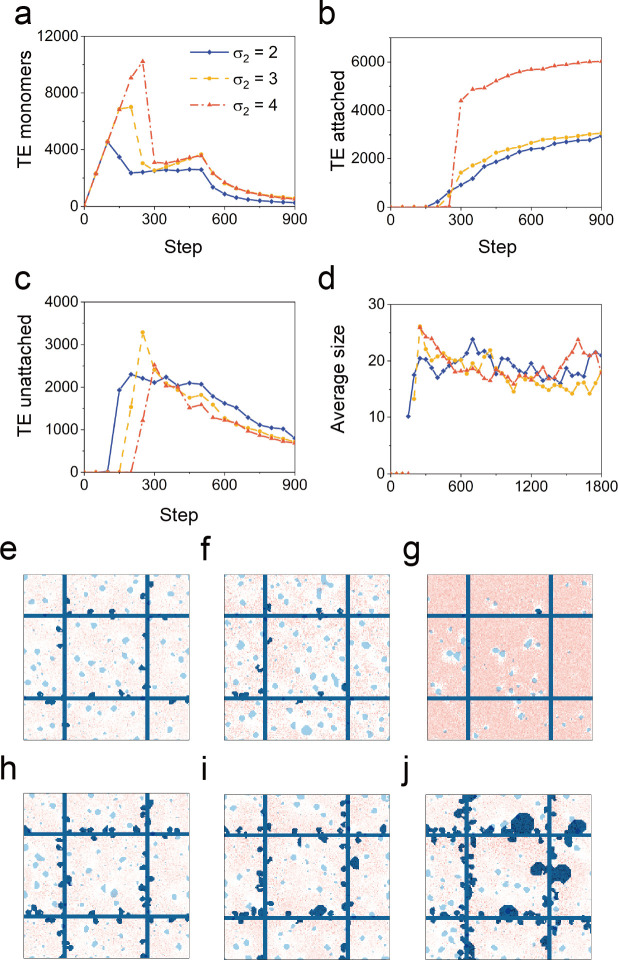
In the normal lung, the dominant cable is an elastic "line element" composed of elastin fibers bound to a protein scaffold. The cable line element maintains alveolar geometry by balancing surface forces within the alveolus and changes in lung volume with exercise. Recent work in the postnatal rat lung has suggested that the process of cable development is self-organized in the extracellular matrix. Early in postnatal development, a blanket of tropoelastin (TE) spheres appear in the primitive lung. Within 7 to 10 days, the TE spheres are incorporated into a distributed protein scaffold creating the mature cable line element. To study the process of extracellular assembly, we used cellular automata (CA) simulations. CA simulations demonstrated that the intermediate step of tropoelastin self-aggregation into TE spheres enhanced the efficiency of cable formation more than 5-fold. Similarly, the rate of tropoelastin production had a direct impact on the efficiency of scaffold binding. The binding affinity of the tropoelastin to the protein scaffold, potentially reflecting heritable traits, also had a significant impact on cable development. In contrast, the spatial distribution of TE monomer production, increased Brownian motion and variations in scaffold geometry did not significantly impact simulations of cable development. We conclude that CA simulations are useful in exploring the impact of concentration, geometry, and movement on the fundamental process of elastogenesis.


Conflict of interest statement

The authors declare that they have no competing interests.

Figures

Fig 1
Fig 1
Lung elastic line element examined in a decellularized lung by light (A,B), fluorescence (C) and scanning electron microscopy (SEM) (D). (C) Fluorescence microscopy of thin tissue sections stained with Sirius red demonstrating red/orange collagen birefringence as well as green elastin staining at septal tips (white arrows)(bar = 100 um). (D) SEM of the line element demonstrated a central cable encased in basement membrane (bar = 2 um). Images from Wagner et al are reproduced with permission of Wiley & Sons [3].
Fig 2
Fig 2. Length scales in vivo and in silico.
(a) Numerous electron-dense TE-spheres are seen within the primary septa of the rat lung by transmission electron microscopy (TEM). (b) Scanning electron microscopy demonstrated that the TE-spheres were located within the primary sept (P4, shown; yellow pseudocoloring for presentation purposes). (c) TEM demonstrating prominent extracellular fiber interaction with the TE-spheres in the lung (FB = fibroblast). (d) Magnified view of TE-spheres interacting with the protein scaffold (Col = collagen; TE = tropoelastin). (e) Azure blue staining demonstrating the distribution of the spheres within the primary septa. (f) The length scale of the simulations was designed to reflect the experimental observations. The images reflect most steps in the simulation: step 3 (panel b and c); step 4 (panel d and e). Images from Valenzuela et al are reproduced with permission of Wiley & Sons. [10].
Fig 3
Fig 3. Overview of TE dynamics with standard parameters.
(a) The production of TE monomers (dark blue) was associated with a dynamic plateau (arrow). The aggregation of TE monomers or TE monomer binding to the protein scaffold resulted in a subsequent plateau of bound elastin (green) and reciprocal decline in unbound TE monomers (yellow). The average size of TE aggregated decreased with time (orange). The simulation images at (b) step = 1, (c) step = 100, (d) step = 200, (e) step = 500, (f) step = 800, and (g) step = 2400. The red color represents the contents of the TE monomer. Each light blue sphere represents a TE. Dark blue lines represent the collagen fibers. Dark blue circle presents the attached TE spheres.
Fig 4
Fig 4. Effects of the spatial distributions of TE monomer production.
The total number of TE monomers being produced was kept constant. The spatial concentration of TE monomer production was varied over a 20-fold range. (a) The total area of TE monomers was plotted as a function of spatial distribution with the less concentrated conditions (red) demonstrating a higher peak of TE monomer area than the more concentrated conditions (blue). The number of (b) attached TE spheres, (c) unattached TE spheres, and (d) the average size of unattached TE spheres varied only modestly with spatial distribution. Simulation images at step = 150 with different combinations of spatial distribution and production rates; that is, 4x (e), 2x (f), 1x, (g) 0.5x, (h) 0.4x (i), and 0.2x (j).
Fig 5
Fig 5. Effects of varied production rates of the TE monomers.
The TE monomers were produced with uniform distribution over a 4-fold time scale. Simulation images at (e) step = 50, (f) step = 750 when the production time is 200 steps and at (g) step = 50, (h) step = 750 when the production time is 800 steps.
Fig 6
Fig 6. Effects of the Brownian motion when the spatial distribution of TE particles production is uniform.
The dependence of the number of (a) TE particle, (b) attached TE spheres, (c) unattached TE spheres, and (d) the average size of unattached TE spheres on time step with different production time.
Fig 7
Fig 7. Effects of aggregation affinity (σ2).
The dependence of the number of (a) TE particle, (b) attached TE spheres, (c) unattached TE spheres, and (d) the average size of unattached TE spheres on time step with different production time. Simulation images at (e) step = 250, (h) step = 400 when σ2 = 2 at (f) step = 250, (i) step = 400 when σ2 = 3, and at (g) step = 250, (j) step = 400 when σ2 = 4.

Similar articles

References

    1. Ozsvar J, Yang C, Cain SA, Baldock C, Tarakanova A, Weiss AS. Tropoelastin and elastin assembly. Frontiers in Bioengineering and Biotechnology. 2021;9:643110. doi: 10.3389/fbioe.2021.643110 - DOI - PMC - PubMed
    1. Butler JP, Oldmixon EH, Hoppin FG. Dihedral angles of septal “bend” structures in lung parenchyma. J Appl Physiol. 1996;81(4):1800–6. ISI:A1996VM56300050. doi: 10.1152/jappl.1996.81.4.1800 - DOI - PubMed
    1. Wagner W, Bennett RD, Ackermann M, Ysasi AB, Belle JM, Valenzuela CD, et al.. Elastin cables define the axial connective tissue system in the murine lung. Anat Rec. 2015;298:1960–8. doi: 10.1002/ar.23259 - DOI - PMC - PubMed
    1. Weibel ER. Commentaries on viewpoint: Unresolved mysteries change the perspective! J Appl Physiol. 2012;113(12):1948-. WOS:000312499900016. - PubMed
    1. Bachofen H, Ammann A, Wangensteen D, Weibel ER. Perfusion fixation of lungs for structure-function analysis—credits and limitations. J Appl Physiol. 1982;53(2):528–33. WOS:A1982PB93100034. doi: 10.1152/jappl.1982.53.2.528 - DOI - PubMed

Publication types