

Improved multivariate modeling for soil organic matter content estimation using hyperspectral indexes and characteristic bands
- PMID: 37315071
- PMCID: PMC10266645
- DOI: 10.1371/journal.pone.0286825
Improved multivariate modeling for soil organic matter content estimation using hyperspectral indexes and characteristic bands
Abstract
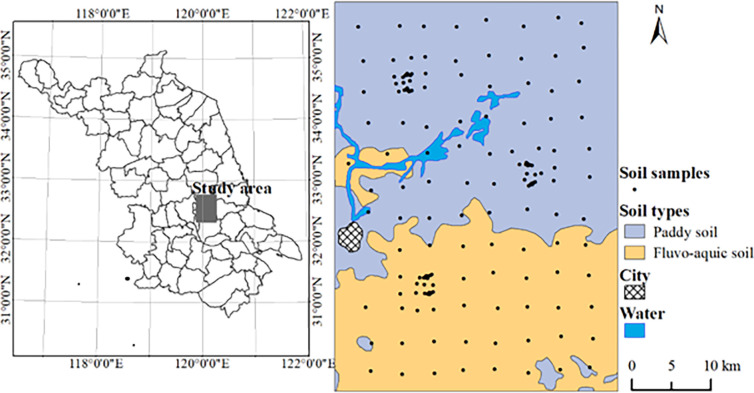
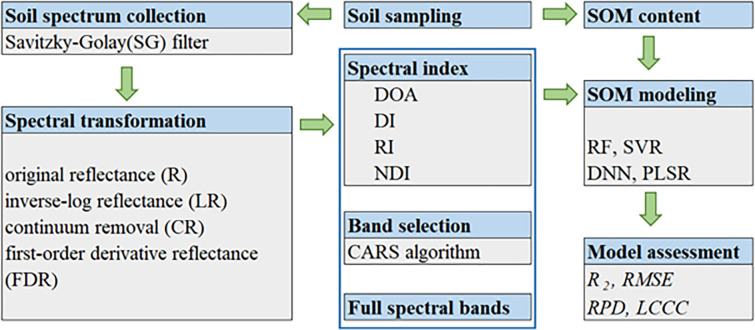
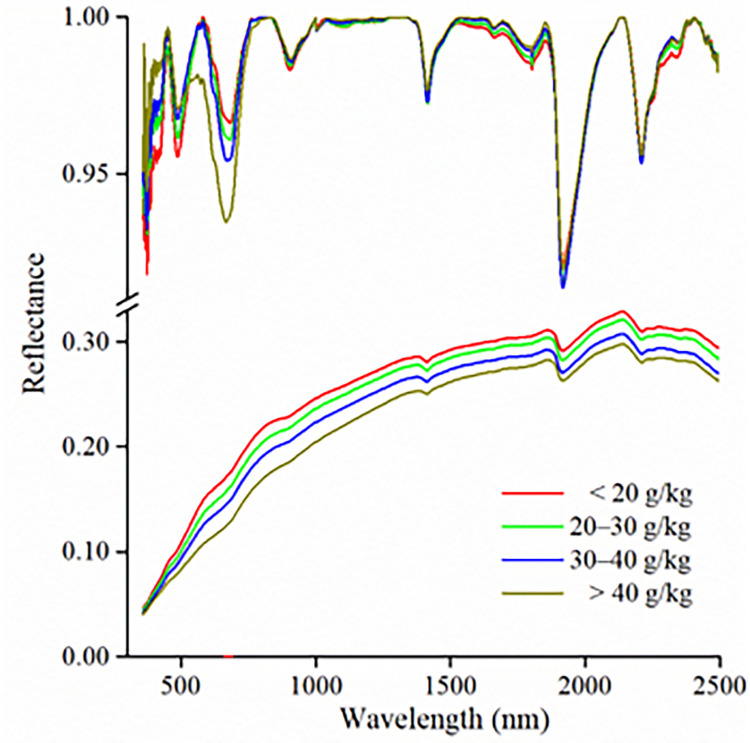
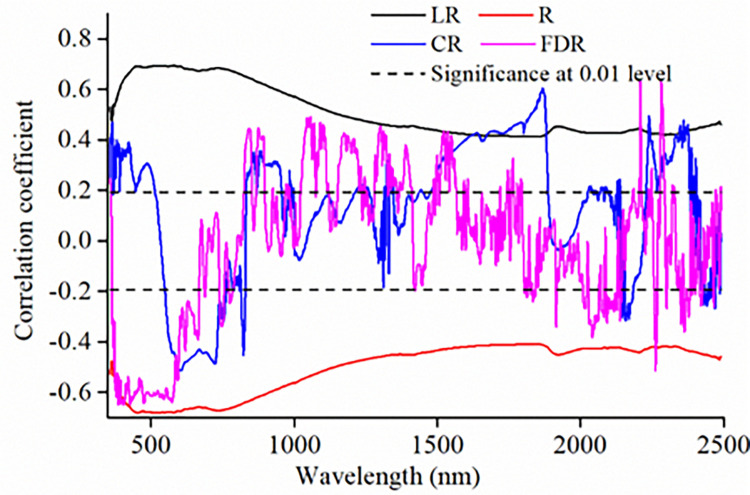
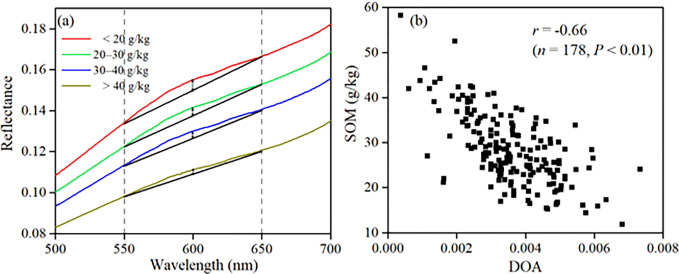
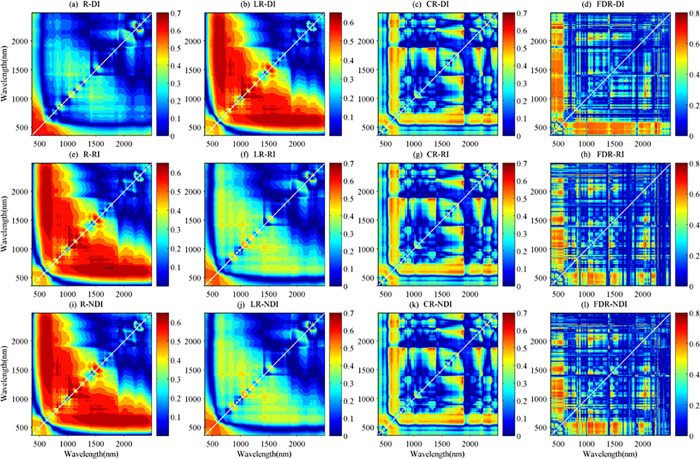
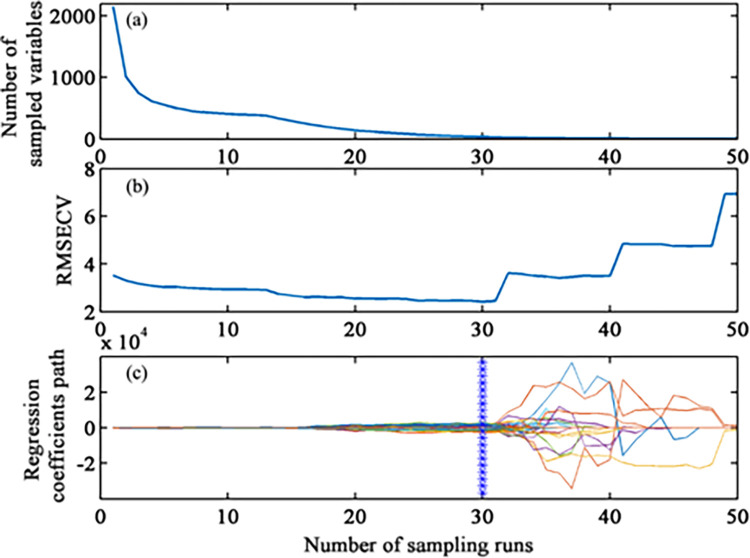
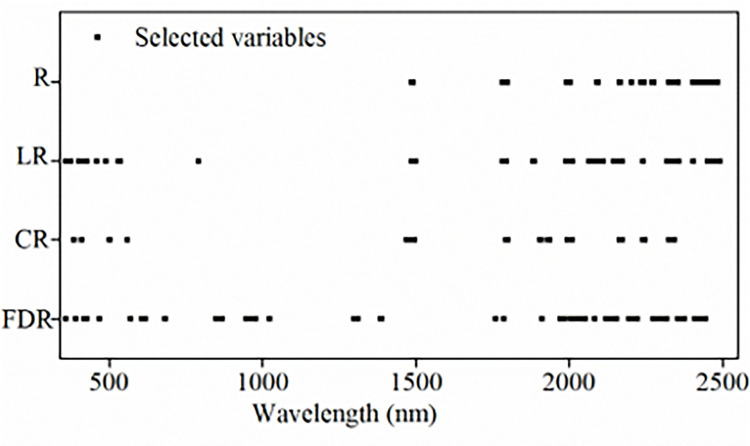
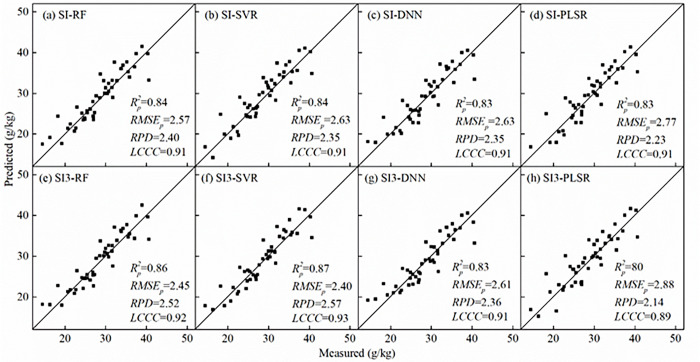
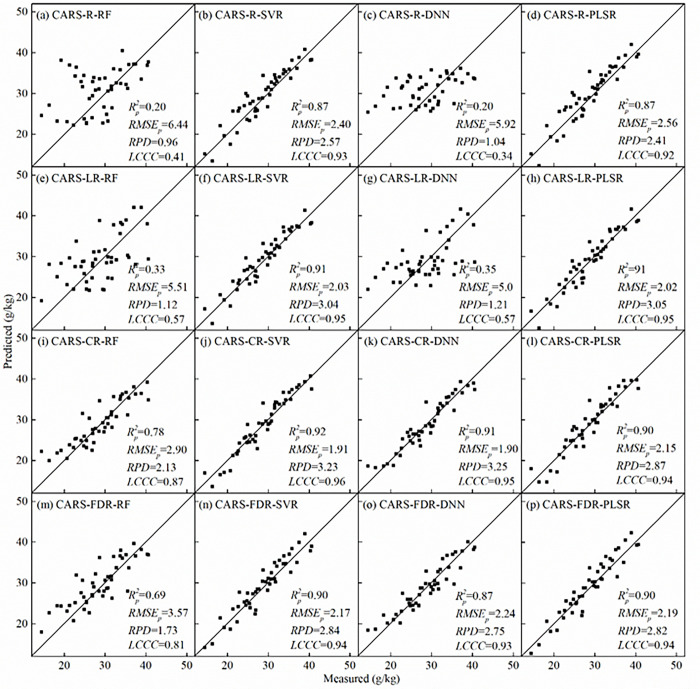
Soil organic matter (SOM) is a key index of soil fertility. Calculating spectral index and screening characteristic band reduce redundancy information of hyperspectral data, and improve the accuracy of SOM prediction. This study aimed to compare the improvement of model accuracy by spectral index and characteristic band. This study collected 178 samples of topsoil (0-20 cm) in the central plain of Jiangsu, East China. Firstly, visible and near-infrared (VNIR, 350-2500 nm) reflectance spectra were measured using ASD FieldSpec 4 Std-Res spectral radiometer in the laboratory, and inverse-log reflectance (LR), continuum removal (CR), first-order derivative reflectance (FDR) were applied to transform the original reflectance (R). Secondly, optimal spectral indexes (including deviation of arch, difference index, ratio index, and normalized difference index) were calculated from each type of VNIR spectra. Characteristic bands were selected from each type of spectra by the competitive adaptive reweighted sampling (CARS) algorithm, respectively. Thirdly, SOM prediction models were established based on random forest (RF), support vector regression (SVR), deep neural networks (DNN) and partial least squares regression (PLSR) methods using optimal spectral indexes, denoted here as SI-based models. Meanwhile, SOM prediction models were established using characteristic wavelengths, denoted here as CARS-based models. Finally, this research compared and assessed accuracy of SI-based models and CARS-based models, and selected optimal model. Results showed: (1) The correlation between optimal spectral indexes and SOM was enhanced, with absolute value of correlation coefficient between 0.66 and 0.83. The SI-based models predicted SOM content accurately, with the coefficient of determination (R2) and root mean square error (RMSE) values ranging from 0.80 to 0.87, 2.40 g/kg to 2.88 g/kg in validation sets, and relative percent deviation (RPD) value between 2.14 and 2.52. (2) The accuracy of CARS-based models differed with models and spectral transformations. For all spectral transformations, PLSR and SVR combined with CARS displayed the best prediction (R2 and RMSE values ranged from 0.87 to 0.92, 1.91 g/kg to 2.56 g/kg in validation sets, and RPD value ranged from 2.41 to 3.23). For FDR and CR spectra, DNN and RF models achieved more accuracy (R2 and RMSE values ranged from 0.69 to 0.91, 1.90 g/kg to 3.57 g/kg in validation sets, and RPD value ranged from 1.73 to 3.25) than LR and R spectra (R2 and RMSE values from 0.20 to 0.35, 5.08 g/kg to 6.44 g/kg in validation sets, and RPD value ranged from 0.96 to 1.21). (3) Overall, the accuracy of SI-based models was slightly lower than that of CARS-based models. But spectral index had a good adaptability to the models, and each SI-based model displayed the similar accuracy. For different spectra, the accuracy of CARS-based model differed from modeling methods. (4) The optimal CARS-based model was model CARS-CR-SVR (R2 and RMSE: 0.92 and 1.91 g/kg in validation set, RPD: 3.23). The optimal SI-based model was model SI3-SVR (R2 and RMSE: 0.87 and 2.40 g/kg in validation set, RPD: 2.57) and model SI-SVR (R2 and RMSE: 0.84 and 2.63 g/kg in validation set, RPD: 2.35).
Copyright: © 2023 Zhao et al. This is an open access article distributed under the terms of the Creative Commons Attribution License, which permits unrestricted use, distribution, and reproduction in any medium, provided the original author and source are credited.
Conflict of interest statement
The authors have declared that no competing interests exist.
Figures
Similar articles
-
[Estimation of soil moisture and organic matter content in saline alkali farmland by using CARS algorithm combined with covariates].Ying Yong Sheng Tai Xue Bao. 2024 May;35(5):1321-1330. doi: 10.13287/j.1001-9332.202405.021. Ying Yong Sheng Tai Xue Bao. 2024. PMID: 38886431 Chinese.
-
Estimation of Soil Organic Carbon Using Vis-NIR Spectral Data and Spectral Feature Bands Selection in Southern Xinjiang, China.Sensors (Basel). 2022 Aug 16;22(16):6124. doi: 10.3390/s22166124. Sensors (Basel). 2022. PMID: 36015885 Free PMC article.
-
Estimation of soil organic matter content based on CARS algorithm coupled with random forest.Spectrochim Acta A Mol Biomol Spectrosc. 2021 Sep 5;258:119823. doi: 10.1016/j.saa.2021.119823. Epub 2021 Apr 20. Spectrochim Acta A Mol Biomol Spectrosc. 2021. PMID: 33901945
-
Effects of Subsetting by Parent Materials on Prediction of Soil Organic Matter Content in a Hilly Area Using Vis-NIR Spectroscopy.PLoS One. 2016 Mar 14;11(3):e0151536. doi: 10.1371/journal.pone.0151536. eCollection 2016. PLoS One. 2016. PMID: 26974821 Free PMC article.
-
Hyperspectral imaging as a non-destructive technique for estimating the nutritional value of food.Curr Res Food Sci. 2024 Jun 25;9:100799. doi: 10.1016/j.crfs.2024.100799. eCollection 2024. Curr Res Food Sci. 2024. PMID: 39040225 Free PMC article. Review.
References
-
- Rossel RAV, Walvoort DJJ, McBratney AB, Janik LJ, Skjemstad JO. Visible, near infrared, mid infrared or combined diffuse reflectance spectroscopy for simultaneous assessment of various soil properties. Geoderma. 2006; 131: 59–75.
-
- Sommer S, Hill J, Mégier J. The potential of remote sensing for monitoring rural land use changes and their effects on soil conditions. Agr Ecosyst Environ. 1998; 67: 197–209.
-
- Shi Z, Ji W, Rossel RAV, Chen S, Zhou Y. Prediction of soil organic matter using a spatially constrained local partial least squares regression and the Chinese vis–NIR spectral library. Eur J Soil Sci. 2015; 66: 679–687.
-
- Bartholomeus HM, Schaepman ME, Kooistra L, Stevens A, Hoogmoed WB, Spaargaren OSP. Spectral reflectance based indices for soil organic carbon quantification. Geoderma. 2008; 145: 28–36.
-
- Ostovari Y, Ghorbani-Dashtaki S, Bahrami H-A, Abbasi M, Dematte JAM, Arthur E, et al.. Towards prediction of soil erodibility, SOM and CaCO3 using laboratory Vis-NIR spectra: A case study in a semi-arid region of Iran. Geoderma. 2018; 314: 102–112.
Publication types
MeSH terms
Substances
LinkOut - more resources
Full Text Sources
Research Materials
