. 2023 Jun 14;21(6):e3002121.
doi: 10.1371/journal.pbio.3002121. eCollection 2023 Jun.

NANOG is required to establish the competence for germ-layer differentiation in the basal tetrapod axolotl

Affiliations

NANOG is required to establish the competence for germ-layer differentiation in the basal tetrapod axolotl

Luke A Simpson et al. PLoS Biol. .

Abstract

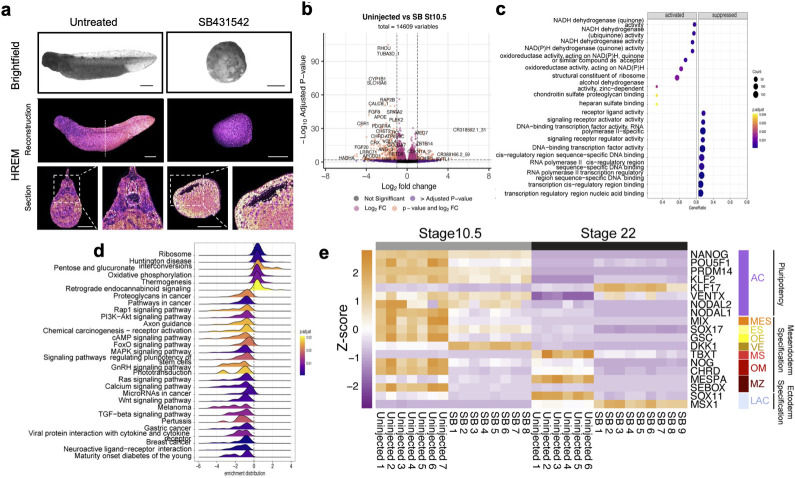
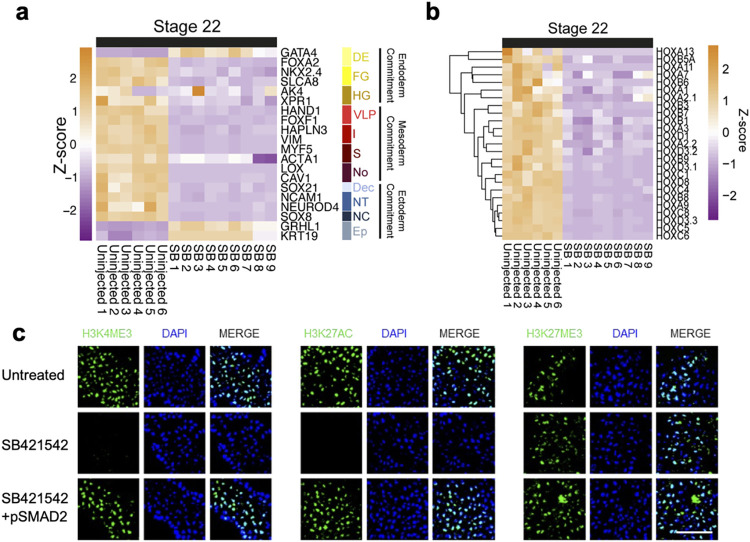
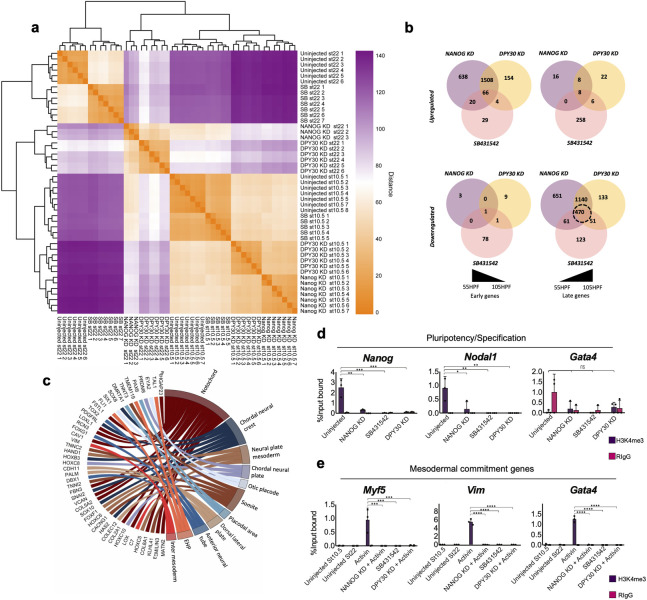
Pluripotency defines the unlimited potential of individual cells of vertebrate embryos, from which all adult somatic cells and germ cells are derived. Understanding how the programming of pluripotency evolved has been obscured in part by a lack of data from lower vertebrates; in model systems such as frogs and zebrafish, the function of the pluripotency genes NANOG and POU5F1 have diverged. Here, we investigated how the axolotl ortholog of NANOG programs pluripotency during development. Axolotl NANOG is absolutely required for gastrulation and germ-layer commitment. We show that in axolotl primitive ectoderm (animal caps; ACs) NANOG and NODAL activity, as well as the epigenetic modifying enzyme DPY30, are required for the mass deposition of H3K4me3 in pluripotent chromatin. We also demonstrate that all 3 protein activities are required for ACs to establish the competency to differentiate toward mesoderm. Our results suggest the ancient function of NANOG may be establishing the competence for lineage differentiation in early cells. These observations provide insights into embryonic development in the tetrapod ancestor from which terrestrial vertebrates evolved.


Conflict of interest statement

The authors have declared that no competing interests exist.

Figures

Fig 1
Fig 1. AC pluripotency resembles that of mammals and is under the control of Nanog.
(a) Diagram showing axolotl embryo external view at stage 9, prior to gastrulation and the approximate cell fates of each region. (b) Overview of axolotl early development. Axolotl staging was done as described previously and in line with Bordzilovskaya and Dettlaf [13,23]. Approximate HPF at 18°C. Pluripotency (P), endoderm specification (general) (ES), mesoderm specification (general) (MS), ectoderm specification (general) (EcS), mesoderm commitment (MC), endoderm commitment (EC), ectoderm commitment (EcC), mesoderm differentiation (MD), endoderm differentiation (ED), Neural differentiation (ND). Data from Jiang and colleagues [24]. (c) Outline of transcriptomic data collection and cross-species comparison (for axolotl samples n = 3, 15 pooled explants per sample). (d) Key pluripotency and differentiation gene expression in the peri-gastrula primitive ectoderm of axolotl, mice, frogs, humans, and pigs. NA indicates that transcript information is not available in the source data. AC, animal cap; HPF, hours post fertilisation; ZGA, zygotic genome activation.
Fig 2
Fig 2. Nanog is required for gastrulation.
(a) Brightfield images and HREM reconstructions of uninjected and NANOG translation MO depleted and hNANOG rescued embryos at equivalent stage 40. Dotted line marks plane of section reconstruction. Dashed lines highlight: somites (S), neural tube (NT) notochord (No), mesonephric ducts (Me). Scale bar, 1 mm. (b) Expression of core pluripotency genes at different developmental stages with and without NANOG translation MO KD (n = 3, 10 pooled embryos per experimental condition). (c) Volcano plot showing significant DEGs in NANOG translation MO KD embryos compared to equivalent stage 10.5 uninjected embryos. Vertical dotted line indicates a Log2 fold change of 1.5. Horizontal line indicates padj threshold of 0.01 on an -log10 scale. Orange points indicate significantly DEGs. Expression of core pluripotency genes at different developmental stages with and without NANOG translation MO KD. (d) The number of maternally inherited genes, usually cleared by ZGA, which are differentially expressed (>1 Log2 FC, padj < 0.01) in NANOG translation MO KD at equivalent stage 10.5. (e) The number of zygotically genome activation-associated genes, which are differentially expressed (>1 Log2 FC, padj < 0.01) in NANOG translation MO KD at equivalent stage 10.5. (f) Z-score heatmap indicating relative gene expression of cell type marker genes at equivalent stage 10.5 and 22 in uninjected (n = 7 and 6, respectively) and NANOG translation MO depleted (n = 7 and 3, respectively) embryos. Animal cap (AC), mesendoderm specification (general) (MES), endoderm specification (general) (ES), organiser endoderm (OE), vegetal endoderm (VE), mesoderm specification (general) (MS), organiser mesoderm (OM), marginal zone (MZ), late animal cap (fated to ectoderm; LAC). The data underlying this figure are available in S1 Images and in S1 Data. FC, fold change; DEG, differentially expressed gene; HREM, high-resolution episcopic microscopy; St, stage; ZGA, zygotic genome activation.
Fig 3
Fig 3. Nanog is required for differentiation in response to inductive signals.
(a) Volcano plot showing significant DEGs in NANOG translation MO KD embryos compared to equivalent stage 22 uninjected embryos. Vertical dotted line indicates a fold change 1 Log2. Horizontal line indicates padj threshold of 0.01 on an -log10 scale. Orange points indicate significantly DEGs. (b) Z-score heatmaps indicating relative gene expression of cell type marker genes at stage 22 uninjected (n = 6) and at equivalent stage NANOG translation MO-depleted (n = 3) embryos. Definitive endoderm (general) (DE), foregut (FG), hindgut (HG), ventral-lateral plate (VLP), intermediate mesoderm (I), somite (S), notochord (No), definitive ectoderm (general) (Dec), neural tube (NT), neural crest (NC), epidermal progenitors (EP). (c) Expression of Hox genes in response to NANOG translation MO KD in equivalent stage 22 embryos. (d) QPCR of germ-layer markers of uninjected and NANOG translation MO-depleted stage 22 equivalent caps following treatment with different activin concentrations (n = 15). Asterisks represent the adjusted p-value obtained from Tukey’s multiple comparisons test following one-way ANOVA, * = P ≤ 0.05, ** = = P ≤ 0.01, *** = P ≤ 0.001, *** = P ≤ 0.001, **** = P ≤ 0.0001, ns = P > 0.05. (e) Diagrammatic representation of the effect of NANOG translation MO depletion, which prevents sequential waves of gene expression post specification. (f) Uninjected, NANOG translation MO depleted and hNANOG rescued AC explants cultured to equivalent stage 10.5 and stained for H3K4me3, H3K27ac, H3K27me3, and DAPI (n = 3). Scale bar, 60 μm. The data underlying this figure are available in S1 Images and in S1 Data. AC, animal cap; DEG, differentially expressed gene; ns, non-significant.
Fig 4
Fig 4. Nodal signalling programs early germ-layer specification.
(a) Brightfield and HREM images of stage 40 uninjected and equivalent stage SB431542-treated embryos. Dotted line marks plane of section reconstruction. Somites (S), neural tube (NT) Notochord (No), Mesonephric ducts (Me), Blastocoel (B) (n = 25 and 2, respectively). Scale bar, 1 mm. (b) Volcano plots showing significant DEGs in SB-treated embryos compared to equivalent stage 10.5 uninjected embryos. Vertical dotted line indicates a fold change 1 Log2. Horizontal line indicates padj threshold of 0.01 on an -log10 scale. Orange points indicate significantly DEGs. (c) Dot plots showing significantly enriched (padj <0.01) GO database biological process gene sets within SB-treated DEGs at equivalent stage 10.5. (d) Ridgeline plots showing significantly enriched (padj <0.01) KEGG pathway gene sets within SB-treated DEGs at equivalent stage 10.5. (e) Z-score heatmap indicating relative gene expression of cell type marker genes at stages equivalent to 10.5 and 22 in uninjected (n = 7 and 6, respectively) and SB431542 (n = 8 and 9, respectively) treated embryos. Animal cap (AC), mesendoderm specification (general) (MES), endoderm specification (general) (ES), organiser endoderm (OE), vegetal endoderm (VE), mesoderm specification (general) (MS), organiser mesoderm (OM), marginal zone (MZ), late animal cap (fated to ectoderm; LAC). The data underlying this figure are available in S1 Images and in S1 Data. DEG, differentially expressed gene; HREM, high-resolution episcopic microscopy.
Fig 5
Fig 5. Nodal signal depletion prevents germ-layer commitment and depletes activating epigenetic marks.
(a) Z-score heatmap indicating relative gene expression of cell type marker genes in SB431542-treated embryos at a stage equivalent to 22 in uninjected (n = 6 and 9, respectively). Definitive endoderm (general) (DE), foregut (FG), hindgut (HG), ventral-lateral plate (VLP), intermediate mesoderm (I), somite (S), notochord (No), definitive ectoderm (general) (Dec), neural tube (NT), neural crest (NC), epidermal progenitors (EP). (b) Gene expression of Hox genes in SB431542-treated embryos at equivalent stage 22. (c) Uninjected, SB431542-treated, and SMAD2 rescued AC explants cultured to stage equivalent to 10.5 and stained for H3K4me3, H3K27ac, H3K27me3, and DAPI (n = 3). Scale bar, 60 μm. The data underlying this figure are available in S1 Images and in S1 Data. AC, animal cap.
Fig 6
Fig 6. NANOG, SMAD2, and DPY30 gene target loci lack H3K4me3.
(a) Heatmap shows sample-sample distance, orange colouring indicates a greater similarity, purple colouring indicates a greater difference in sample transcriptomes, hierarchal clustering has been applied to heatmap rows and columns. (b) Venn diagrams of unique and overlapping DEGs in NANOG translation MO, DPY30 translation MO, and NODAL-depleted embryos at stages equivalent to 10.5 and 22 in controls. (c) Chord diagram showing significantly (FDR <0.01) enriched amphibian cell type-specific markers in overlapping down-regulated genes. (d) H3K4me3 ChIP of equivalent stage 10.5 uninjected, NANOG translation MO KD, DPY30 translation MO KD, and SB431542-treated caps followed by qPCR using probes directed at gene promoter regions (50 pooled explants per experimental condition, individual points show technical replicates). Dots show individual data points. Asterisks represent the adjusted p-value obtained from Tukey’s multiple comparisons test following one-way ANOVA, * = P ≤ 0.05, ** = = P ≤ 0.01, *** = P ≤ 0.001, *** = P ≤ 0.001, **** = P ≤ 0.0001, ns = P > 0.05. (e) H3K4me3 ChIP-qPCR of equivalent stages 10.5 and 22, uninjected caps, stage 22 Activin-treated caps with and without NANOG translation MO and DPY30 translation MO depletion as well as SB431542-treated caps (50 pooled explants per experimental condition, individual points show technical replicates). Statistics are as described in d. The data underlying this figure are available in S1 Data. DEG, differentially expressed gene; HPF, hours post fertilization; ns, non-significant.

References

    1. Bradley A, Evans M, Kaufman MH, Robertson E. Formation of germ-line chimaeras from embryo-derived teratocarcinoma cell lines. Nature. 1984;309(5965):255–6. Epub 1984/05/17. doi: 10.1038/309255a0 . - DOI - PubMed
    1. Smith A. Formative pluripotency: the executive phase in a developmental continuum. Development. 2017;144(3):365–73. Epub 2017/02/02. doi: 10.1242/dev.142679 ; PubMed Central PMCID: PMC5430734. - DOI - PMC - PubMed
    1. Nichols J, Smith A. Naive and primed pluripotent states. Cell Stem Cell. 2009;4(6):487–92. Epub 2009/06/06. doi: 10.1016/j.stem.2009.05.015 . - DOI - PubMed
    1. Johnson AD, Bachvarova RF, Drum M, Masi T. Expression of axolotl DAZL RNA, a marker of germ plasm: widespread maternal RNA and onset of expression in germ cells approaching the gonad. Dev Biol. 2001;234(2):402–15. Epub 2001/06/09. doi: 10.1006/dbio.2001.0264 . - DOI - PubMed
    1. Johnson AD, Drum M, Bachvarova RF, Masi T, White ME, Crother BI. Evolution of predetermined germ cells in vertebrate embryos: implications for macroevolution. Evol Dev. 2003;5(4):414–31. Epub 2003/06/26. doi: 10.1046/j.1525-142x.2003.03048.x . - DOI - PubMed

Publication types

MeSH terms

Substances