Analytical solution of l-i SEIR model-Comparison of l-i SEIR model with conventional SEIR model in simulation of epidemic curves
- PMID: 37315097
- PMCID: PMC10266630
- DOI: 10.1371/journal.pone.0287196
Analytical solution of l-i SEIR model-Comparison of l-i SEIR model with conventional SEIR model in simulation of epidemic curves
Abstract
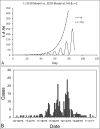
The Susceptible-Exposed-Infectious-Recovered (SEIR) epidemic model has been commonly used to analyze the spread of infectious diseases. This 4-compartment (S, E, I and R) model uses an approximation of temporal homogeneity of individuals in these compartments to calculate the transfer rates of the individuals from compartment E to I to R. Although this SEIR model has been generally adopted, the calculation errors caused by temporal homogeneity approximation have not been quantitatively examined. In this study, a 4-compartment l-i SEIR model considering temporal heterogeneity was developed from a previous epidemic model (Liu X., Results Phys. 2021; 20:103712), and a closed-form solution of the l-i SEIR model was derived. Here, l represents the latent period and i represents the infectious period. Comparing l-i SEIR model with the conventional SEIR model, we are able to examine how individuals move through each corresponding compartment in the two SEIR models to find what information may be missed by the conventional SEIR model and what calculation errors may be introduced by using the temporal homogeneity approximation. Simulations showed that l-i SEIR model could generate propagated curves of infectious cases under the condition of l>i. Similar propagated epidemic curves were reported in literature, but the conventional SEIR model could not generate propagated curves under the same conditions. The theoretical analysis showed that the conventional SEIR model overestimates or underestimates the rate at which individuals move from compartment E to I to R in the rising or falling phase of the number of infectious individuals, respectively. Increasing the rate of change in the number of infectious individuals leads to larger calculation errors in the conventional SEIR model. Simulations from the two SEIR models with assumed parameters or with reported daily COVID-19 cases in the United States and in New York further confirmed the conclusions of the theoretical analysis.
Copyright: © 2023 Xiaoping Liu. This is an open access article distributed under the terms of the Creative Commons Attribution License, which permits unrestricted use, distribution, and reproduction in any medium, provided the original author and source are credited.
Conflict of interest statement
The authors have declared that no competing interests exist.
Figures


Similar articles
-
Epidemic spread simulation in an area with a high-density crowd using a SEIR-based model.PLoS One. 2021 Jun 17;16(6):e0253220. doi: 10.1371/journal.pone.0253220. eCollection 2021. PLoS One. 2021. PMID: 34138911 Free PMC article.
-
The approximately universal shapes of epidemic curves in the Susceptible-Exposed-Infectious-Recovered (SEIR) model.Sci Rep. 2020 Nov 9;10(1):19365. doi: 10.1038/s41598-020-76563-8. Sci Rep. 2020. PMID: 33168932 Free PMC article.
-
An Edge-Based Model of SEIR Epidemics on Static Random Networks.Bull Math Biol. 2020 Jul 16;82(7):96. doi: 10.1007/s11538-020-00769-0. Bull Math Biol. 2020. PMID: 32676740
-
A path-specific SEIR model for use with general latent and infectious time distributions.Biometrics. 2013 Mar;69(1):101-8. doi: 10.1111/j.1541-0420.2012.01809.x. Epub 2013 Jan 16. Biometrics. 2013. PMID: 23323602 Free PMC article.
-
A dynamical map to describe COVID-19 epidemics.Eur Phys J Spec Top. 2022;231(5):893-904. doi: 10.1140/epjs/s11734-021-00340-5. Epub 2021 Nov 25. Eur Phys J Spec Top. 2022. PMID: 34849187 Free PMC article. Review.
Cited by
-
Prediction of daily new COVID-19 cases - Difficulties and possible solutions.PLoS One. 2024 Aug 23;19(8):e0307092. doi: 10.1371/journal.pone.0307092. eCollection 2024. PLoS One. 2024. PMID: 39178243 Free PMC article.
References
-
- Hethcote HW (2000) The Mathematics of Infectious Diseases. SIAM Review 42: 599–653.
-
- Allen LJS, Bauch CT, Castillo-Chavez C, Earn DJD, Feng Z, et al.. (2008) Mathematical epidemiology; Brauer F, van den Driessche P, Wu J, editors: Springer.
MeSH terms
LinkOut - more resources
Full Text Sources
Medical

