. 2023 Jun 14;15(700):eabo2984.
doi: 10.1126/scitranslmed.abo2984. Epub 2023 Jun 14.

Gut microbiome composition may be an indicator of preclinical Alzheimer's disease

Affiliations

Gut microbiome composition may be an indicator of preclinical Alzheimer's disease

Aura L Ferreiro et al. Sci Transl Med. .

Abstract

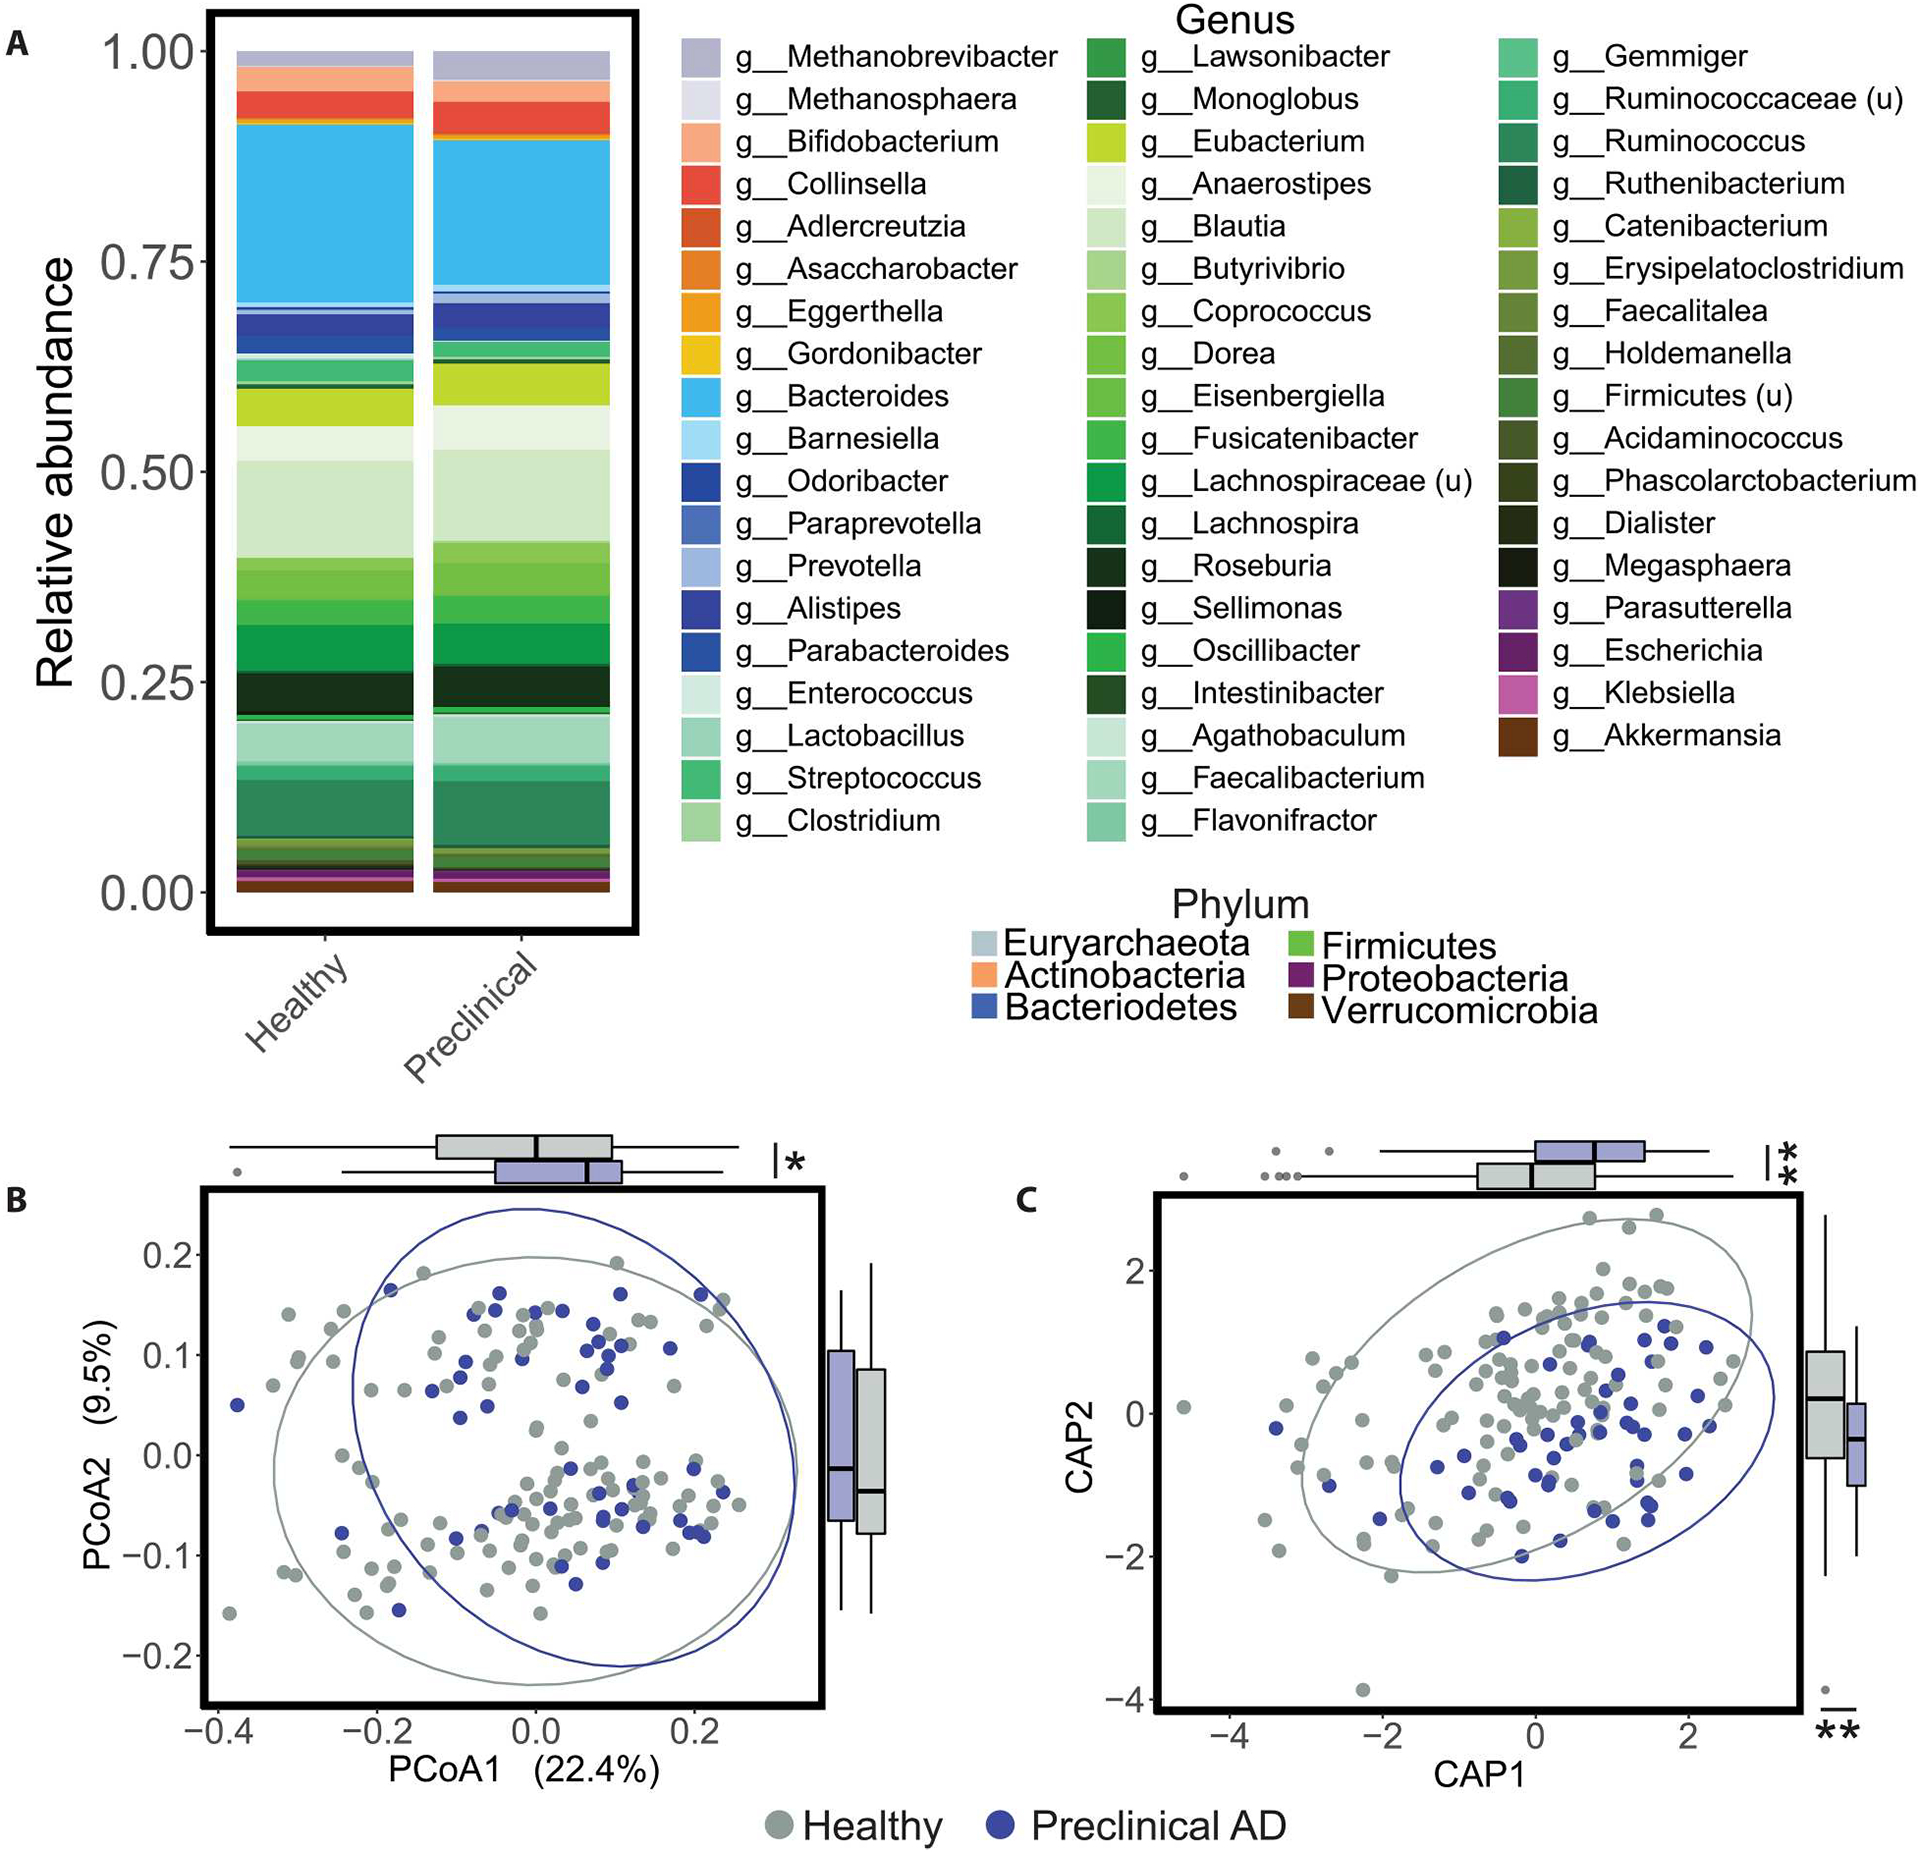
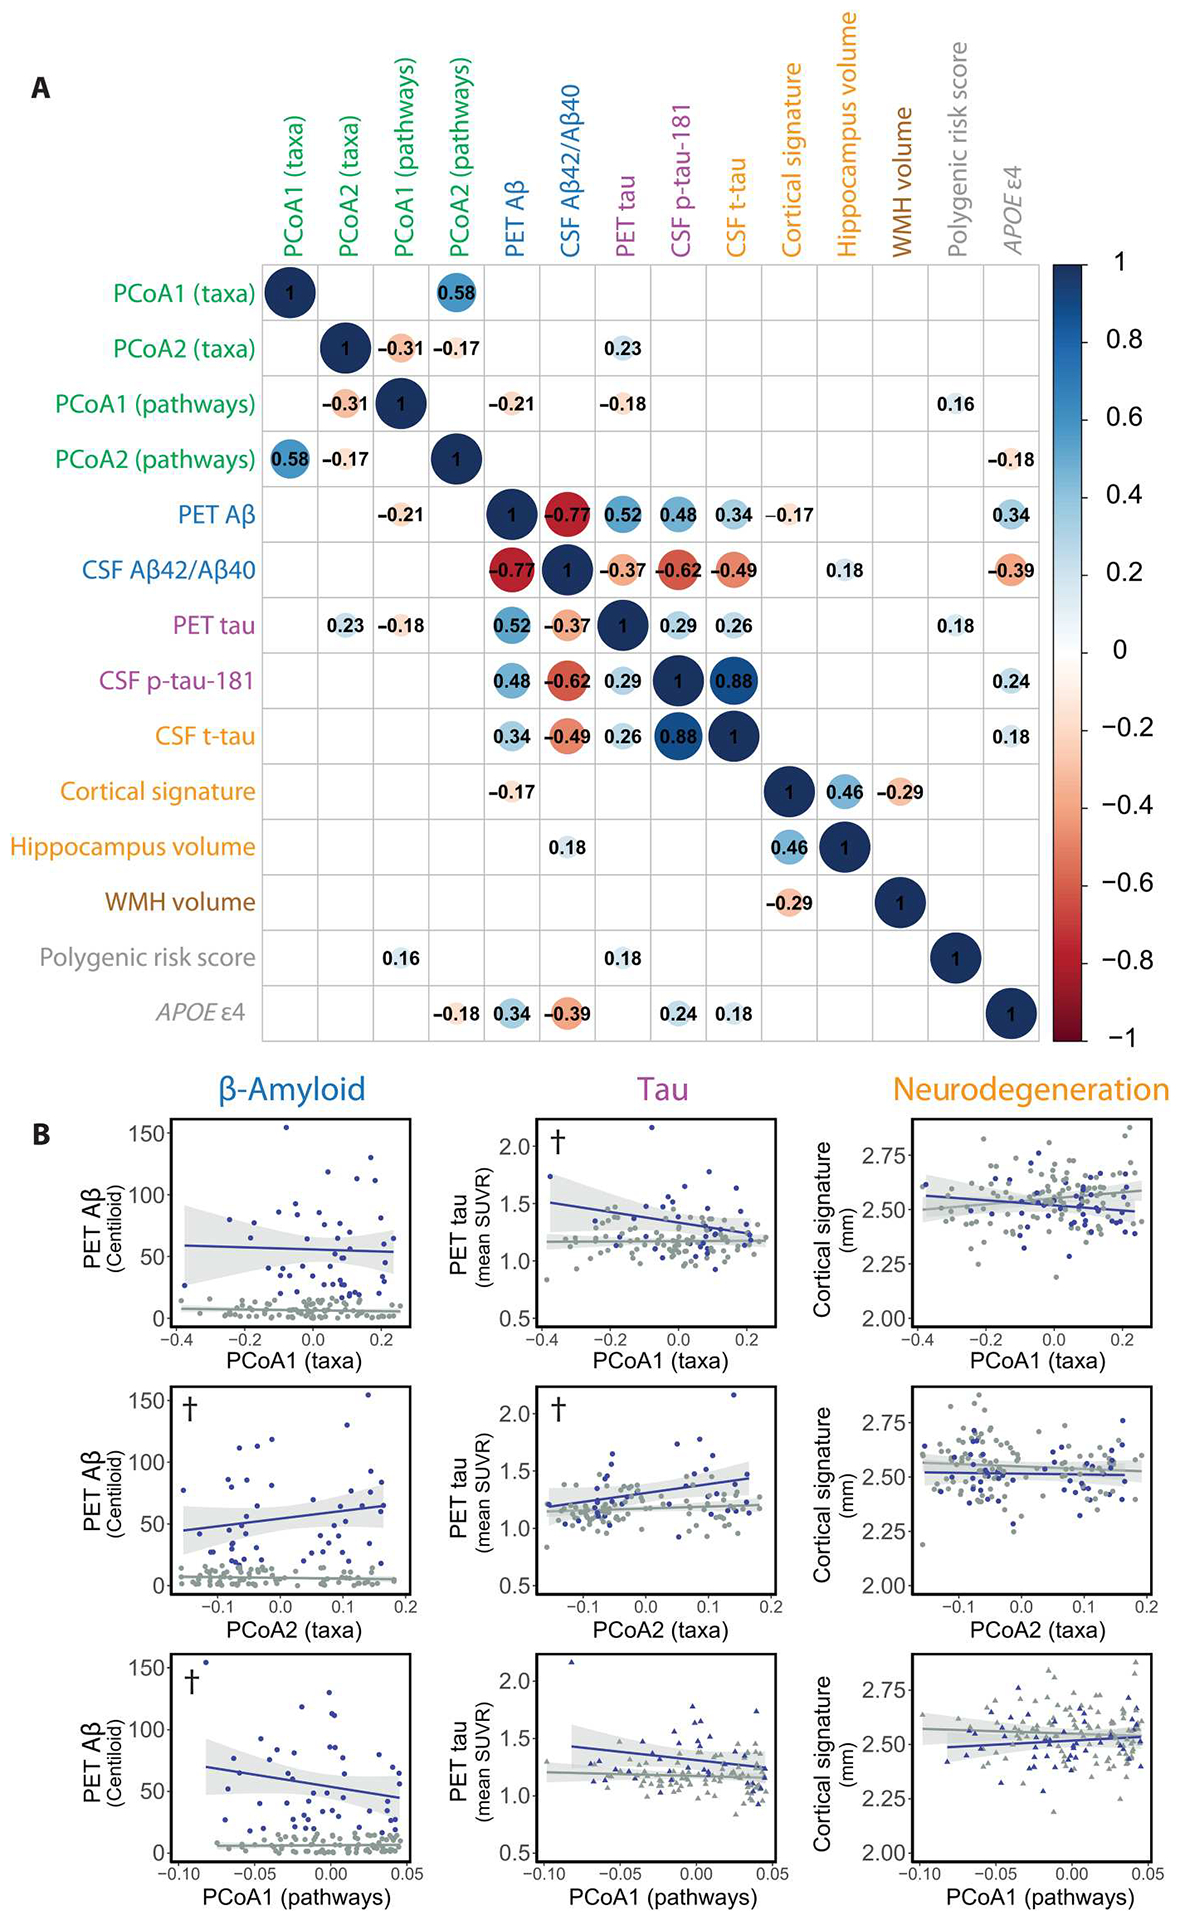
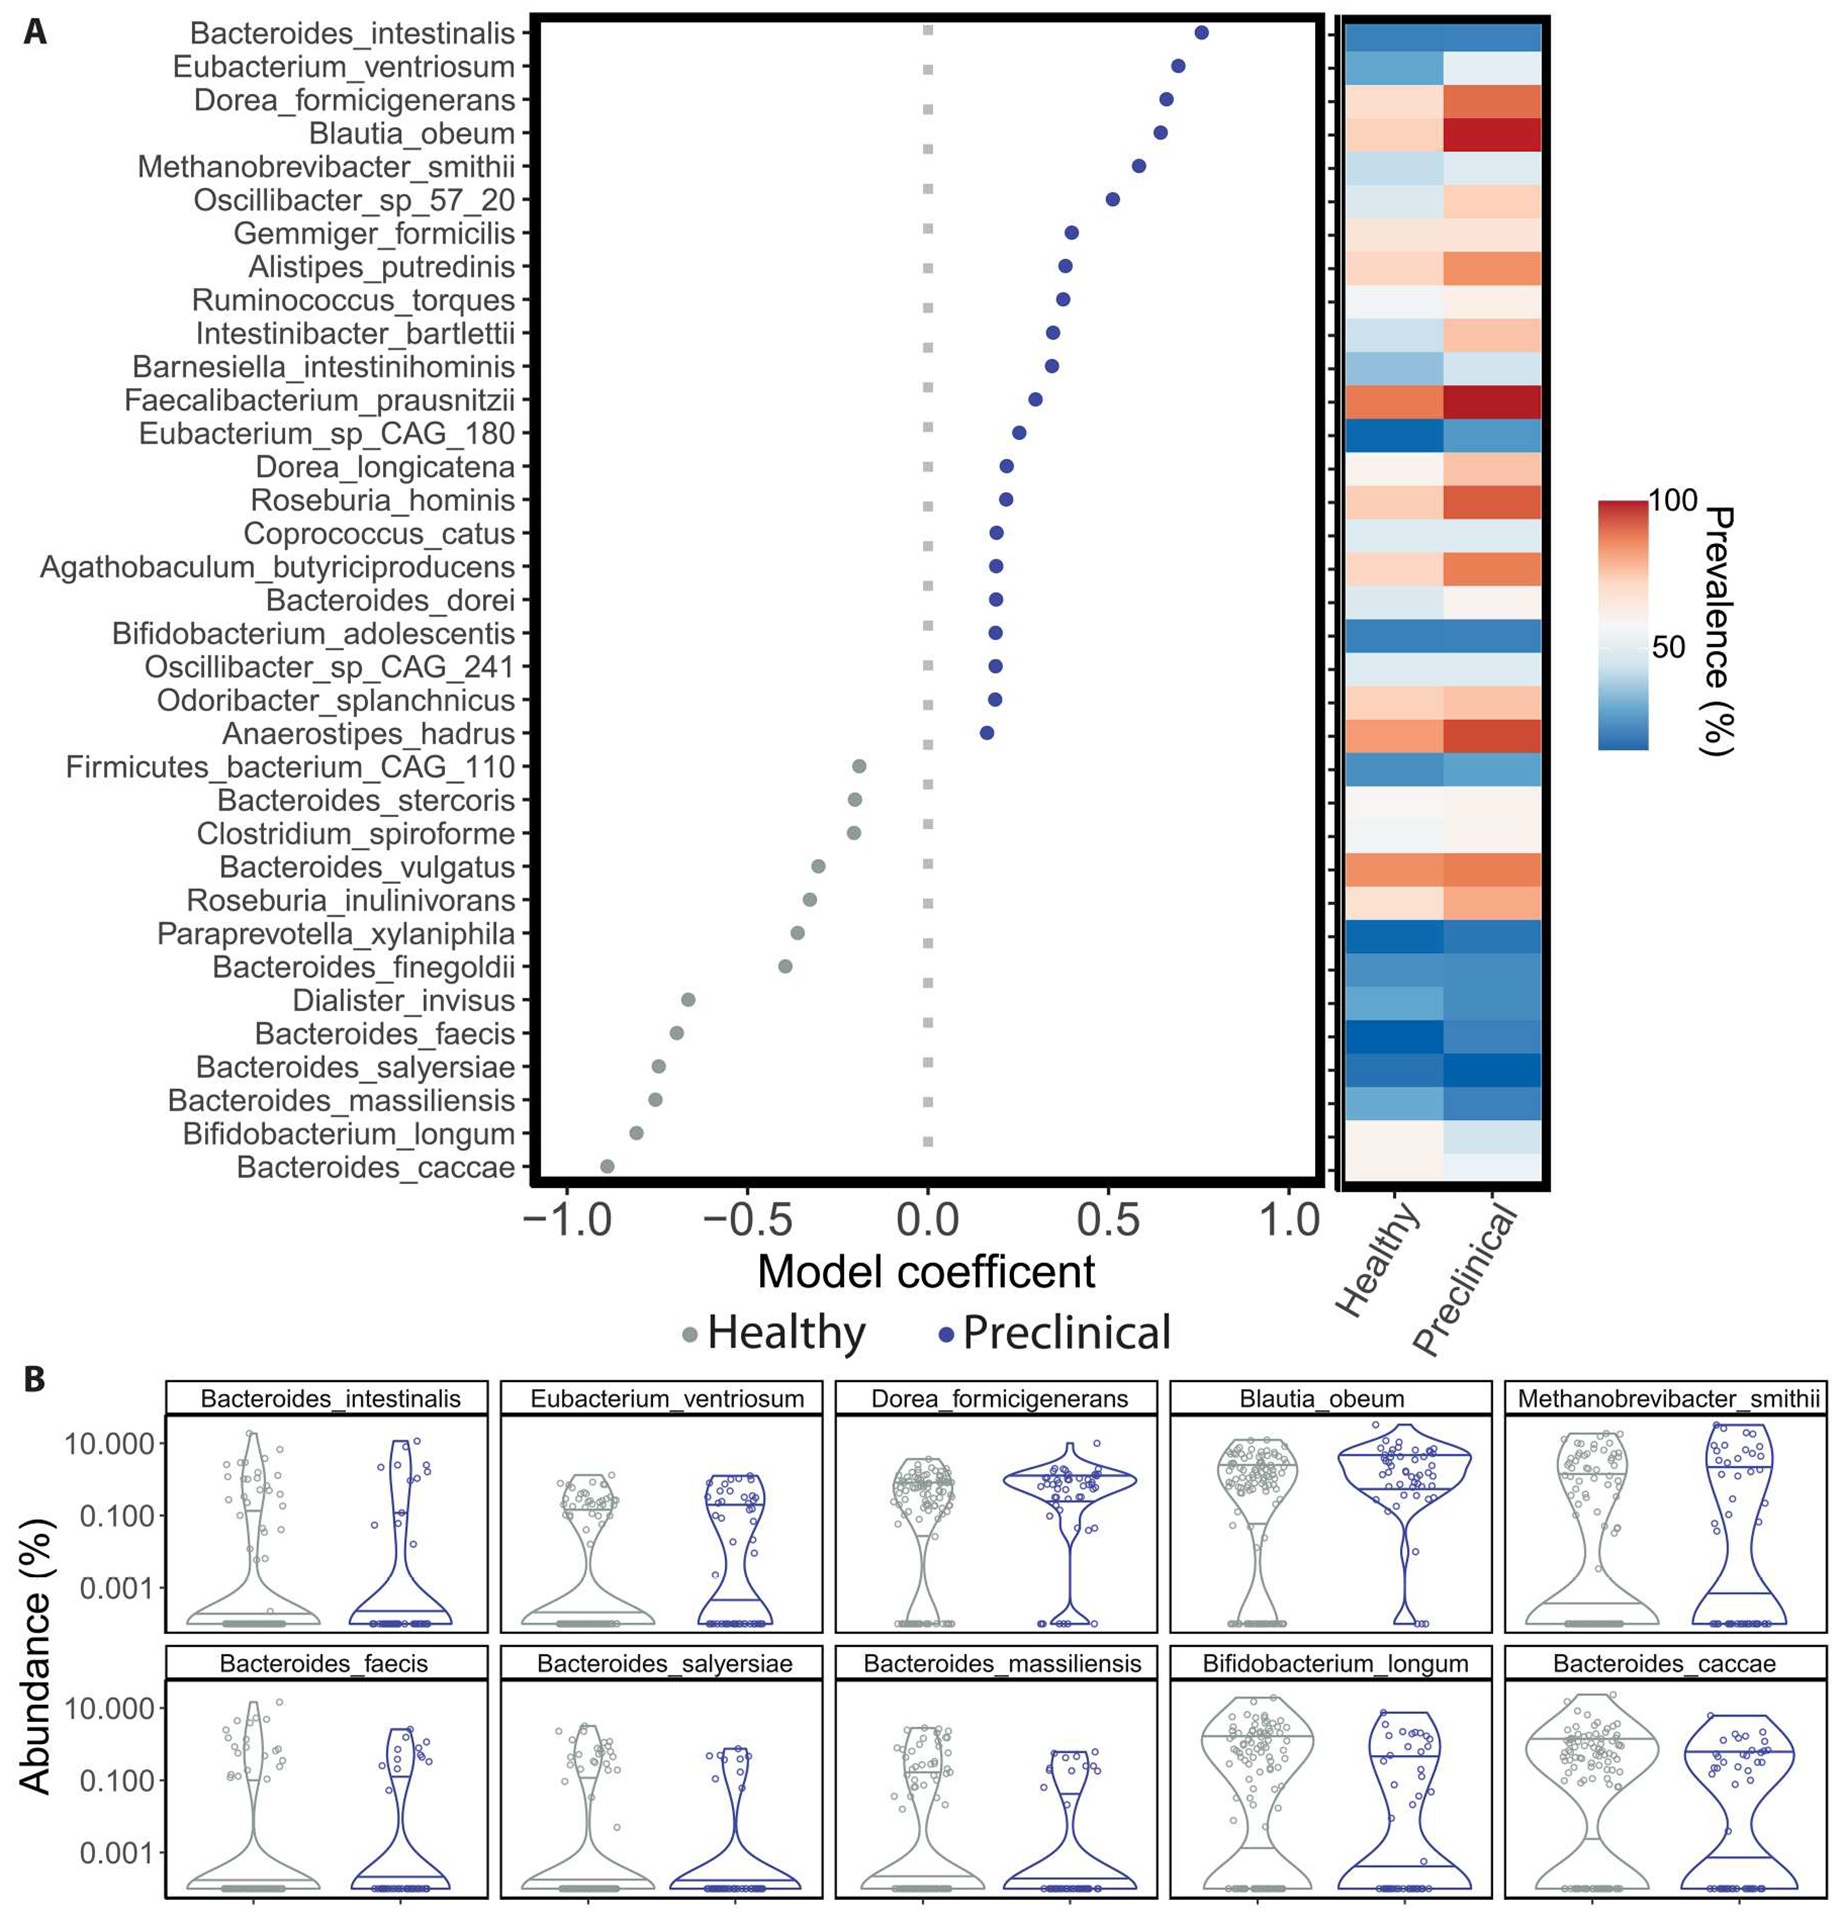
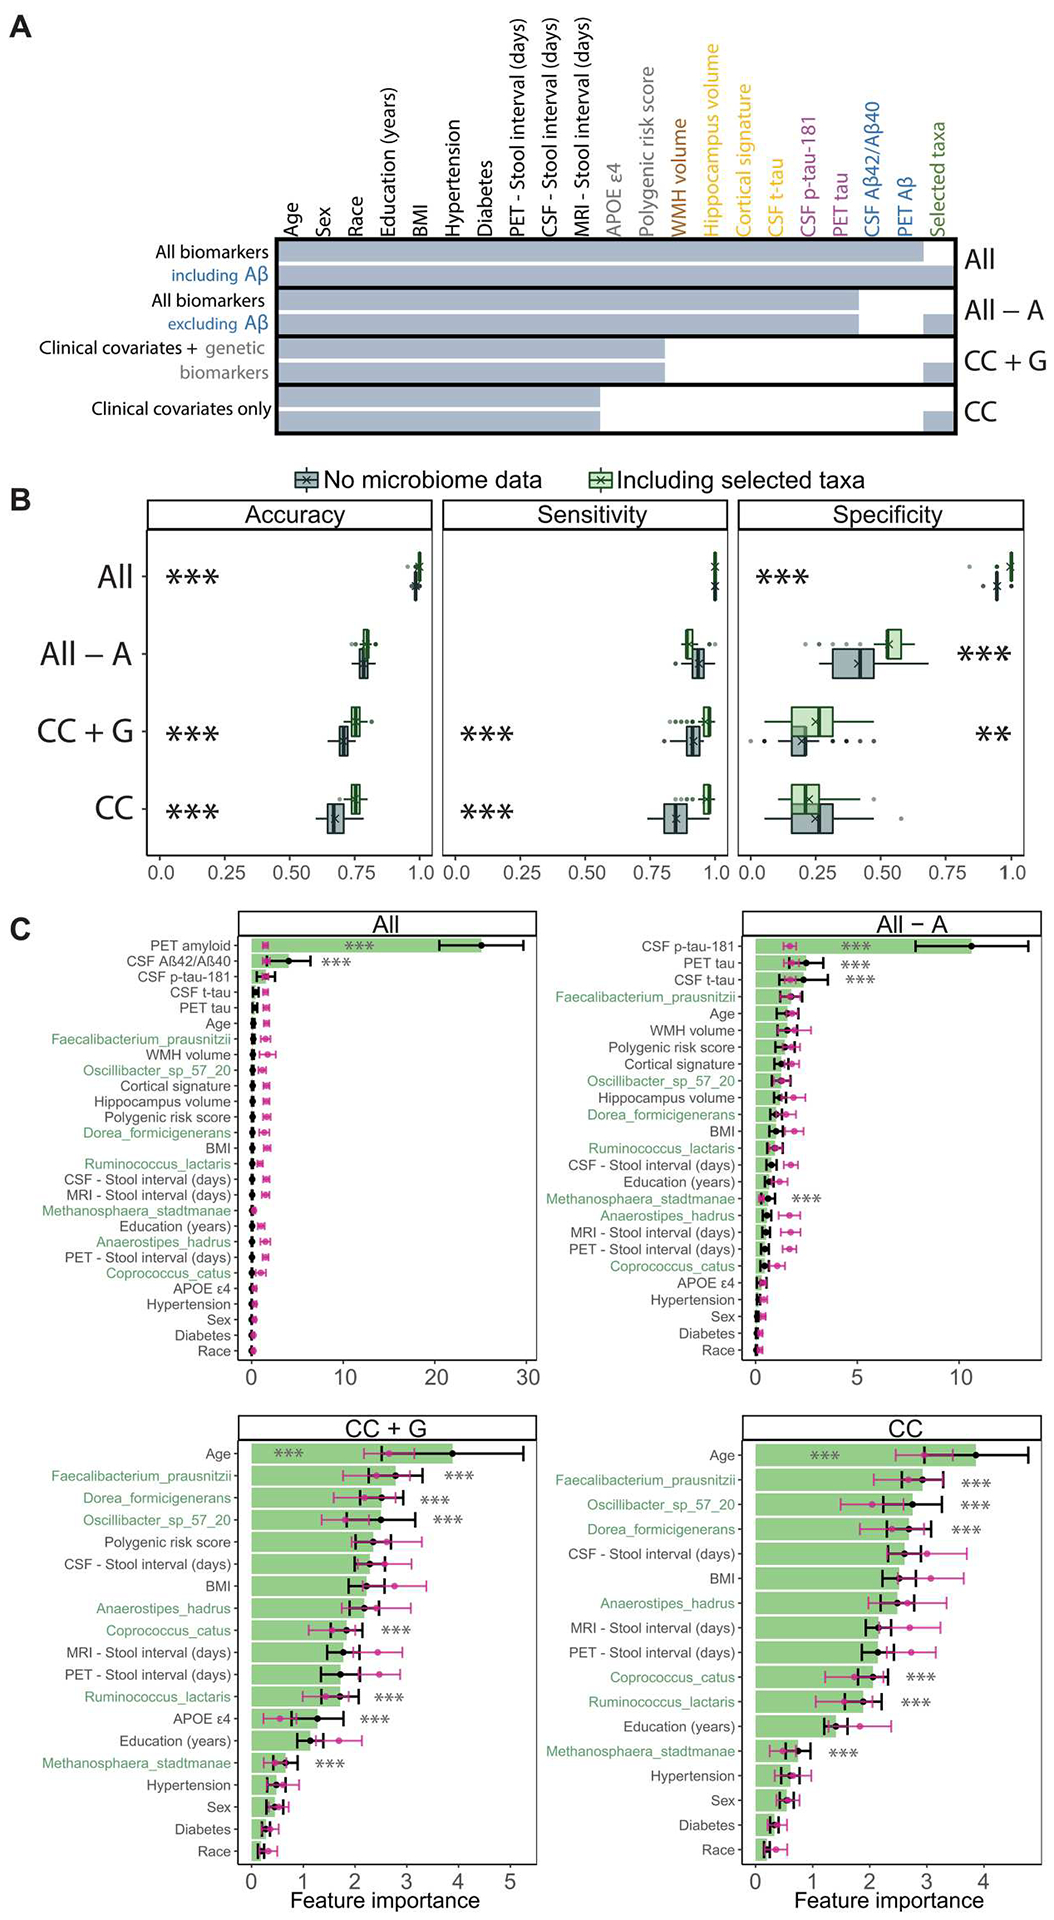
Alzheimer's disease (AD) pathology is thought to progress from normal cognition through preclinical disease and ultimately to symptomatic AD with cognitive impairment. Recent work suggests that the gut microbiome of symptomatic patients with AD has an altered taxonomic composition compared with that of healthy, cognitively normal control individuals. However, knowledge about changes in the gut microbiome before the onset of symptomatic AD is limited. In this cross-sectional study that accounted for clinical covariates and dietary intake, we compared the taxonomic composition and gut microbial function in a cohort of 164 cognitively normal individuals, 49 of whom showed biomarker evidence of early preclinical AD. Gut microbial taxonomic profiles of individuals with preclinical AD were distinct from those of individuals without evidence of preclinical AD. The change in gut microbiome composition correlated with β-amyloid (Aβ) and tau pathological biomarkers but not with biomarkers of neurodegeneration, suggesting that the gut microbiome may change early in the disease process. We identified specific gut bacterial taxa associated with preclinical AD. Inclusion of these microbiome features improved the accuracy, sensitivity, and specificity of machine learning classifiers for predicting preclinical AD status when tested on a subset of the cohort (65 of the 164 participants). Gut microbiome correlates of preclinical AD neuropathology may improve our understanding of AD etiology and may help to identify gut-derived markers of AD risk.


Conflict of interest statement

G.D. is a co-founder, holder of equity in, a consultant to, and a member of the Scientific Advisory Board of Viosera Therapeutics, which is developing combination antimicrobial therapy against bacterial pathogens. G.D. is a co-inventor on a patent assigned to Viosera Therapeutics. G.D. is a consultant to and a member of the Scientific Advisory Board of Pluton Biosciences and has consulted for SNIPR Technologies Ltd. in the last 5 years. P.I.T. is a holder of equity in, a consultant to, and a member of the Scientific Advisory Board of MediBeacon Inc. and is a co-inventor on patents assigned to MediBeacon; Chair of the Scientific Advisory Board of the AGA Center for Microbiome Research and Education (a paid position); a consultant to Temple University on waterborne enteric infections; a recipient of royalties from UpToDate; and an unpaid member of the Data Safety Monitoring Board of Inmunova. D.M.H. co-founded and is on the Scientific Advisory Board of C2N Diagnostics and consults for Genentech, Denali, Cajal Neurosciences, C2N Diagnostics, and Asteroid. Washington University receives research grants to the laboratory of D.M.H. from NextCure, Eli Lilly, Novartis, Ionis, and Denali. T.L.S.B. receives research funding from Siemens as well as technical support and materials from Avid Radiopharmaceuticals, Cerveau, and Life Molecular Imaging. T.L.S.B. also receives paid and unpaid consulting and has advisory roles for Siemens, Eli Lilly, Roche, Life Molecular Imaging, Biogen, and Eisai. A.M.F. was a member of the scientific advisory boards for Roche Diagnostics, Genentech, and Diadem and also previously consulted for DiamiR and Siemens Healthcare Diagnostics Inc. S.E.S. has analyzed data provided by C2N Diagnostics to Washington University and has served on a Scientific Advisory Board for Eisai. C.C. has received research support from GlaxoSmithKline and Eisai and is a member of the advisory board of Vivid Genomics and Circular Genomics and owns stocks. J.C.M. is a member of the Barcelona Brain Research Foundation Scientific Advisory Board, the Native Alzheimer Disease-Related Resource Center in Minority Aging Research External Advisory Board, the Cure Alzheimer’s Fund Research Strategy Council, and the Longer Life Foundation Board of Governors. J.C.M. was previously a member of the Diverse VCID (Vascular Contributions to Cognitive Impairment and Dementia) Observational Study Monitoring Board.

Figures

Fig. 1.
Fig. 1.. Healthy and preclinical AD individuals have distinct gut microbiome profiles.
(A) Stacked taxonomic (MetaPhlAn3) bar plots at the genus level stratified by preclinical AD status are shown, with color grouping at the phylum level. u, unclassified. (B) The PCoA on unweighted UniFrac distances was calculated from the MetaPhlAn3 taxonomic profiles. Global microbiome composition was different between healthy and preclinical AD individuals after accounting for age, APOE ɛ4 carrier status, diabetes, body mass index, hypertension, and time elapsed between PET imaging or lumbar puncture for Aβ quantification and stool collection (P = 0.039, PERMANOVA; table S2). In addition, coordinates of healthy and preclinical AD samples were different along the PCoA axis 1 (P = 0.046, Student’s t test). (C) Corresponding CAP ordination on unweighted UniFrac distances was calculated from the MetaPhlAn3 taxonomic profiles using the same terms as the PERMANOVA in (B) (preclinical AD status P = 0.038, PERMANOVA; table S3). In addition, sample coordinates along the CAP1 and CAP2 axes differed by AD status (P = 0.001, Student’s t test). Ellipses represent 95% confidence bounds around group centroids. *P < 0.05 and **P < 0.01. Student’s t test; P values were adjusted using the Benjamini-Hochberg method.
Fig. 2.
Fig. 2.. Gut microbiome profiles correlate with Aβ and tau but not neurodegeneration.
(A) Pairwise Spearman correlations between microbiome summary metrics (green) and AD biomarkers (blue, Aβ; purple, tau; orange, neurodegeneration; brown, vascular injury; gray, genetic risk factors). Significant correlations are shown (P < 0.05, Benjamini-Hochberg adjusted), with the size of the circle inversely proportional to the P value. Inset values are Spearman correlations. WMH, white matter hyperintensities. (B) Linear regressions of AD biomarkers against gut microbiome–derived axes. Specifically, regressions of PET Aβ, PET tau, or cortical thickness (a measure of neurodegeneration) against PCoA sample coordinates derived from MetaPhlan3 taxonomic profiles (top and middle rows) or HUMAnN 3.0 functional pathway profiles (bottom row). Source PCoA ordinations are from Fig. 1B and fig. S3D. †P < 0.1, ANOVAs, Benjamini-Hochberg–adjusted. ANOVAs compare models regressing biomarker ~ PCoA axis*Aβ status against null models regressing biomarker ~ Aβ status to determine significantly improved explanation of variance with addition of the gut microbiome summary feature (PCoA axis). Regression models and ANOVAs are summarized in tables S6 to S8.
Fig. 3.
Fig. 3.. Fitting negative binomial models to gut microbiome taxonomic data identifies species associated with AD preclinical status.
(A) Model coefficients (left) and prevalence (right) of top-ranking species significantly associated with healthy or preclinical AD status are shown. Gut microbial species detected in at least 15% of samples are shown, with Benjamini-Hochberg–adjusted P values of the coefficient < 0.05 and with the magnitude of the coefficient > 0.15. Error bars represent the SE of the coefficient and may not be visible. Taxa coefficients are from negative binomial regression models (as implemented in MaAsLin2) that additionally included participant age, APOE ɛ4 carrier status, diabetes, body mass index, hypertension, and time elapsed between PET imaging or lumbar puncture for Aβ quantification and stool collection as predictors. (B) Relative abundances of the 10 taxa most associated with preclinical AD (top row) or healthy status (bottom row) by their model coefficient. All regression model results are available in data file S2.
Fig. 4.
Fig. 4.. Gut microbiome features improve the performance of Random Forest classifiers for AD status.
We compare the performance of Random Forest classification models with and without gut microbiome features, across combinations of AT(N) biomarkers and genetic risk factors for AD. (A) Summary of features included in each of the Random Forest models reported in (B) and (C). Feature inclusion is denoted by shaded cells. Models that include or exclude feature-selected gut taxa are compared (bottom and top of each model). Feature labels are colored by data/biomarker type (green, gut taxa; blue, Aβ; purple, tau; orange, neurodegeneration; brown, vascular injury; gray, genetic risk factors; black, clinical covariates). Except for model “All biomarkers including Aβ,” other models exclude Aβ biomarkers (PET Aβ and CSF Aβ42/Aβ40 ratio). Model shorthand names listed in the right margin: CC, clinical covariates; A, Aβ; G, genetics. Missing data were imputed before model training and are summarized in fig. S5. The feature with the most missingness was PET tau (20.7%). BMI, body mass index; WMH, white matter hyperintensities. (B) Performance metrics for Random Forest models that include or exclude feature-selected gut microbiome taxa (gray, no microbiome features; green, including relative abundances of feature-selected taxa). Boxplots summarize performance metrics on the retained validation cohort of models trained on 100 random partitions of the training cohort. Means are denoted by “X” in the boxplots. **P < 0.01 and ***P < 0.001. ANOVAs with Tukey’s post hoc test, Bonferroni-adjusted for multiple comparisons at both ANOVA and Tukey post hoc levels. (C) Importance of the features included in each model, averaged over the 100 training partitions (black), optionally with random class label shuffling at each iteration to generate null distributions (pink). Error bars represent SD. The seven taxonomic features are highlighted in green. ***P < 0.001. Student’s t test with Benjamini-Hochberg adjustment (see Table 2 and figs. S5 and S6).

Comment in

References

    1. Shreiner AB, Kao JY, Young VB, The gut microbiome in health and in disease. Curr. Opin. Gastroenterol 31, 69–75 (2015). - PMC - PubMed
    1. Valdes AM, Walter J, Segal E, Spector TD, Role of the gut microbiota in nutrition and health. BMJ 361, k2179 (2018). - PMC - PubMed
    1. Hooper LV, Littman DR, Macpherson AJ, Interactions between the microbiota and the immune system. Science 336, 1268–1273 (2012). - PMC - PubMed
    1. Ruiz L, Delgado S, Ruas-Madiedo P, Sánchez B, Margolles A, Bifidobacteria and their molecular communication with the immune system. Front. Microbiol 8, 2345 (2017). - PMC - PubMed
    1. Haran JP, Bhattarai SK, Foley SE, Dutta P, Ward DV, Bucci V, McCormick BA, Gilbert J, Faith J, Alzheimer’s disease microbiome is associated with dysregulation of the anti-inflammatory P-glycoprotein pathway. MBio 10, (2019). - PMC - PubMed

Publication types

Substances