. 2023 Jun 16;9(24):eadf9426.
doi: 10.1126/sciadv.adf9426. Epub 2023 Jun 14.

Terahertz optical solitons from dispersion-compensated antenna-coupled planarized ring quantum cascade lasers

Affiliations

Terahertz optical solitons from dispersion-compensated antenna-coupled planarized ring quantum cascade lasers

Paolo Micheletti et al. Sci Adv. .

Abstract

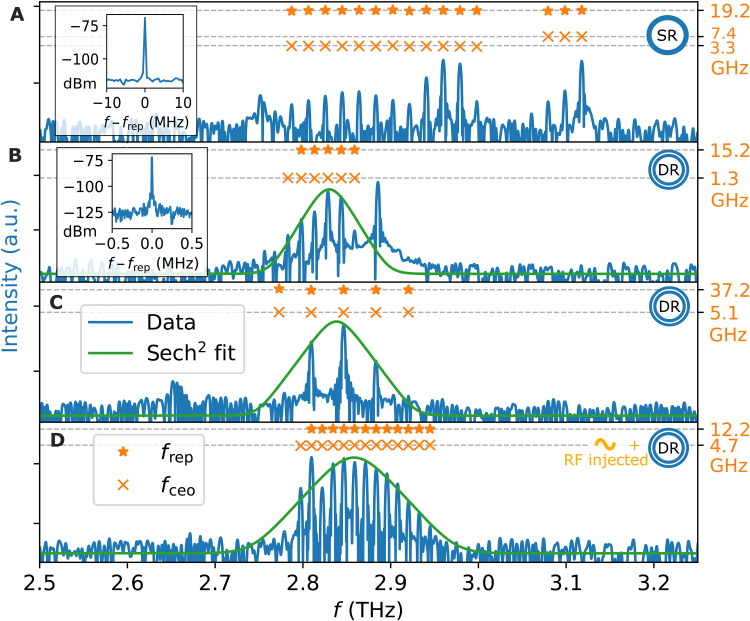
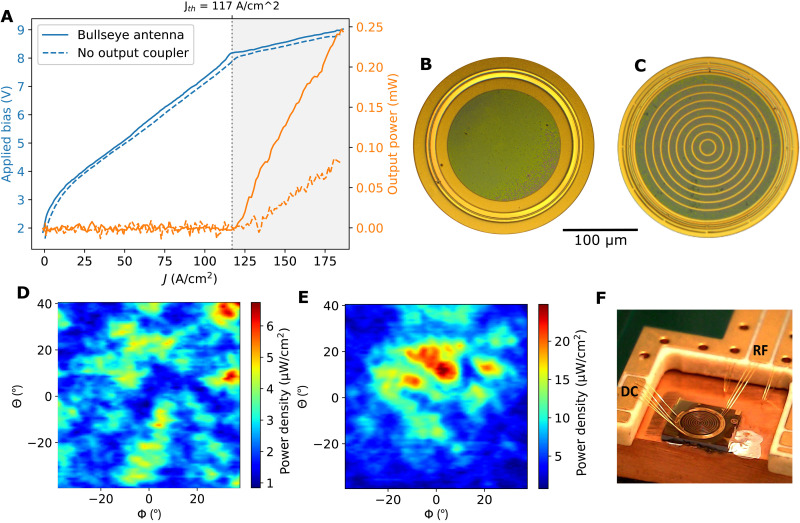
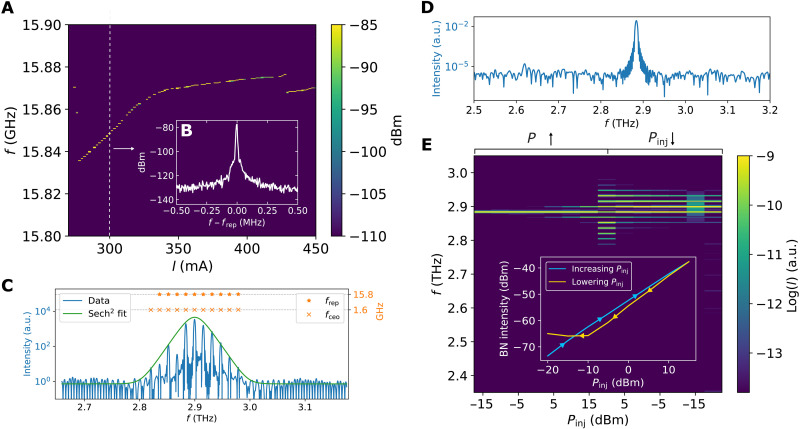
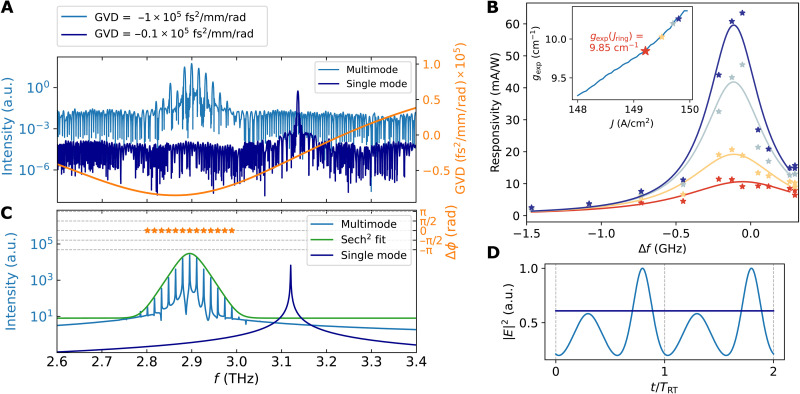
Quantum cascade lasers (QCLs) constitute an intriguing opportunity for the generation of on-chip optical dissipative Kerr solitons (DKSs). Originally demonstrated in passive microresonators, DKSs were recently observed in mid-infrared ring QCL paving the way for their achievement even at longer wavelengths. To this end, we realized defect-free terahertz ring QCLs featuring anomalous dispersion leveraging on a technological platform based on waveguide planarization. A concentric coupled waveguide approach is implemented for dispersion compensation, while a passive broadband bullseye antenna improves the device power extraction and far field. Comb spectra featuring sech2 envelopes are presented for free-running operation. The presence of solitons is further supported by observing the highly hysteretic behavior, measuring the phase difference between the modes, and reconstructing the intensity time profile highlighting the presence of self-starting 12-picosecond-long pulses. These observations are in very good agreement with our numeric simulations based on a Complex Ginzburg-Landau Equation (CGLE).


Figures

Fig. 1.
Fig. 1.. Device scheme and modes simulation.
(A) Scanning electron microscopy image of a 650-μm-radius double waveguide ring before BCB planarization. A schematic representation of the top contact (yellow) is reported on the picture. The inner and outer waveguides are indicated in red and blue, respectively. GND, ground (B) Vertical component of the E field of the symmetric (top) and (antisymmetric) supermode in a double waveguide. (C) Simulated effective refractive index, overlap factor (Γ), and GVD.
Fig. 2.
Fig. 2.. Free-running spectra.
CW spectra of different devices (A to D) (blue traces) are displayed in log scale, with a sech2 fit of the spectral envelope (B to D) (green trace). The peak spacing, i.e., frep (⋆) and the fceo (×) computed from the DC spectra, is reported on top. (A) Free running spectrum of an SR with a 650-μm-radius and a 60-μm-wide waveguide. The device is driven in CW at 750 mA (9.2 V) and kept at a heat sink temperature of 20 K. The device beatnote measured from the bias tee with a Rohde & Schwarz FSW-67 spectrum analyzer is shown in the inset. (B) Free running spectrum of a 800-μm-radius DR with waveguide widths of 35 μm (inner) and 25 μm (outer) biased with 1.045 A (9.5 V) at 35 K. The inset reports an electrical measurement of the beatnote. (C) Free running spectrum of a 1-mm-radius DR ring. The waveguides width is 36.5 μm (inner) and 28.5 μm (outer). The laser is biased with 0.96 A (8.8 V) at 30 K. (D) The same device is strongly injected with a +32-dBm RF signal with a frequency finj = 12.35 GHz while keeping the device at 30 K and with a 0.8-A (8.5 V) bias. a.u., arbitrary units.
Fig. 3.
Fig. 3.. Role of the bullseye antenna.
Voltage and output power as a function of current density of two devices with (solid lines) and without (dashed lines) bullseye antenna (A). The typical threshold is indicated with the dotted line, and the gray area represents the region above threshold. Optical microscopy of a fully processed device with simple top contact (B) and integrated bullseye antenna (C). Far-field measurement of a ring without (D) and with (E) antenna. Microscope image of an antenna-coupled DR device mounted with a printed circuit board (F).
Fig. 4.
Fig. 4.. Hysteretical behavior of the device.
(A) Electrical beatnote map of a 800-μm radius and a waveguide width of 22.8 and 17.2 μm (inner and outer, respectively) antenna-coupled ring laser measured from the device bias tee. The laser is driven in CW at 20 K. The beatnote (B) and spectrum (C) correspond to a driving current of 300 mA (8.5 V). (D) Spectrum of the same device and under the same operation condition as in (C) but reaching the bias point increasing the current slowly. (E) Terahertz spectra as a function of RF injection power. The bias point and temperature are the same as in (C) and (D). The intensity of the electrically measured beatnote during the power cycle is reported in the inset.
Fig. 5.
Fig. 5.. Comparison between experimental spectra and numerical simulation.
Comparison between the spectrum of the device presented in Fig. 4C (light blue) and a device with same nominal dimensions (dark blue trace) operating in single mode while biased at 300 mA (8.5 V) (A). The dispersion corresponding to the design of the devices obtained in the simulation described in the Materials and Methods section is superimposed on the spectra (orange trace). (B) Responsivity of a 2-mm-long, 50-μm-wide ridge laser biased below threshold as a function of the frequency detuning with respect to the source laser for different bias currents. The experimental data (⋆) are fitted with the model published in (35). In the fit (solid lines), we assumed an in-coupling efficiency ηopt = 1 × 10⁻⁴, αw = 7 cm−1, and front and back facet reflectivity of 0.4 and 0.6, respectively. The front facet reflectivity being lower because of the presence of the silicon lens. The gain extracted by fitting the responsivity curves is reported in the inset as a function of current density. The points relative to the data shown in (B) are indicated with the ⋆. The light-blue one, in particular, indicates the current density relative to the spectra reported in (A). Simulated spectra obtained solving the CGLE equation considering GVD = −1 × 10⁵ (light-blue spectrum) and −0.1 × 10⁵ fs2/mm per rad (dark-blue spectrum) (C). The phase difference of the modes (orange ⋆) and a sech2 fit of the spectral envelope (green trace) are reported for the multimode case. The field intensities relative to the two simulated states are displayed in (D) as a function of time, normalized on the roundtrip period TRT.
Fig. 6.
Fig. 6.. SWIFT spectroscopy measurement.
SWIFT spectroscopy of a 800-μm-radius, antenna-coupled, DR laser. The laser is driven in CW at 500 mA (7.7 V) and mildly RF-injected with −15-dBm signal at 15.65 GHz. The DC spectrum (measured with the DTGS detector) is reported in (A) and superimposed with a sech2 fit of the envelope and the frep and fceo computed from the DC measurement. (B) The spectral product [namely, IDC(ω)IDC(ω − frep), light blue trace] and ∣IiQ∣ spectrum (measured with the HEB, dark blue trace) are displayed. The phase differences between the modes are shown on top to the spectra, in between the corresponding modes (orange ⋆). The gray area indicates the considered spectral region, i.e., where the signal of the HEB is above the noise floor. The corresponding reconstructed intensity profile is reported in (D) (solid line) together with a sech2 fit of the pulse (dahsed line). The DC components and the IQ-demodulated optical beatnote are shown in (C). ZPD, Zero Path Delay.

References

    1. Kippenberg T. J., Gaeta A. L., Lipson M., Gorodetsky M. L., Dissipative Kerr solitons in optical microresonators. Science 361, eaan8083 (2018). - PubMed
    1. Herr T., Brasch V., Jost J. D., Wang C. Y., Kondratiev N. M., Gorodetsky M. L., Kippenberg T. J., Temporal solitons in optical microresonators. Nat. Photonics 8, 145–152 (2014).
    1. Matsko A., Savchenkov A., Liang W., Ilchenko V., Seidel D., Maleki L., Mode-locked Kerr frequency combs. Opt. Lett. 36, 2845, 2847 (2011). - PubMed
    1. Marin-Palomo P., Kemal J. N., Karpov M., Kordts A., Pfeifle J., Pfeiffer M. H., Trocha P., Wolf S., Brasch V., Anderson M. H., Rosenberger R., Vijayan K., Freude W., Kippenberg T. J., Koos C., Microresonator-based solitons for massively parallel coherent optical communications. Nature 546, 274–279 (2017). - PubMed
    1. Trocha P., Karpov M., Ganin D., Pfeiffer M. H., Kordts A., Wolf S., Krockenberger J., Marin-Palomo P., Weimann C., Randel S., Freude W., Kippenberg T., Koos C., Ultrafast optical ranging using microresonator soliton frequency combs. Science 359, 887–891 (2018). - PubMed