. 2023 Oct;20(10):1531-1537.
doi: 10.1513/AnnalsATS.202301-071RL.

The Epidemiology of Maternal Critical Illness between 2008 and 2021

Affiliations

The Epidemiology of Maternal Critical Illness between 2008 and 2021

Deepshikha Charan Ashana et al. Ann Am Thorac Soc. 2023 Oct.
No abstract available


Figures

Figure 1.
Figure 1.
Temporal trends in pregnancy and mortality rates among critically ill patients: (A) patients receiving mechanical ventilation and (B) patients with septic shock. Stacked bars display pregnancy rates among women of different ages who received mechanical ventilation (MV) or had septic shock and were discharged between 2008 and 2021. The line graph demonstrates mortality rates among pregnant women who received MV or had septic shock during the same hospital discharge years. We used 2012 as the reference year for MV logistic regression models because it had the lowest pregnancy rate and the lowest in-hospital mortality rate among pregnant patients receiving MV. In models adjusted for hospital Census Division, teaching status, urbanicity, and number of hospital beds, and with standard errors clustered by hospital, pregnancy rates were significantly higher (P < 0.05) in 2009 (odds ratio [OR], 1.32; 95% confidence interval [CI], 1.16–1.51), 2013 (OR, 1.14; 95% CI, 1.01–1.27), 2016 (OR, 1.15; 95% CI, 1.02–1.30), 2017 (OR, 1.23; 95% CI, 1.08–1.39), 2020 (OR, 1.22; 95% CI, 1.08–1.38), and 2021 (OR, 1.56; 95% CI, 1.36–1.79), and in-hospital mortality rates for pregnant patients were significantly higher in 2008 (OR, 2.03; 95% CI, 1.19–3.45), 2017 (OR, 1.69; 95% CI, 1.07–2.65), and 2021 (OR, 2.01; 95% CI, 1.31–3.09) compared with the reference year. We used 2018 as the reference year for septic shock logistic regression models because it had the lowest in-hospital mortality rate among pregnant patients with septic shock. In models adjusted for hospital Census Division, teaching status, urbanicity, and number of hospital beds, and with standard errors clustered by hospital, pregnancy rates were significantly different (P < 0.05) in 2008 (OR, 0.65; 95% CI, 0.49–0.87), 2009 (OR, 0.74; 95% CI, 0.59–0.93), 2010 (OR, 0.54; 95% CI, 0.42–0.70), 2011 (OR, 0.61; 95% CI, 0.48–0.78), 2012 (OR, 0.64; 95% CI, 0.51–0.79), 2013 (OR, 0.82; 95% CI, 0.68–0.99), 2020 (OR, 1.26; 95% CI, 1.09–1.45), and 2021 (OR, 1.41; 95% CI, 1.20–1.65), and in-hospital mortality rates for pregnant patients were significantly higher in 2009 (OR, 5.4; 95% CI, 2.25–13.0), 2010 (OR, 3.70; 95% CI, 1.43–9.57), 2013 (OR, 4.15; 95% CI, 1.85–9.30), 2015 (OR, 2.70; 95% CI, 1.22–5.98), and 2021 (OR, 3.44; 95% CI, 1.62–7.32) compared with the reference year.
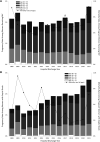
Figure 2.
Figure 2.
Regional estimates of pregnancy and mortality rates among critically ill patients, 2017–2021: (A) pregnancy among women receiving mechanical ventilation (MV), (B) mortality among pregnant women receiving MV, (C) pregnancy among women with septic shock, and (D) mortality among pregnant women with septic shock. All panels display adjusted rates and their 95% confidence intervals by U.S. Census Division among women who received MV or had septic shock and were discharged between 2017 and 2021. The U.S. Census Bureau defines four regions containing nine divisions. The Northeast region includes the New England (Connecticut, Maine, Massachusetts, New Hampshire, Rhode Island, and Vermont) and Middle Atlantic (New Jersey, New York, and Pennsylvania) divisions. The Midwest region includes the East North Central (Illinois, Indiana, Michigan, Ohio, and Wisconsin) and West North Central (Iowa, Kansas, Minnesota, Missouri, Nebraska, North Dakota, and South Dakota) divisions. The South region includes the South Atlantic (Delaware, Florida, Georgia, Maryland, North Carolina, South Carolina, Virginia, Washington, DC, and West Virginia), East South Central (Alabama, Kentucky, Mississippi, and Tennessee), and West South Central (Arkansas, Louisiana, Oklahoma, Texas) divisions. The West region includes the Mountain (Arizona, Colorado, Idaho, Montana, Nevada, New Mexico, Utah, and Wyoming) and Pacific (Alaska, California, Hawaii, Oregon, and Washington) regions.
Figure 2.
Figure 2.
Regional estimates of pregnancy and mortality rates among critically ill patients, 2017–2021: (A) pregnancy among women receiving mechanical ventilation (MV), (B) mortality among pregnant women receiving MV, (C) pregnancy among women with septic shock, and (D) mortality among pregnant women with septic shock. All panels display adjusted rates and their 95% confidence intervals by U.S. Census Division among women who received MV or had septic shock and were discharged between 2017 and 2021. The U.S. Census Bureau defines four regions containing nine divisions. The Northeast region includes the New England (Connecticut, Maine, Massachusetts, New Hampshire, Rhode Island, and Vermont) and Middle Atlantic (New Jersey, New York, and Pennsylvania) divisions. The Midwest region includes the East North Central (Illinois, Indiana, Michigan, Ohio, and Wisconsin) and West North Central (Iowa, Kansas, Minnesota, Missouri, Nebraska, North Dakota, and South Dakota) divisions. The South region includes the South Atlantic (Delaware, Florida, Georgia, Maryland, North Carolina, South Carolina, Virginia, Washington, DC, and West Virginia), East South Central (Alabama, Kentucky, Mississippi, and Tennessee), and West South Central (Arkansas, Louisiana, Oklahoma, Texas) divisions. The West region includes the Mountain (Arizona, Colorado, Idaho, Montana, Nevada, New Mexico, Utah, and Wyoming) and Pacific (Alaska, California, Hawaii, Oregon, and Washington) regions.

References

    1. Declercq E, Zephyrin LC.2020. https://www.commonwealthfund.org/publications/issue-brief-report/2020/de...
    1. Kern-Goldberger AR, Arditi B, Wen T, Guglielminotti J, Gyamfi-Bannerman C, D’Alton M, et al. Risk for and disparities in critical care during delivery hospitalizations. Am J Obstet Gynecol MFM. 2021;3:100354. - PubMed
    1. Vilda D, Wallace ME, Daniel C, Evans MG, Stoecker C, Theall KP. State abortion policies and maternal death in the United States, 2015‒2018. Am J Public Health . 2021;111:1696–1704. - PMC - PubMed
    1. Gu N, Zheng Y, Dai Y. Severe maternal morbidity: admission shift from intensive care unit to obstetric high-dependency unit. BMC Pregnancy Childbirth . 2022;22:140. - PMC - PubMed
    1. Chang DW, Shapiro MF. Association between intensive care unit utilization during hospitalization and costs, use of invasive procedures, and mortality. JAMA Intern Med . 2016;176:1492–1499. - PubMed

Publication types