. 2023 Jun 13;18(6):1371-1387.
doi: 10.1016/j.stemcr.2023.05.004.

Nutritional requirements of human induced pluripotent stem cells

Affiliations

Nutritional requirements of human induced pluripotent stem cells

Davi M Lyra-Leite et al. Stem Cell Reports. .

Abstract

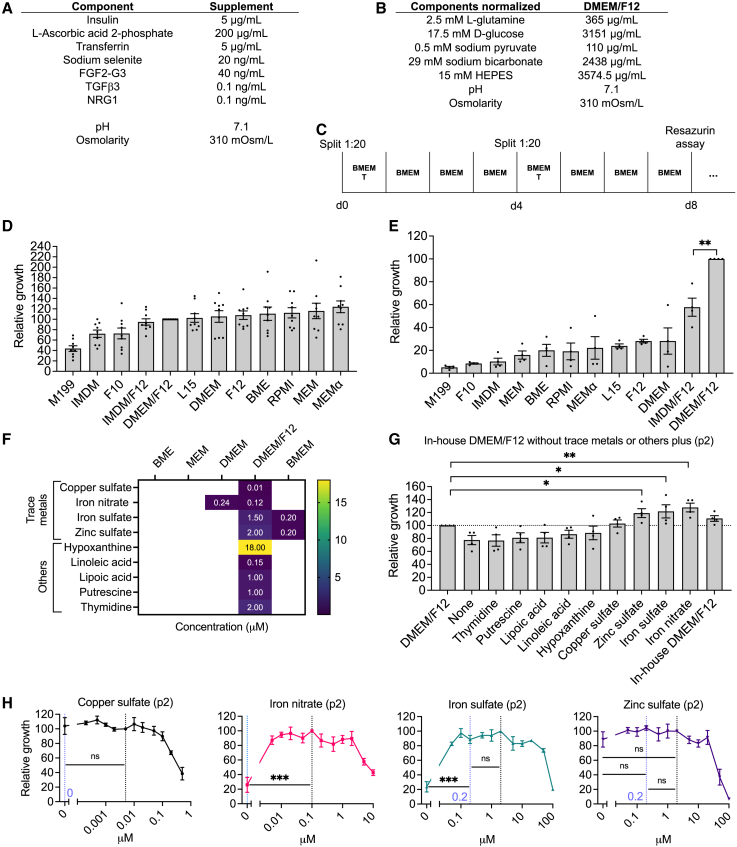
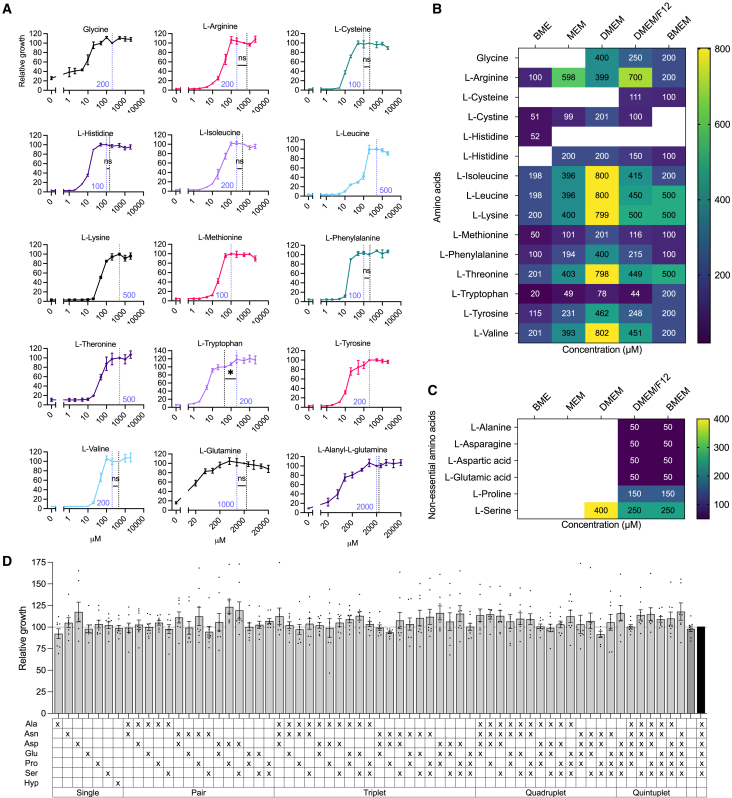
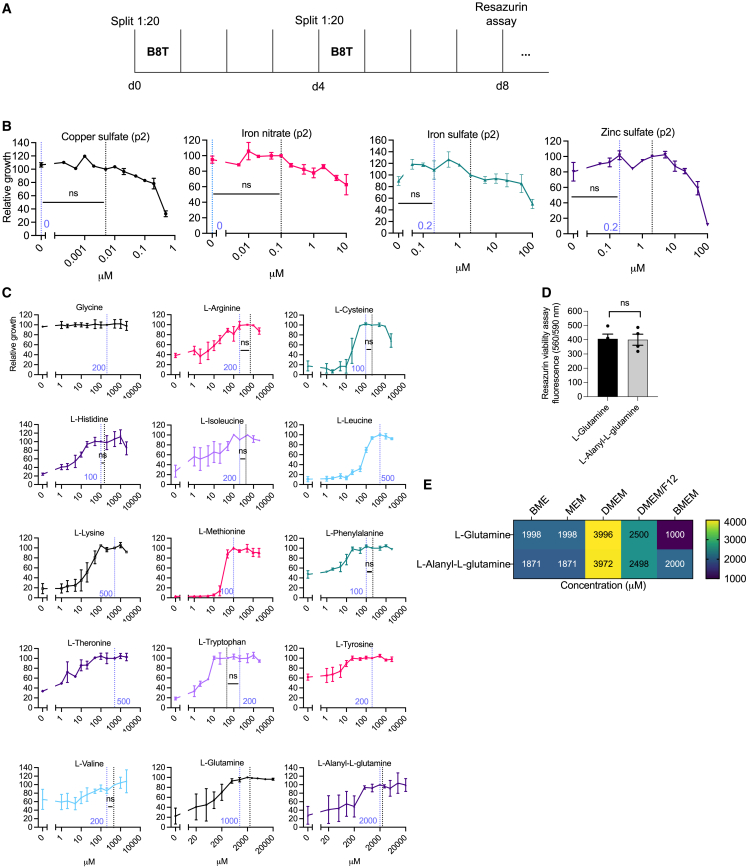
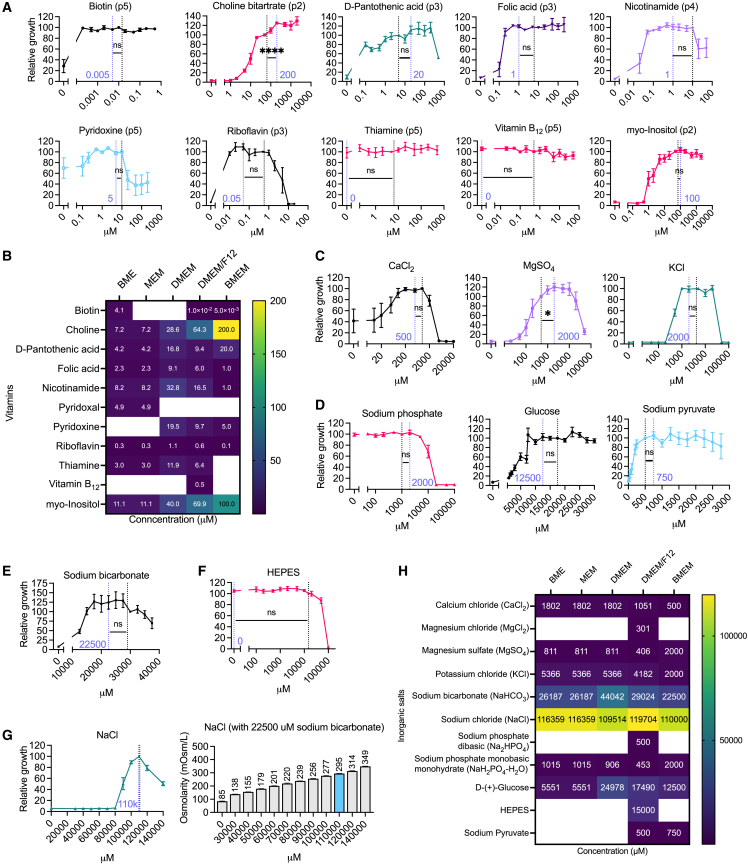
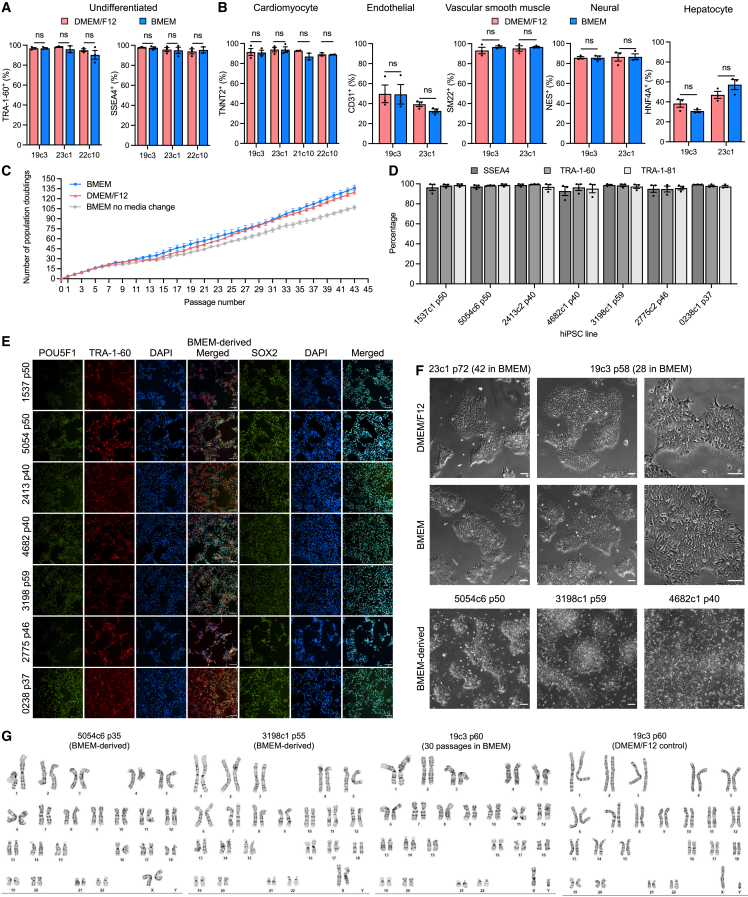
The nutritional requirements for human induced pluripotent stem cell (hiPSC) growth have not been extensively studied. Here, building on our prior work that established the suitable non-basal medium components for hiPSC growth, we develop a simplified basal medium consisting of just 39 components, demonstrating that many ingredients of DMEM/F12 are either not essential or are at suboptimal concentrations. This new basal medium along with the supplement, which we call BMEM, enhances the growth rate of hiPSCs over DMEM/F12-based media, supports derivation of multiple hiPSC lines, and allows differentiation to multiple lineages. hiPSCs cultured in BMEM consistently have enhanced expression of undifferentiated cell markers such as POU5F1 and NANOG, along with increased expression of markers of the primed state and reduced expression of markers of the naive state. This work describes titration of the nutritional requirements of human pluripotent cell culture and identifies that suitable nutrition enhances the pluripotent state.

Keywords: Cell culture media; chemically defined; human induced pluripotent stem cell.


Conflict of interest statement

Conflict of interests R.R.C., P.P.F., and D.E.M. are employees of Clever Carnivore, Inc. P.W.B is a co-founder of Clever Carnivore, Inc.

Figures

Figure 1
Figure 1
Comparison of existing basal media for hiPSC growth (A) Concentrations of medium formula components previously optimized for B8 with modifications to reduce cost. (B) Concentrations of the major components in DMEM/F12. For all commercial basal medium tested, the concentrations of these components were adjusted to match these DMEM/F12 concentrations. (C) Schematic of daily medium exchange schedule. (D) Comparison of hiPSC growth in B8 with various common commercial basal media, using a one-passage, daily medium change assay. Normalized to DMEM/F12. n = 9, two hiPSC lines (19c3 and 23c1). None were significantly better than DMEM/F12. (E) Comparison of hiPSC growth in B8 with various common commercial basal media using a three-passage assay. Normalized to DMEM/F12. n = 4, two hiPSC lines (19c3 and 23c1). All were significantly worse than DMEM/F12. (F) Heatmap-based comparison of media components found in DMEM/F12 but not in other common media formulations. (G) Comparison of hiPSC growth in our in-house DMEM/F12 formula without trace metals or extras but with the addition individual components at concentrations used in DMEM/F12. Normalized to commercial DMEM/F12, two-passage assay, n = 4, two hiPSC lines (19c3 and 23c1). (H) Titration of copper, iron, and zinc concentrations, with daily medium change, two-passage assay, n = 4, two hiPSC lines (19c3 and 23c1). Normalized to concentration in DMEM/F12, indicated by a dashed black line. Concentration selected for BMEM is indicated by a dashed blue line. All error bars are SEM, and “n” indicates the number of independent replicates from separate experiments. ns, p > 0.05, p ≤ 0.05, ∗∗p ≤ 0.01, ∗∗∗p ≤ 0.001.
Figure 2
Figure 2
Titration of amino acid concentrations for hiPSC growth (A) Titration of essential amino acid concentrations with daily medium change. Normalized to concentration in DMEM/F12, indicated by a dashed black line. Concentration selected for BMEM is indicated by a dashed blue line. Two-passage assay (except for L-glutamine and L-alanyl-L-glutamine, which was a three-passage assay), n = 4, two hiPSC lines (19c3 and 23c1). (B) Heatmap-based comparison of essential amino acid concentrations found in common media formulations compared with BMEM. (C) Heatmap-based comparison of non-essential amino acid concentrations found in common media formulations compared with BMEM. (D) Addition of individual non-essential amino acid or combination in pairs, triples, quartets, or quintets, with daily medium change. Five-passage assay, n = 7–8, two hiPSC lines (19c3 and 23c1). All error bars are SEM, and “n” indicates the number of independent replicates from separate experiments. ns, p > 0.05, p ≤ 0.05.
Figure 3
Figure 3
Titration of trace metal and essential amino acid concentrations for hiPSC growth using a “no medium change” strategy (A) Schematic of no medium change schedule; using this method, thiazovivin is always in the medium. (B) Titration of copper, iron, and zinc concentrations, without daily medium change, two-passage assay. n = 2, two hiPSC lines (19c3 and 23c1). (C) Titration of essential amino acid concentrations without daily medium change. Two-passage assay (except for L-glutamine and L-alanyl-L-glutamine which was a three-passage assay), n = 2–4, two hiPSC lines (19c3 and 23c1). (D) Comparison of growth using a no medium change strategy in media with either 1,000 μM of L-glutamine or 2,000 μM of L-alanyl-L-glutamine, three-passage assay, n = 4, two hiPSC lines (19c3 and 23c1). (E) Heatmap of concentrations of L-glutamine or L-alanyl-L-glutamine (GlutaMAX) found in common medium compared with BMEM. Normalized to concentration in DMEM/F12, indicated by a dashed black line. Concentration selected for BMEM is indicated by a dashed blue line. All error bars are SEM, and “n” indicates the number of independent replicates from separate experiments. ns, p > 0.05.
Figure 4
Figure 4
Titration of vitamin, salt, glucose, and pyruvate concentrations for hiPSC growth Titration experiments with daily medium change, where relative growth is normalized to DMEM/F12 concentration indicated by a dashed black line. Selected BMEM concentrations are indicated by dashed purple lines. (A) Titration of vitamin concentrations. n = 4–9, two hiPSC lines (19c3 and 23c1), number of passages required for absence of vitamin to result in complete cell death is indicated, up to five passages. (B) Heatmap-based comparison of vitamin concentrations found in common media formulations compared with BMEM. (C) Titration of inorganic salts concentrations. Two-passage assay (except for sodium phosphate which was a five-passage assay), n = 4–6, two hiPSC lines (19c3 and 23c1). (D) Titration of sodium phosphate, glucose, and sodium pyruvate concentrations. Two-passage assay, n = 12–21, two hiPSC lines. (E) Titration of sodium bicarbonate concentration with pH normalized to 7.1. Two-passage assay, n = 12, two hiPSC lines (19c3 and 23c1). (F) Optimization of HEPES concentration pH normalized to 7.1. Two-passage assay, n = 7, two hiPSC lines (19c3 and 23c1). (G) Titration of NaCl concentration in the presence of 22,500 μM sodium bicarbonate and its regulation of medium osmolarity. Two-passage assay, n = 4, two hiPSC lines (19c3 and 23c1). (H) Heatmap-based comparison of inorganic salts and other component concentrations found in common media formulations compared with BMEM. All error bars are SEM, and “n” indicates the number of independent replicates from separate experiments. ns, p > 0.05, p ≤ 0.05, ∗∗∗∗p ≤ 0.0001.
Figure 5
Figure 5
Titration of vitamin, salt, glucose, and pyruvate concentrations for hiPSC growth using a “no medium change” strategy (A) Titration of vitamin concentrations, without medium change. n = 2–8, two hiPSC lines (19c3 and 23c1). (B) Titration of thiamine concentrations, with and without medium change when culturing cells in a normoxic (21% O2) rather than typical hypoxic (5% O2) environment. n = 2–8, two hiPSC lines (19c3 and 23c1). (C) Titration of inorganic salts concentrations. Two-passage assay, n = 2, two hiPSC lines (19c3 and 23c1). (D) Titration of sodium phosphate, glucose, and sodium pyruvate concentrations. Two-passage assay (except for sodium phosphate which was a five-passage assay), n = 2–10, two hiPSC lines (19c3 and 23c1). (E) Titration of sodium bicarbonate, HEPES, and NaCl, with no medium change. Two-passage assay, n = 2–3, two hiPSC lines (19c3 and 23c1). (F) Assessment of pH value changes in culture conditions without cells. After initial pH measurement, values were normalized to 7.1 and medium was incubated at 37°C with 5% CO2. All error bars are SEM. All values are normalized to the concentration in DMEM/F12, indicated by a dashed black line. Concentration selected for BMEM is indicated by a dashed blue line. All error bars are SEM, and “n” indicates the number of independent replicates from separate experiments. ns, p > 0.05, p ≤ 0.05, ∗∗p ≤ 0.01, ∗∗∗p ≤ 0.001, ∗∗∗∗p ≤ 0.0001.
Figure 6
Figure 6
Comparison gene expression in hiPSCs after culture in BMEM or DMEM/F12 (A) Hierarchical clustering of 250 most variable genes. (B) Principal-component analysis for the 30 samples, individual lines are encircled. (C) Volcano plot with undifferentiated state-affiliated genes labeled; up, higher expression in BMEM. (D) Comparative expression of undifferentiated state-affiliated genes in BMEM vs. DMEM/F12. Genes associated with the primed state are marked in blue and POU5F1, NANOG, and SOX2 are marked in dark gray. (E and F) Transcripts per million for POU5F1 (OCT4) expression (E) and NANOG (F) showing consistent higher expression in BMEM. All error bars are SEM from 15 conditions/cell lines.
Figure 7
Figure 7
Comparison of hiPSCs cultured and/or derived in BMEM or DMEM/F12 (A) Undifferentiated cell markers for are similarly expressed in hiPSC cell lines 19c3, 23c1, and 22c10 cultured in DMEM/F12 or BMEM (>25 passages). (B) BMEM-cultured hiPSCs (>25 passages) are equally capable of differentiating into cardiomyocytes, endothelial, vascular smooth muscle cells, neural, and hepatocyte-like cells. (C) Comparison of growth when using BMEM with daily medium change (with thiazovivin for the first 24 h), BMEM without medium change (which has thiazovivin throughout) or DMEM/F12 with daily medium change (with thiazovivin for the first 24 h) over 44 passages, two hiPSC lines (19c3 and 23c1). 19c3 were kept in culture from passage 61 (after 31 passages in BMEM) to passage 105. 23c1 were kept in culture from passage 75 (after 45 passages in BMEM) to passage 119. (D) Undifferentiated cell marker expression in nine hiPSC lines derived in BMEM at >p37. (E) Immunocytochemistry analysis of seven hiPSC lines derived in BMEM at >p37. Scale bars, 100 μm. (F) Phase contrast images of hiPSC lines cultured in DMEM/F12 or BMEM (19c3 [28 passages in BMEM] and 23c1 [40 passages in BMEM]), and hiPSC lines both derived and cultured in BMEM (5054, 3198, and 4682). Scale bars, 100 μm. (G) Karyotyping for hiPSCs cultured in BMEM for >30 passages (19c3), and derived in BMEM (5054 and 3198) compared with standard culture conditions in DMEM/F12 (19c3). Each dot indicates an independent replicate from a separate experiment (n = 3–12). All error bars are SEM.

References

    1. Ackermann T., Tardito S. Cell culture medium formulation and its implications in cancer metabolism. Trends Cancer. 2019;5:329–332. doi: 10.1016/j.trecan.2019.05.004. - DOI - PMC - PubMed
    1. Amit M., Carpenter M.K., Inokuma M.S., Chiu C.P., Harris C.P., Waknitz M.A., Itskovitz-Eldor J., Thomson J.A. Clonally derived human embryonic stem cell lines maintain pluripotency and proliferative potential for prolonged periods of culture. Dev. Biol. 2000;227:271–278. doi: 10.1006/dbio.2000.9912. - DOI - PubMed
    1. Bardy C., van den Hurk M., Eames T., Marchand C., Hernandez R.V., Kellogg M., Gorris M., Galet B., Palomares V., Brown J., et al. Neuronal medium that supports basic synaptic functions and activity of human neurons in vitro. Proc. Natl. Acad. Sci. USA. 2015;112:E2725–E2734. doi: 10.1073/pnas.1504393112. - DOI - PMC - PubMed
    1. Bubber P., Ke Z.J., Gibson G.E. Tricarboxylic acid cycle enzymes following thiamine deficiency. Neurochem. Int. 2004;45:1021–1028. doi: 10.1016/j.neuint.2004.05.007. - DOI - PubMed
    1. Burridge P.W., Matsa E., Shukla P., Lin Z.C., Churko J.M., Ebert A.D., Lan F., Diecke S., Huber B., Mordwinkin N.M., et al. Chemically defined generation of human cardiomyocytes. Nat. Methods. 2014;11:855–860. doi: 10.1038/nmeth.2999. - DOI - PMC - PubMed

Publication types