. 2023 Jun 13;56(6):1303-1319.e5.
doi: 10.1016/j.immuni.2023.05.005.

Canonical BAF complex activity shapes the enhancer landscape that licenses CD8+ T cell effector and memory fates

Affiliations

Canonical BAF complex activity shapes the enhancer landscape that licenses CD8+ T cell effector and memory fates

Bryan McDonald et al. Immunity. .

Abstract

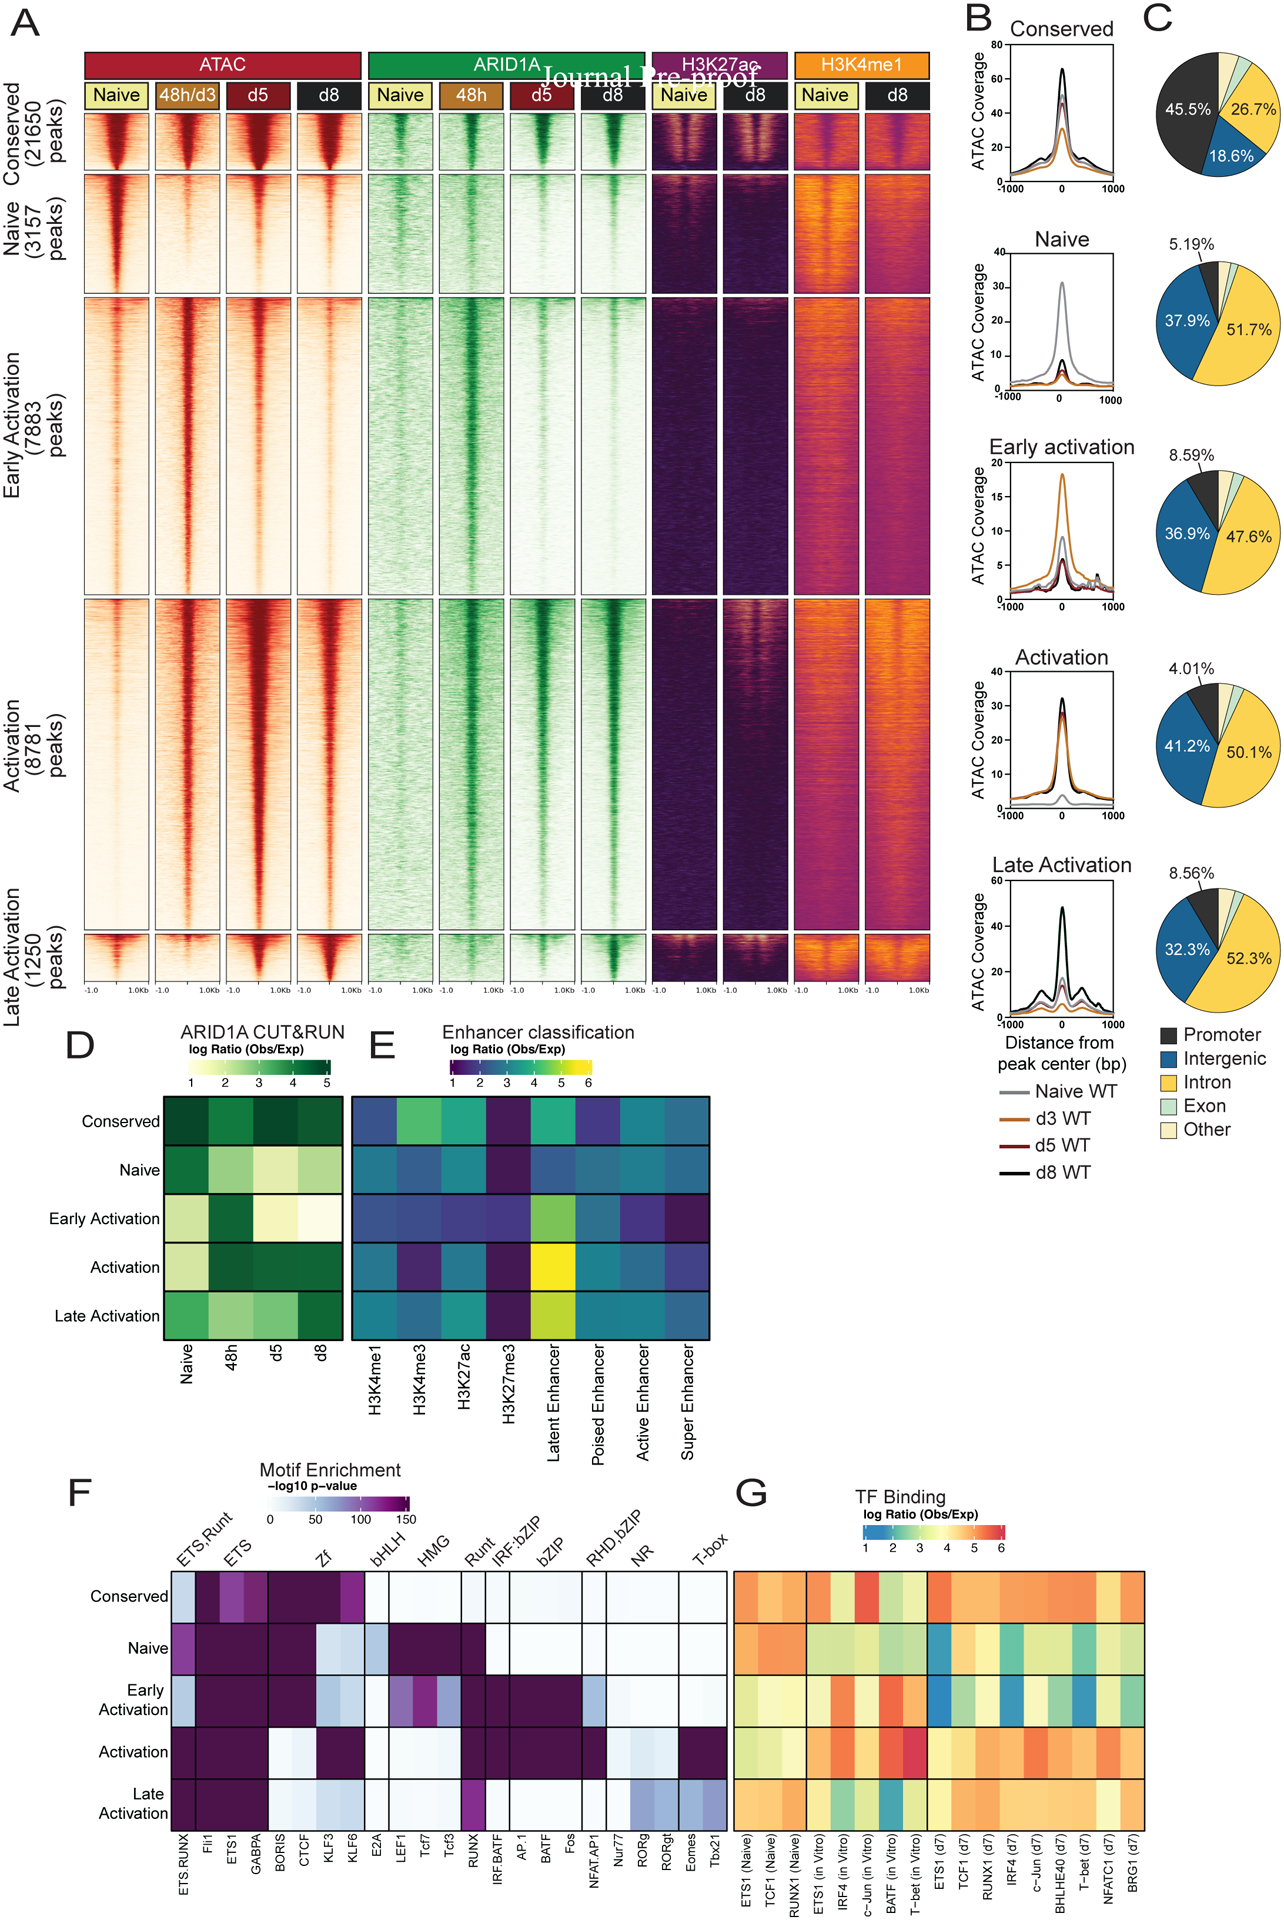
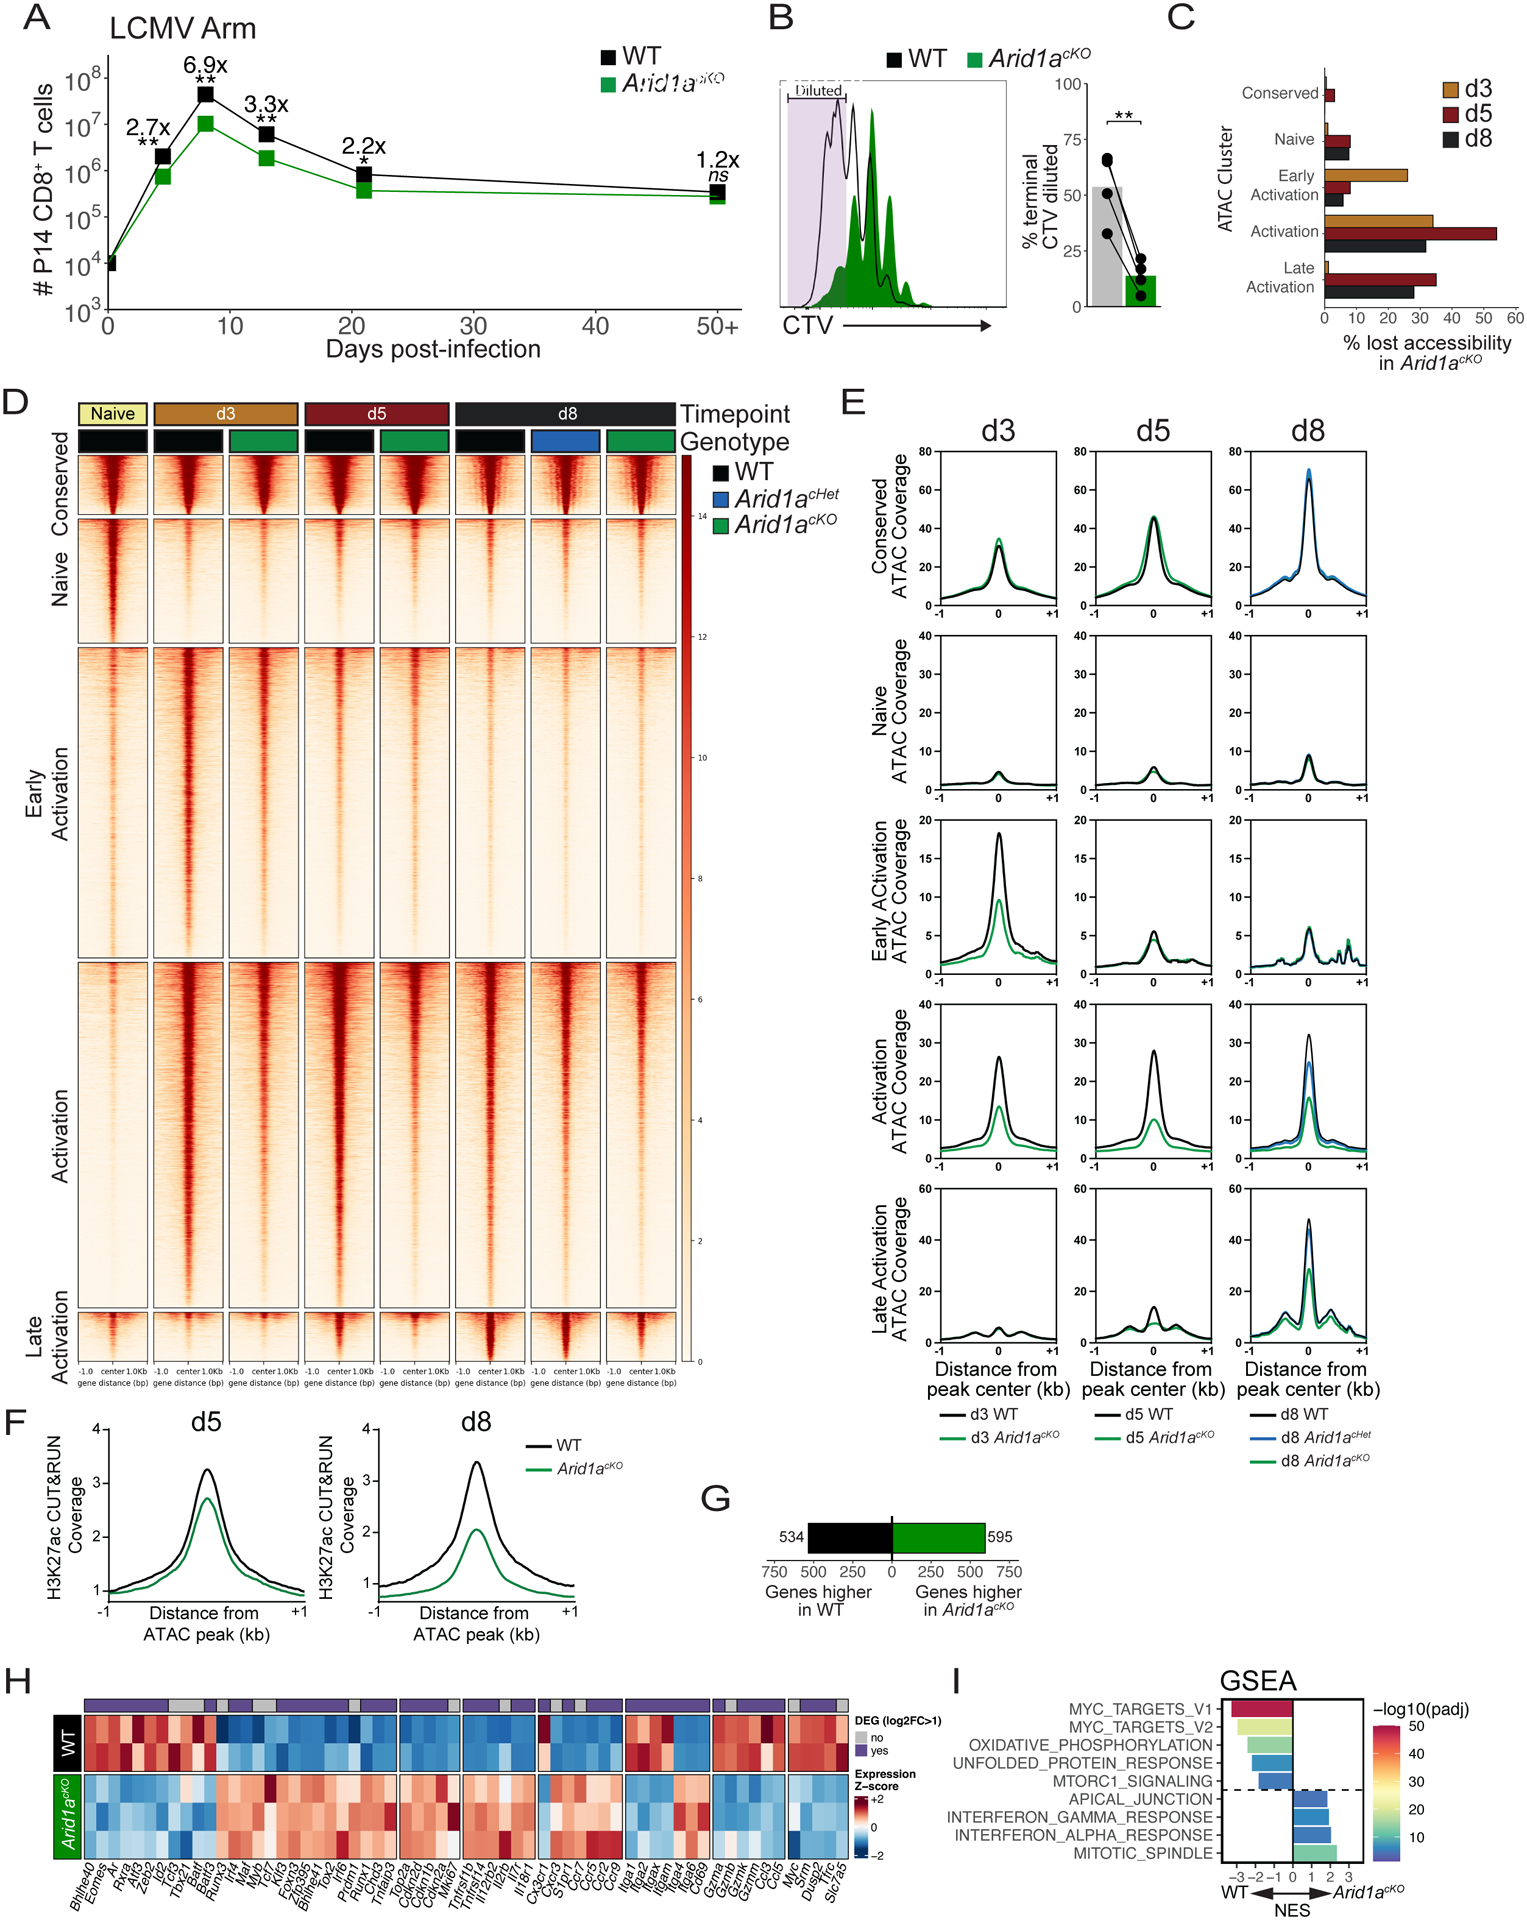
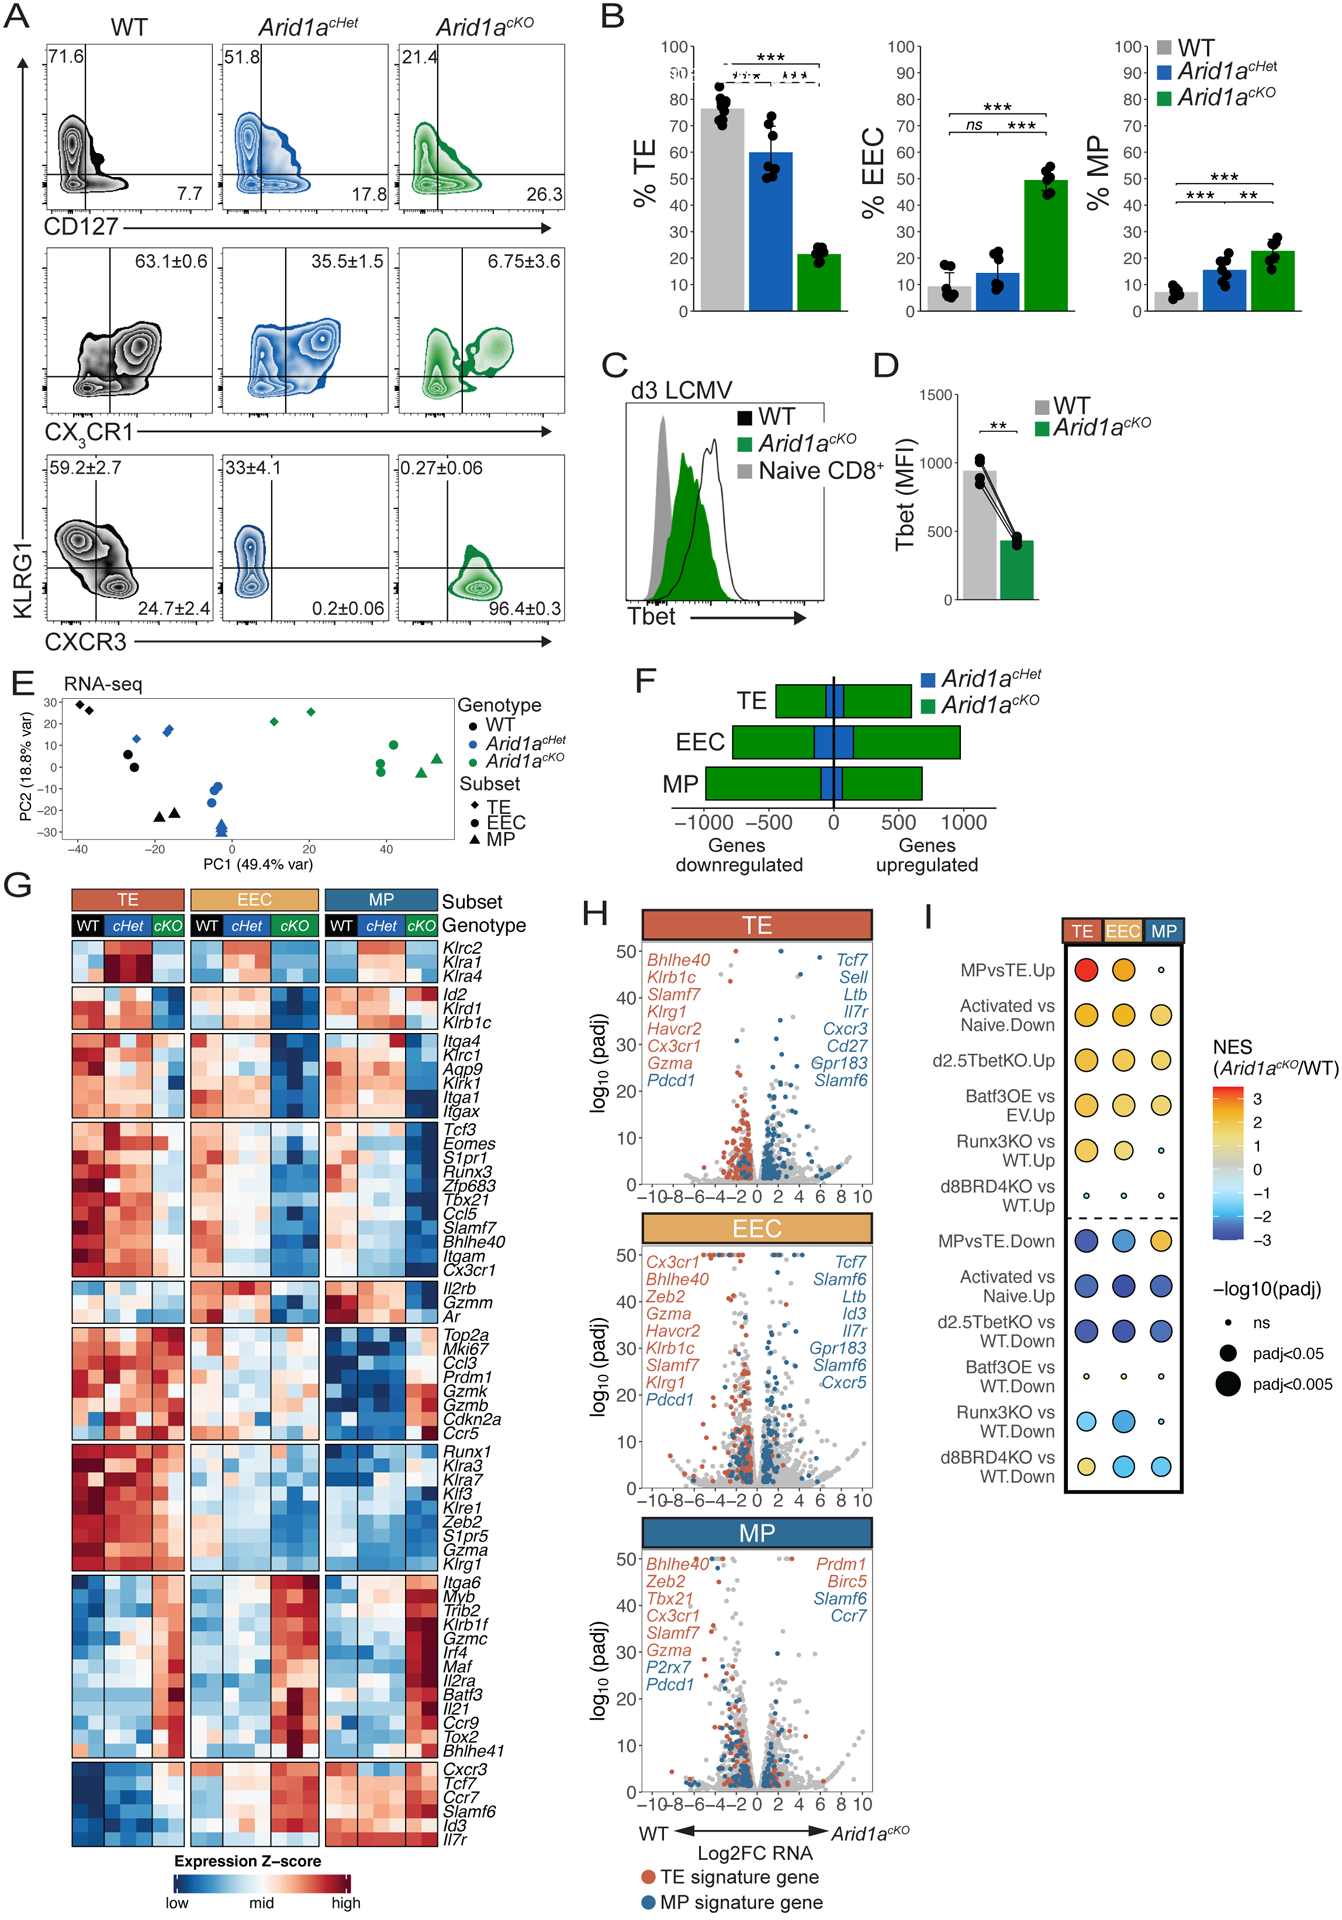
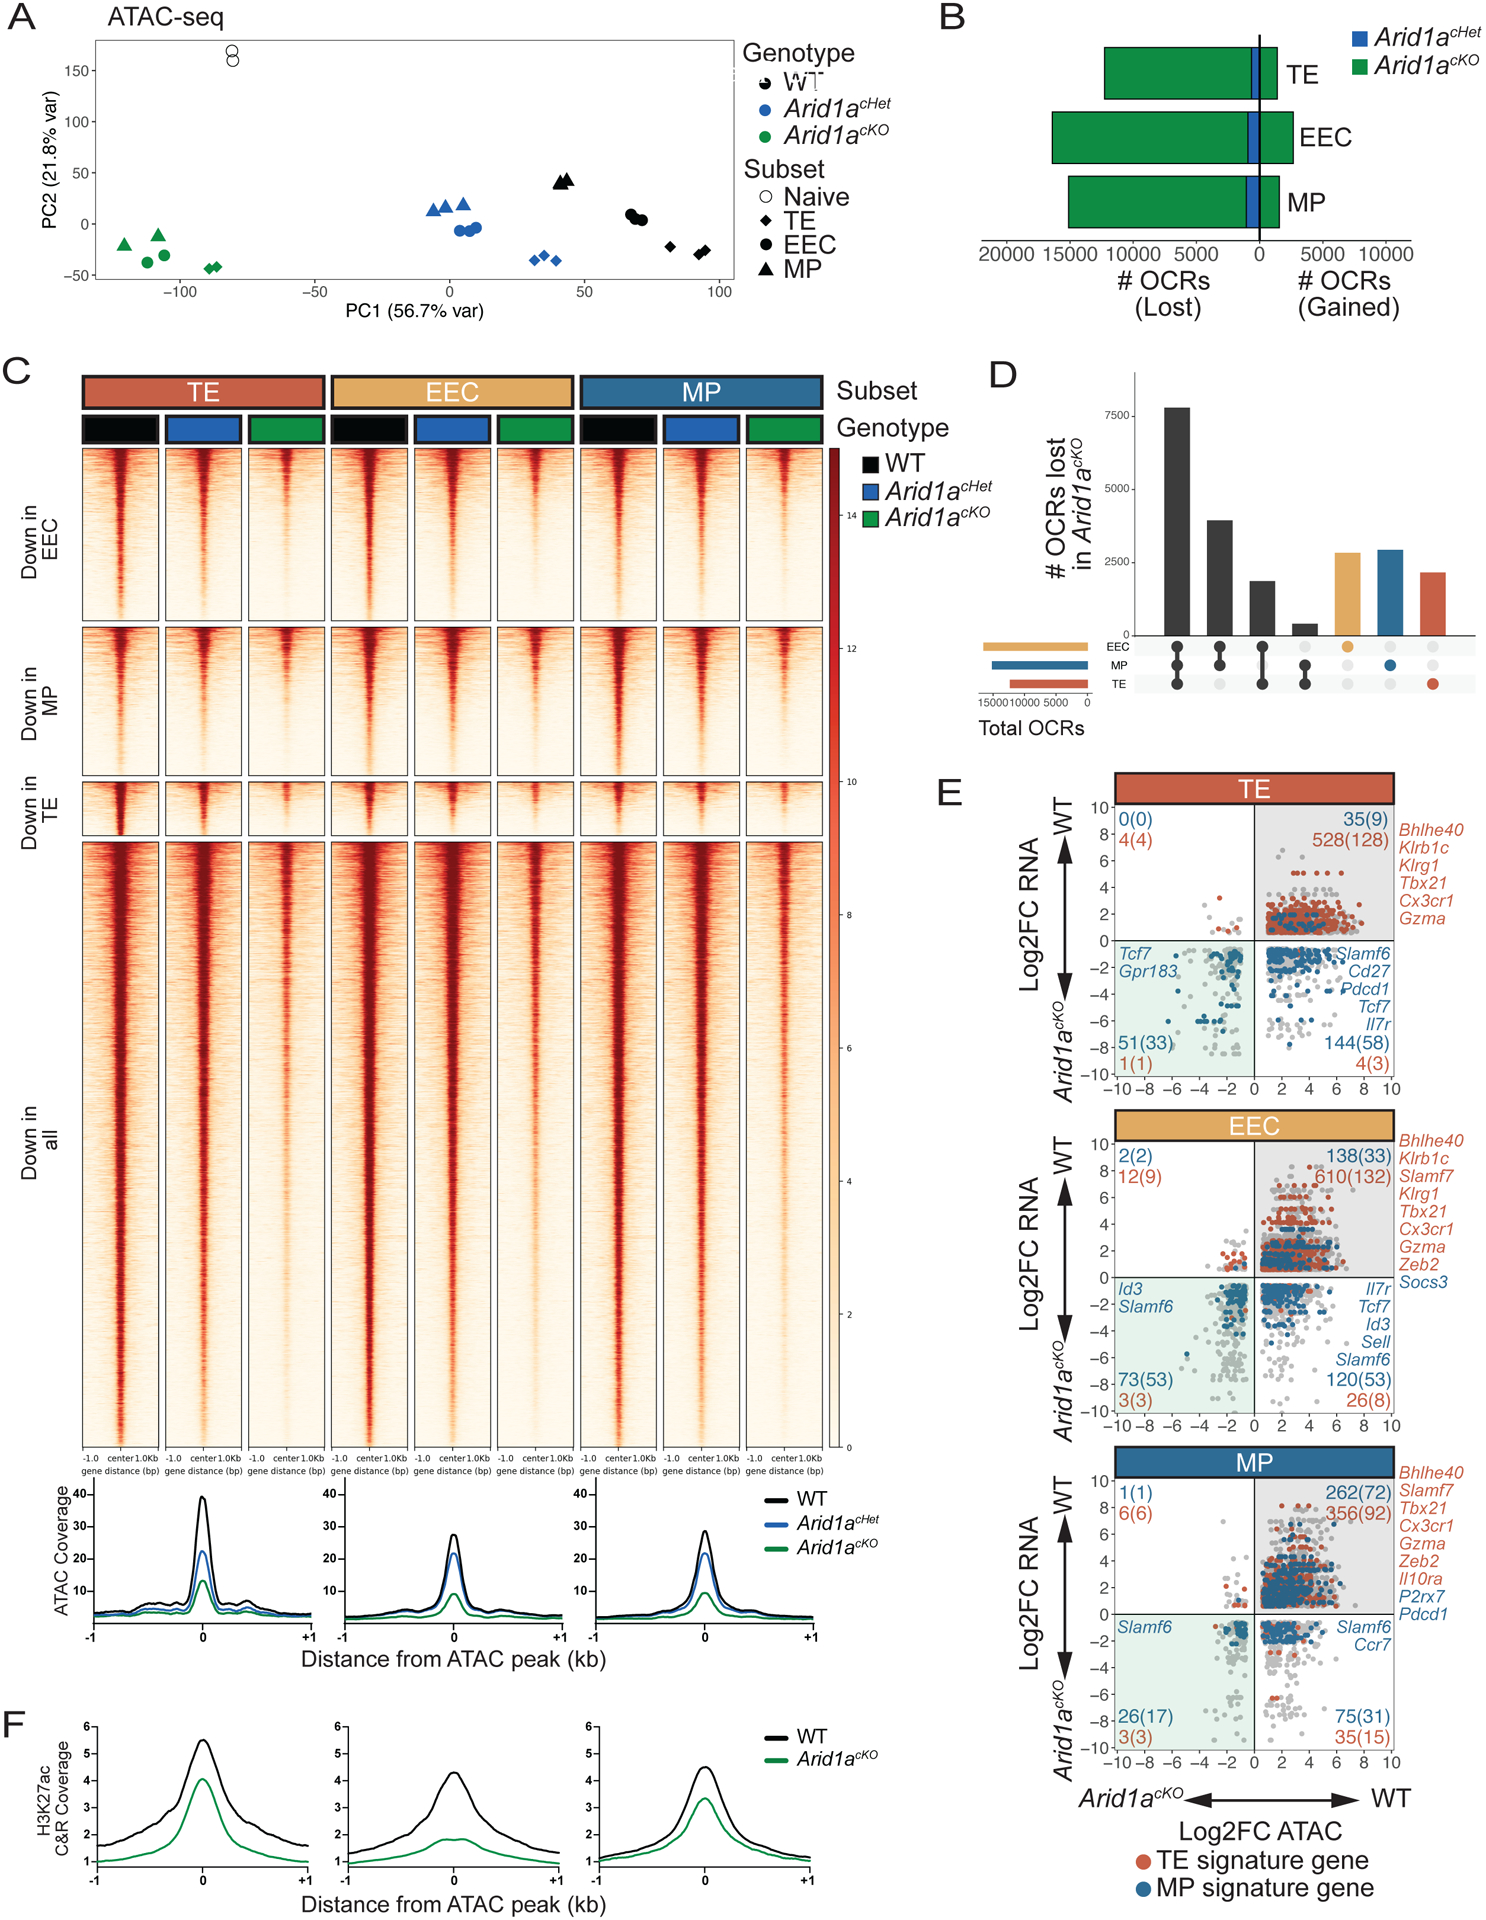
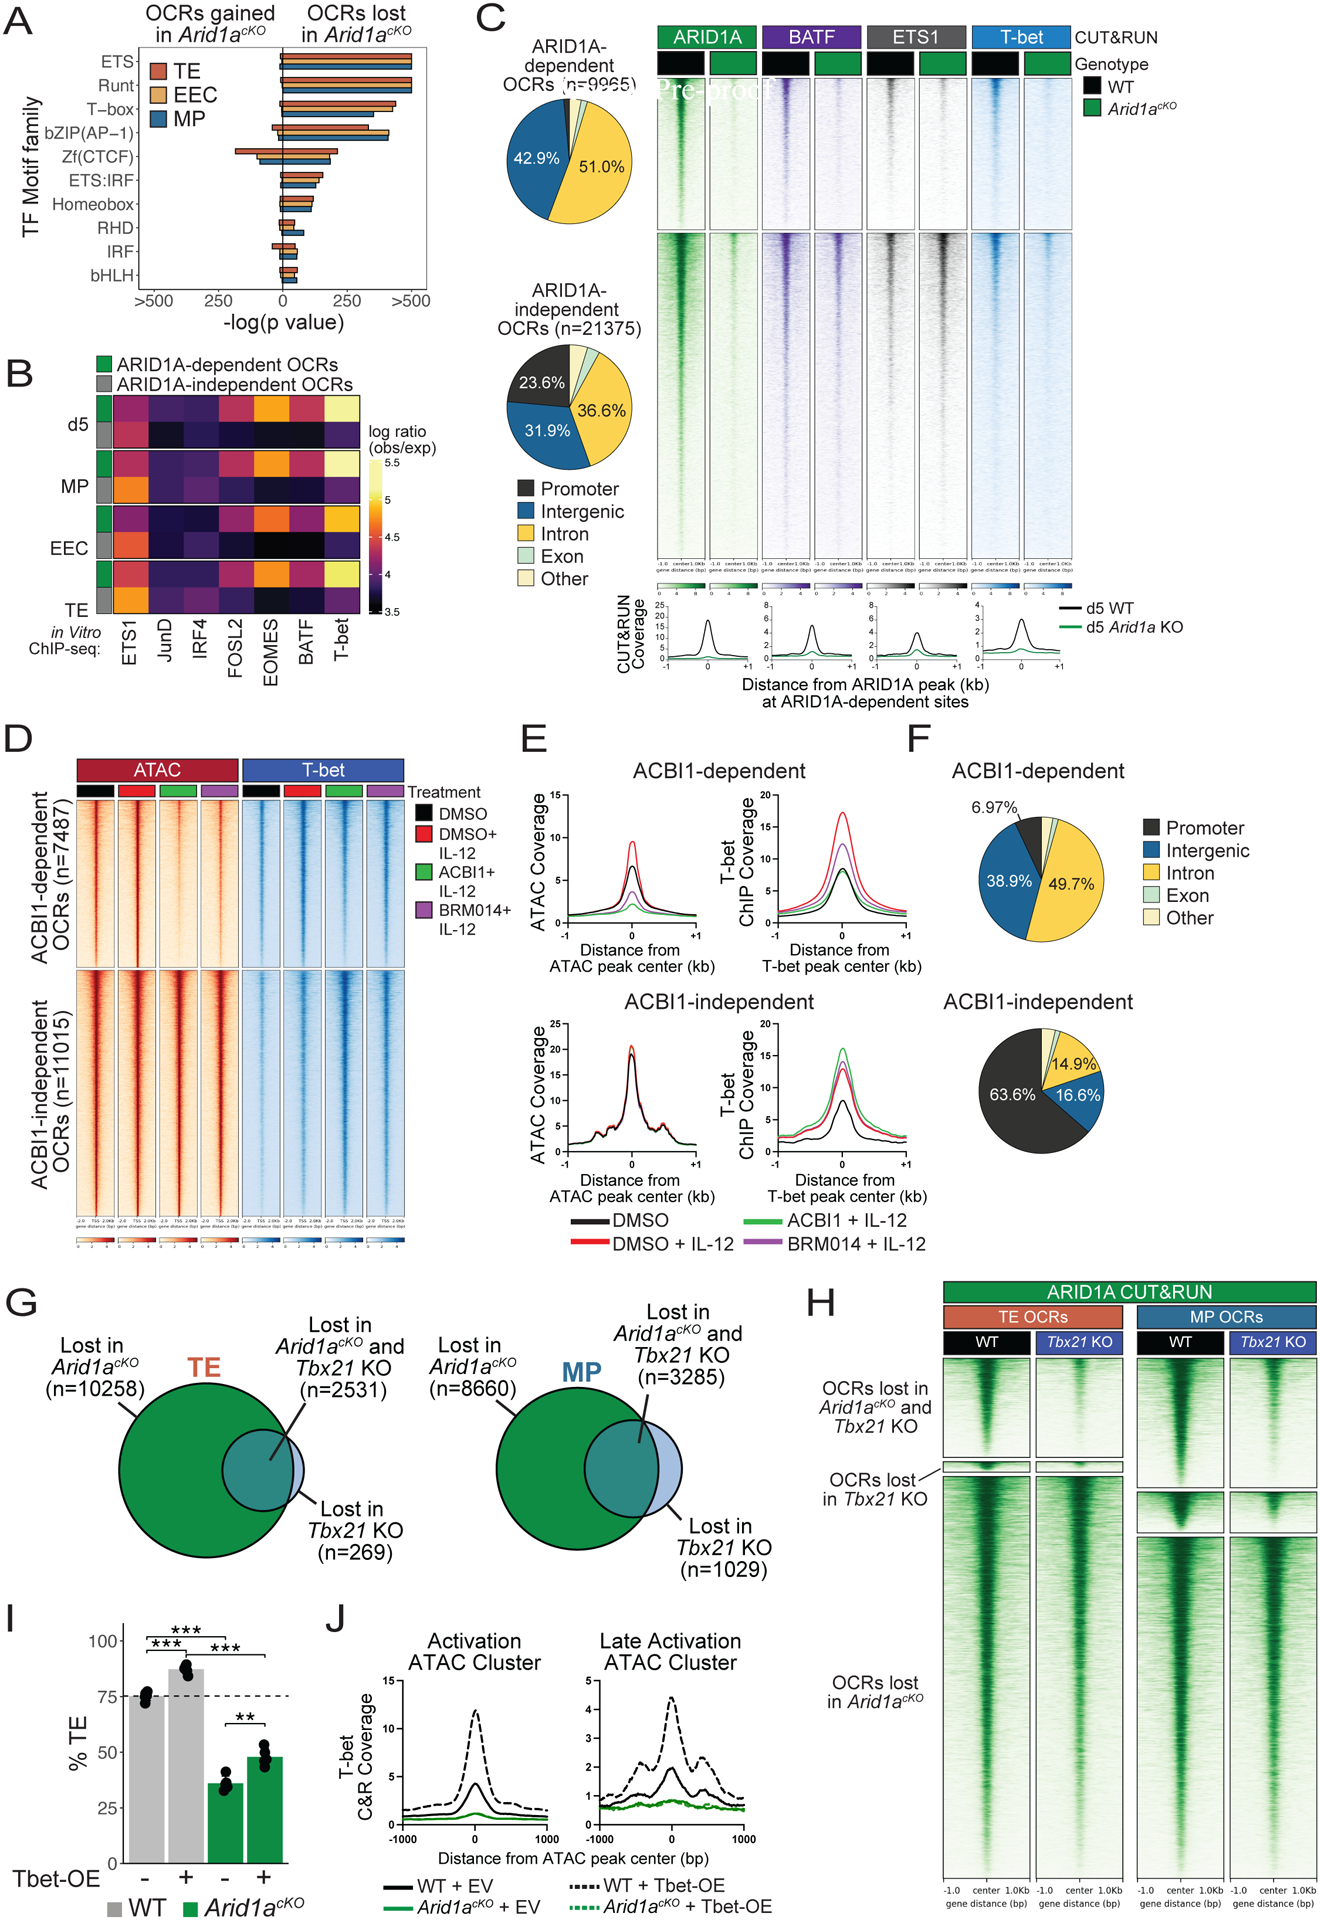
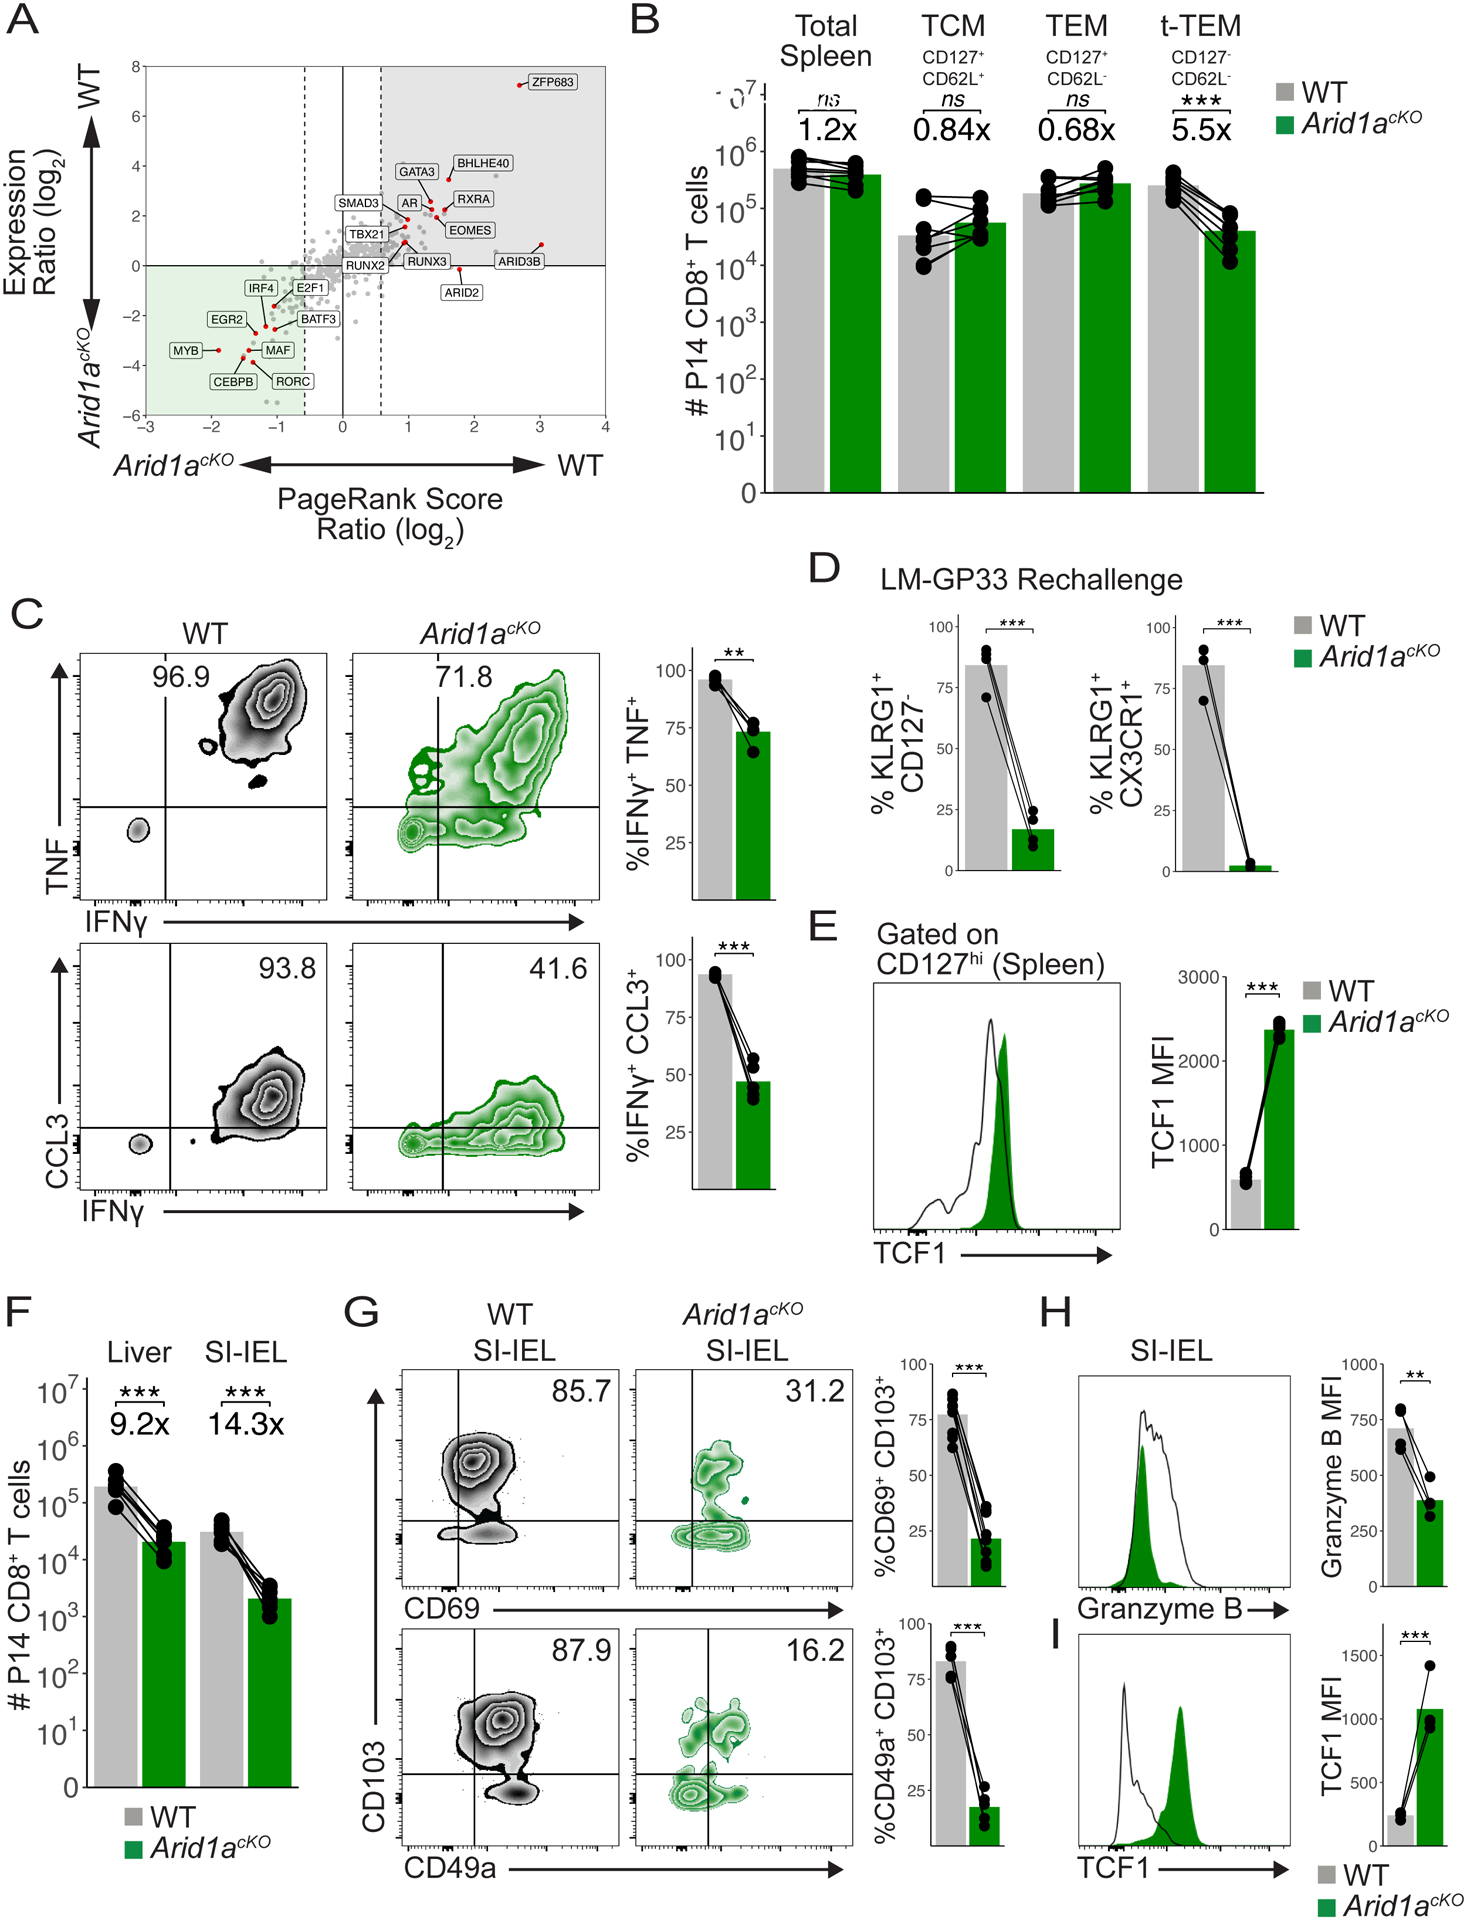
CD8+ T cells provide host protection against pathogens by differentiating into distinct effector and memory cell subsets, but how chromatin is site-specifically remodeled during their differentiation is unclear. Due to its critical role in regulating chromatin and enhancer accessibility through its nucleosome remodeling activities, we investigated the role of the canonical BAF (cBAF) chromatin remodeling complex in antiviral CD8+ T cells during infection. ARID1A, a subunit of cBAF, was recruited early after activation and established de novo open chromatin regions (OCRs) at enhancers. Arid1a deficiency impaired the opening of thousands of activation-induced enhancers, leading to loss of TF binding, dysregulated proliferation and gene expression, and failure to undergo terminal effector differentiation. Although Arid1a was dispensable for circulating memory cell formation, tissue-resident memory (Trm) formation was strongly impaired. Thus, cBAF governs the enhancer landscape of activated CD8+ T cells that orchestrates TF recruitment and activity and the acquisition of specific effector and memory differentiation states.

Keywords: ARID1A; BAF complex; CD8(+) T cells; antiviral immunity; chromatin remodeling; effector T cell; epigenetics; immunotherapy; memory T cell.


Conflict of interest statement

Declaration of interests S.M.K. is on the scientific advisory boards and has equity in EvolveImmune Therapeutics, Affini-T Therapeutics, Arvinas, and Pfizer.

Figures

Fig. 1.
Fig. 1.. Differentiating antiviral effector CD8+ T cells exhibit highly dynamic accessible chromatin and cBAF occupancy patterns.
(A) Signal tracks of ATAC-seq, ARID1A C&R, H3K27ac ChIP-Seq and H3K4me1 ChIP-Seq (GSE89036) in naïve, 48h in vitro activated, or d3, d5, or d8 P14 CD8+ T cells from LCMV-Armstrong infection. (B) ATAC-seq signal coverage and (C) annotation of OCRs from clusters in A. (D-G) Using the OCRs from clusters in (A) we correlated those with ARID1A binding (D), histone modifications to define enhancers (E), predicted TF motif enrichment (F) and actual TF binding (observed/expected) of the indicated TFs from public datasets (GSE54191, GSE192390, GSE166718) (G).
Fig 2.
Fig 2.. Arid1a promotes clonal expansion and opening of activation-induced enhancers.
(A) Numbers of WT (black) and Arid1acKO (green) P14 cells after infection with LCMV-Armstrong. n=8 (d4.5), 8–11 (d8), 4 (d13), 4 (d21), 8 (d50+). (B) CellTrace Violet dilution of WT and Arid1acKO P14 cells at 84h p.i. Frequency of cells that divided 7+ times are quantified in the bar graph. (C) Percentage of ATAC-seq peaks lost (2-fold change, FDR<0.05, Benjamini-Hochberg) in Arid1acKO relative to WT cells at d3, d5, and d8 p.i. (D, E) ATAC-seq signal coverage of WT and Arid1acKO P14 cells at d3, d5, and d8 p.i. using the same cluster designations defined in Figure 1A. (F) H3K27ac CUT&RUN signal coverage centered on ATAC-seq peaks in WT vs. Arid1acKO cells. (G-I) WT and Arid1acKO effector cells were isolated at d3 p.i. and compared for differentially expressed genes (DEGs) by RNA-sequencing (>2-fold change, adjusted p-value<0.05, Benjamini-Hochberg). Number of DEGs (G), heatmap of biologically relevant DEGs (H), and gene set enrichment analysis (GSEA) (I) between WT and Arid1acKO effector cells are shown. All heatmap genes shown have an adjusted p-value < 0.05. (I) Top 8 Hallmark gene sets (adjusted p value < 0.01, 10,000 permutations) are shown. ns, not significant; *p<0.05, **p<0.005.
Fig 3.
Fig 3.. Arid1a acts in a dose-dependent manner to specify effector subset gene expression patterns
(A,B) Surface marker expression of WT (black, n=11), Arid1acHet (blue, n=7), and Arid1acKO (green, n=7) P14 cells at d8–9 p.i. was analyzed by flow cytometry (A) and mean ± SEM frequencies of TE (KLRG1+CD127), MP (KLRG1CD127+), KLRG1+CX3CR1+, KLRG1+CXCR3, and KLRG1CXCR3+ cells are shown in bar graphs (B). (C,D) T-bet expression in WT and Arid1acKO P14 cells at d3 p.i. (D) Paired t-test. (E-I) WT, Arid1acKO and Arid1acHet effector cells were isolated at d8 p.i. and sorted based on expression of TE, EEC and MP markers as defined in (A) and differentially expressed genes (DEGs) were identified by RNA-seq. Principal component analysis plot of all the samples (E), number of DEGs (F), heatmap of select DEGs (G), volcano plots of all DEGs including highlighted TE-signature genes (red) and MP-signature genes (blue) (H), and GSEA (I) were used to assess the DEGs in each subset affected by loss of one or two copies of Arid1a. GSEA analysis in (I) directly compared DEGs between WT and Arid1acKO cells and previously published datasets: Activated vs Naive: GSE10739; d2.5TbetKO: PRJNA547650; Batf3OE vs EV: GSE143504; Runx3KO: GSE81888; d8BRD4KO: GSE173515). ns, not significant; *p<0.05, **p<0.005, ***p<0.0005.
Fig 4.
Fig 4.. ARID1A-dependent OCRs in d8 MP, EEC, and TE cells are largely shared across subsets.
WT, Arid1acKO and Arid1acHet effector cells were isolated at d8 p.i. and sorted based on expression of TE, EEC and MP markers as defined in Figure 3A and differential OCRs were compared by ATAC-sequencing (2-fold change, adjusted p value<0.05, Benjamini-Hochberg). (A) Principal component analysis plot of ATAC-seq from WT, Arid1acHet, and Arid1acKO subsets at d8 post-infection. (B) Number of OCRs lost and gained in Arid1acKO and Arid1acHet subsets relative to WT cells. (C-D) ATAC-seq signal heatmaps of WT, Arid1acHet, and Arid1acKO d8 subsets. OCRs are clustered by whether they are lost in the Arid1acKO relative to WT cells in individual subsets or lost in all three subsets (C) and UpSet plot shows the number of shared and subset-specific OCRs lost in Arid1acKO subsets relative to WT cells (D). (E) Gene expression and paired chromatin accessibility of annotated OCRs in Arid1acKO and WT d8 subsets. TE- and MP-signature genes are highlighted in blue and red, respectively. (F) H3K27ac CUT&RUN signal coverage centered on ARID1A-dependent ATAC-seq peaks in WT vs. Arid1acKO cells TE, EEC, and MP cells.
Fig 5.
Fig 5.. cBAF is required for targeting of T-bet to enhancers in effector CD8+ T cells.
(A-B) As described in Figure 4, OCRs (2-fold change, adjusted p value<0.05, Benjamini-Hochberg) lost in Arid1acKO d5 effector cells or d8 TE, EEC, and MP subsets relative to WT cells were analyzed for enrichment of predicted TF motifs (A) or TF binding signals (observed/expected) of indicated TFs from public ChIP-seq datasets (GSE192390) in ARID1A-dependent (green) and - independent (gray) OCRs (B). (C) Genomic annotations and CUT&RUN signal heatmaps of ARID1A, BATF, ETS1, and T-bet at ARID1A-dependent or -independent OCRs from WT and Arid1acKO effector P14 CD8+ T cells d5 post-infection. (D-F) CD8+ T cells were activated in vitro for 48hrs and then treated with DMSO (black, red), ACBI1 (green) or BRM014 (purple) for 4 hours, and then treated with IL-12 (red, green, purple) for 2 hours, and analyzed for changes in ATAC-seq and T-bet binding by ChIP-seq. Signal coverage heatmaps of ATAC-seq and T-bet ChIP-seq (D) and histograms measuring chromatin accessibility (E) are shown. (F) Genomic annotations of ACBI1-dependent and -independent ATAC-seq OCRs. (G) Overlap of OCRs lost relative to WT (2-fold change, adjusted p value<0.05, Benjamini-Hochberg) in Arid1acKO or Tbx21 KO TE and MP cells. (H) ARID1A CUT&RUN signal heatmap in WT or Tbx21 KO effector cells at d5 p.i. Signal is centered on ARID1A- or Tbet-dependent OCR peaks identified in (G). (I) Retroviral overexpression of T-bet fails to rescue TE formation in Arid1acKO cells at d8 p.i. (J) T-bet CUT&RUN signal coverage histograms at Activation and Late Activation OCRs in WT or Arid1acKO cells transduced with either empty vector (EV) or T-bet overexpression (Tbet-OE) retrovirus at d5 p.i.*p<0.05, **p<0.005, ***p<0.0005.
Fig 6.
Fig 6.. ARID1A is critical for Trm formation.
(A) PageRank and mRNA expression analysis of Arid1acKO and WT MP cells from d8 p.i. (B) Absolute numbers of WT (n=8) and Arid1acKO (n=8) P14 splenic memory cells at d30-d60 p.i. (C) Representative cytokine production in WT (n=4) and Arid1acKO (n=4) memory P14 cells in the spleen at d60 p.i. Mean frequency of IFNg+TNF+ (top) and IFNg+CCL3+ (bottom) populations are shown. (D) Frequency of KLRG1+CD127 or KLRG1+CX3CR1+ secondary effector cells 8d p.i. following LM-GP33 infection in mice that previously received CD127+ WT and Arid1acKO LCMV memory P14 cells. (E) TCF1 staining in WT and Arid1acKO CD127hi spleen memory cells at d50 p.i. (F) Absolute numbers of WT and Arid1acKO P14 cells in the liver (n=7) and SI-IEL (n=7) at d50-d60 p.i. (G) Representative flow cytometry plots of WT and Arid1acKO P14 SI-IELs at d60 p.i. Mean frequency of CD69+CD103+ (top) and CD49a+CD103+ (bottom) populations are shown. Granzyme B (H) and TCF1 (I) staining in WT and Arid1acKO P14 SI-IELs at d60 p.i. Paired t-test; *p<0.05, **p<0.005, ***p<0.0005.

References

    1. Kaech SM, and Cui W (2012). Transcriptional control of effector and memory CD8+ T cell differentiation. Nat. Rev. Immunol 12, 749–761. 10.1038/nri3307. - DOI - PMC - PubMed
    1. Gerlach C, Moseman EA, Loughhead SM, Alvarez D, Zwijnenburg AJ, Waanders L, Garg R, de la Torre JC, and von Andrian UH (2016). The Chemokine Receptor CX3CR1 Defines Three Antigen-Experienced CD8 T Cell Subsets with Distinct Roles in Immune Surveillance and Homeostasis. Immunity 45, 1270–1284. 10.1016/j.immuni.2016.10.018. - DOI - PMC - PubMed
    1. Kaech SM, Tan JT, Wherry EJ, Konieczny BT, Surh CD, and Ahmed R (2003). Selective expression of the interleukin 7 receptor identifies effector CD8 T cells that give rise to long-lived memory cells. Nat. Immunol 4, 1191–1198. 10.1038/ni1009. - DOI - PubMed
    1. Cui W, Joshi NS, Jiang A, and Kaech SM (2009). Effects of Signal 3 during CD8 T cell priming: Bystander production of IL-12 enhances effector T cell expansion but promotes terminal differentiation. Vaccine 27, 2177–2187. 10.1016/j.vaccine.2009.01.088. - DOI - PMC - PubMed
    1. Herndler-Brandstetter D, Ishigame H, Shinnakasu R, Plajer V, Stecher C, Zhao J, Lietzenmayer M, Kroehling L, Takumi A, Kometani K, et al. (2018). KLRG1+ Effector CD8+ T Cells Lose KLRG1, Differentiate into All Memory T Cell Lineages, and Convey Enhanced Protective Immunity. Immunity 48, 716–729.e8. 10.1016/j.immuni.2018.03.015. - DOI - PMC - PubMed

Publication types