. 2023 Aug 2;111(15):2383-2398.e7.
doi: 10.1016/j.neuron.2023.05.006. Epub 2023 Jun 13.

An astrocyte BMAL1-BAG3 axis protects against alpha-synuclein and tau pathology

Affiliations

An astrocyte BMAL1-BAG3 axis protects against alpha-synuclein and tau pathology

Patrick W Sheehan et al. Neuron. .

Abstract

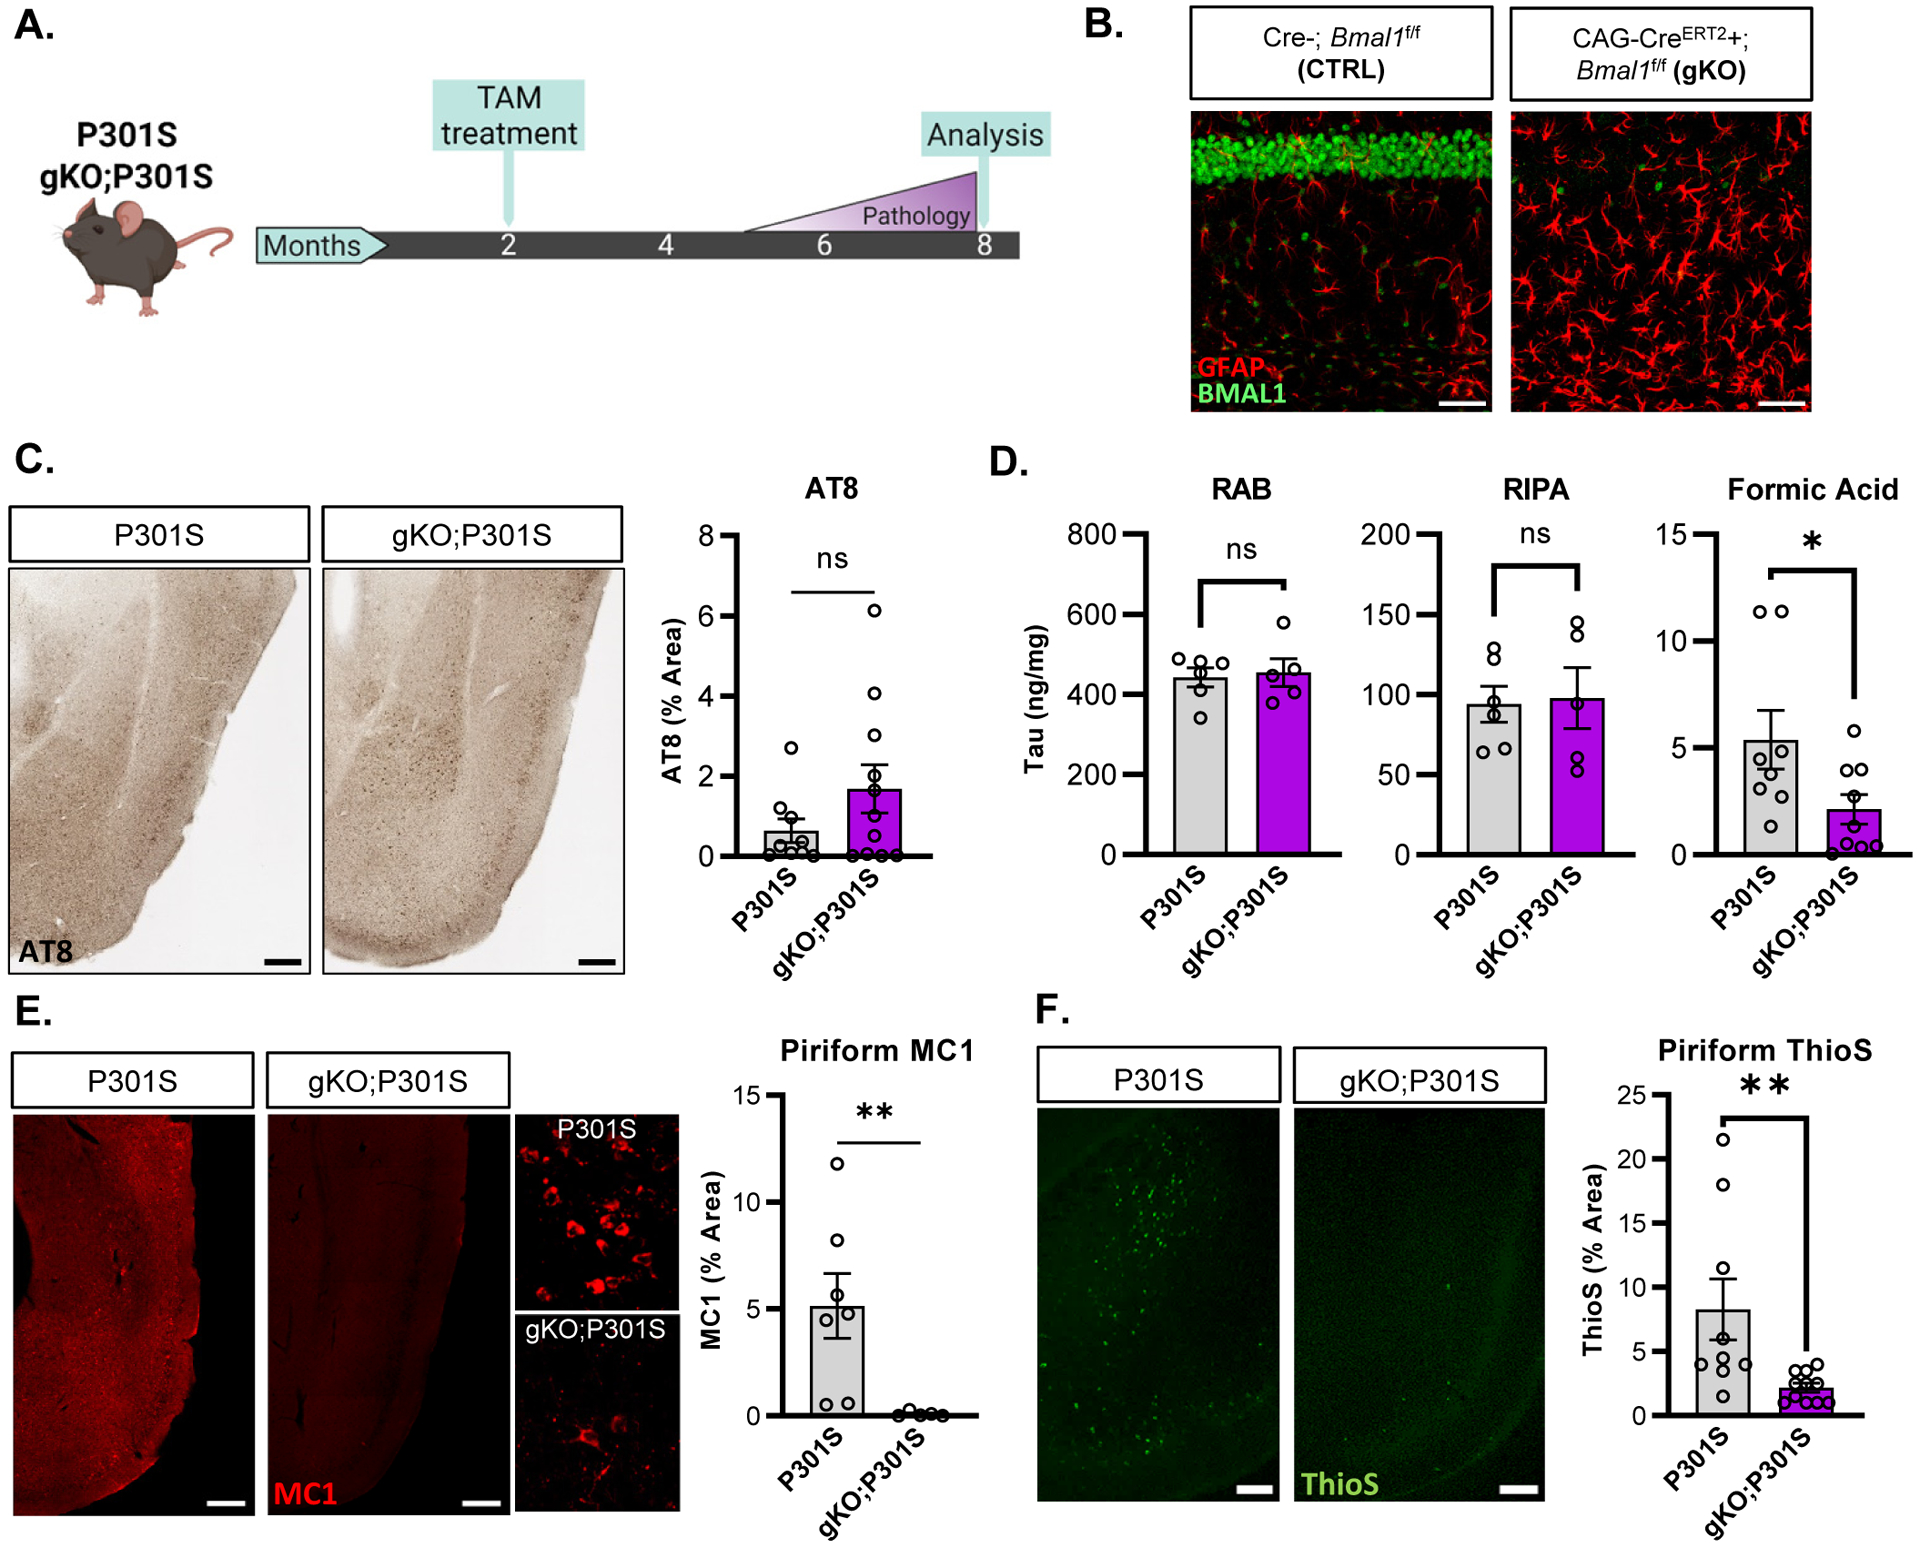
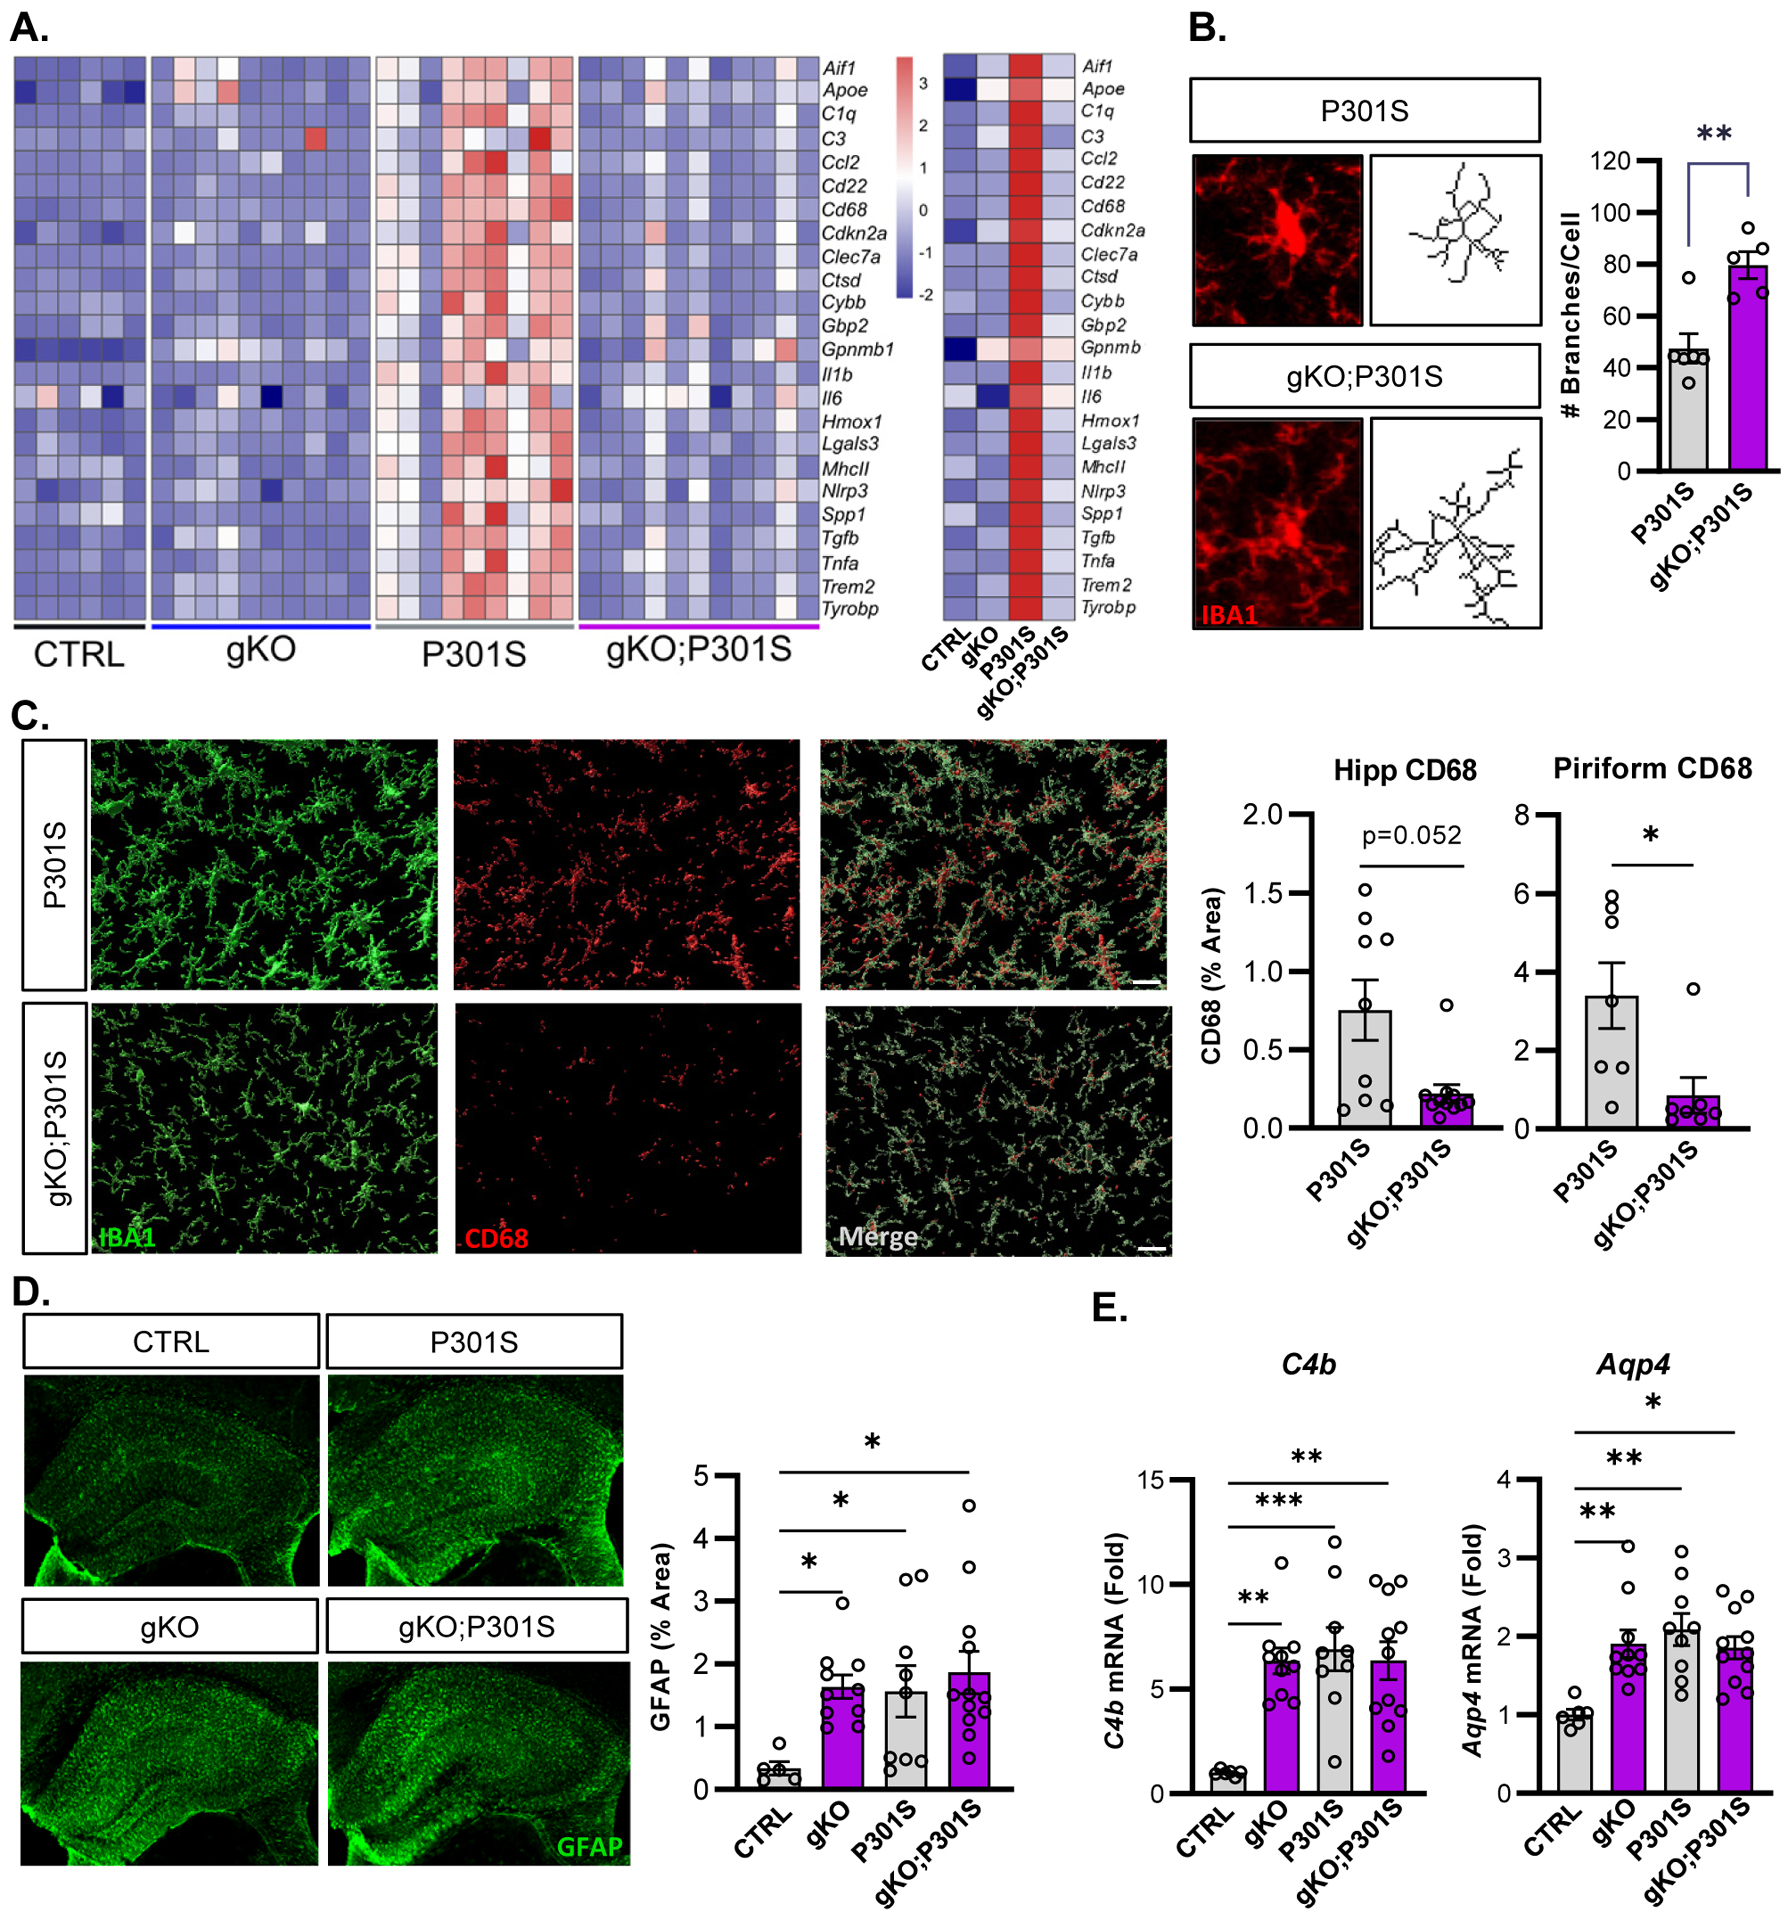
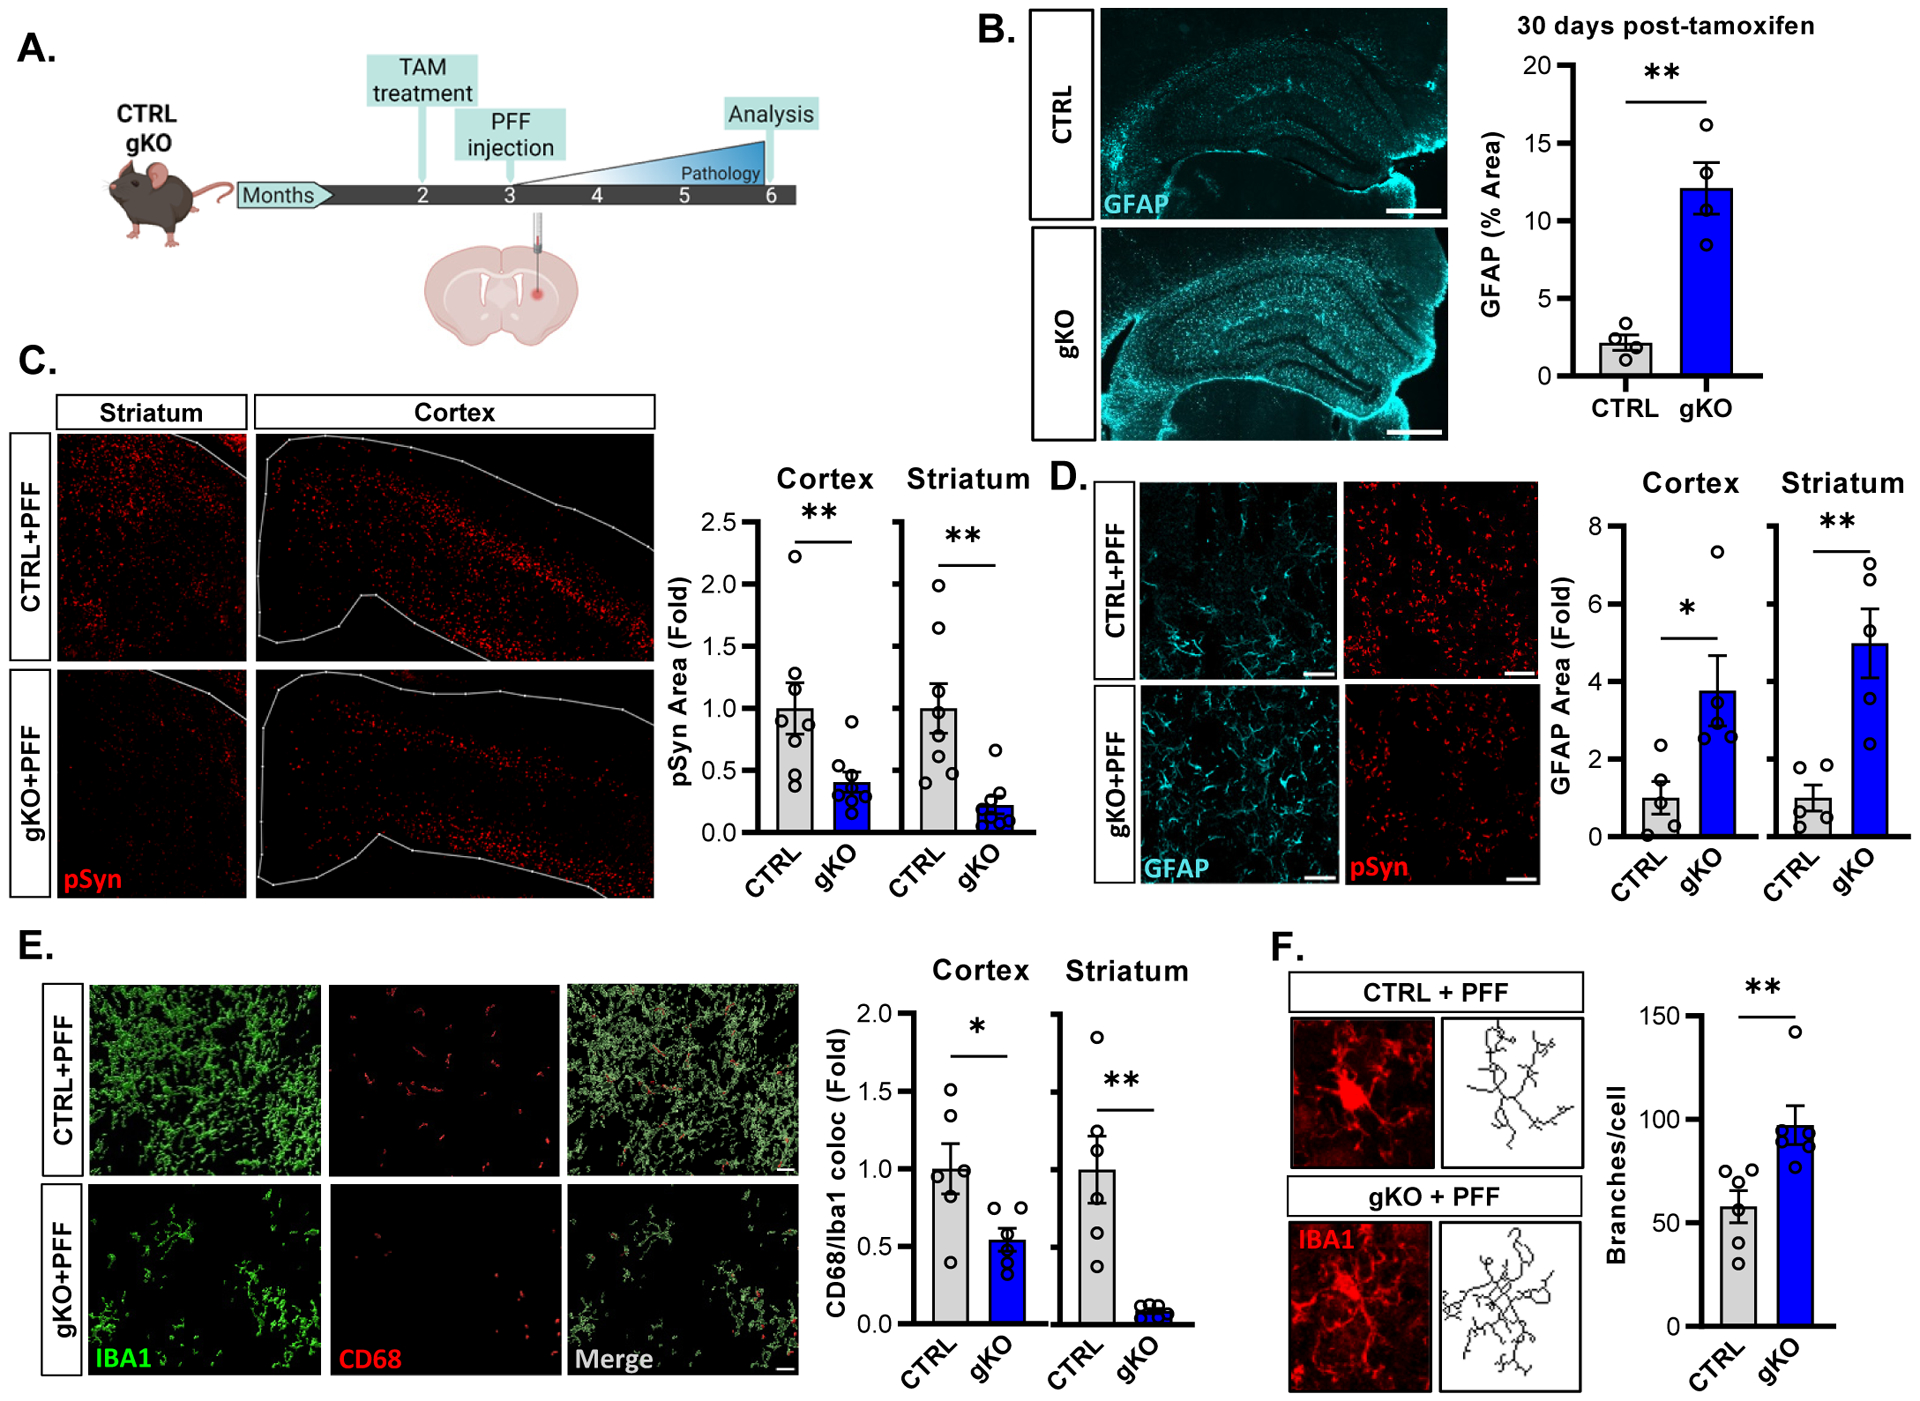
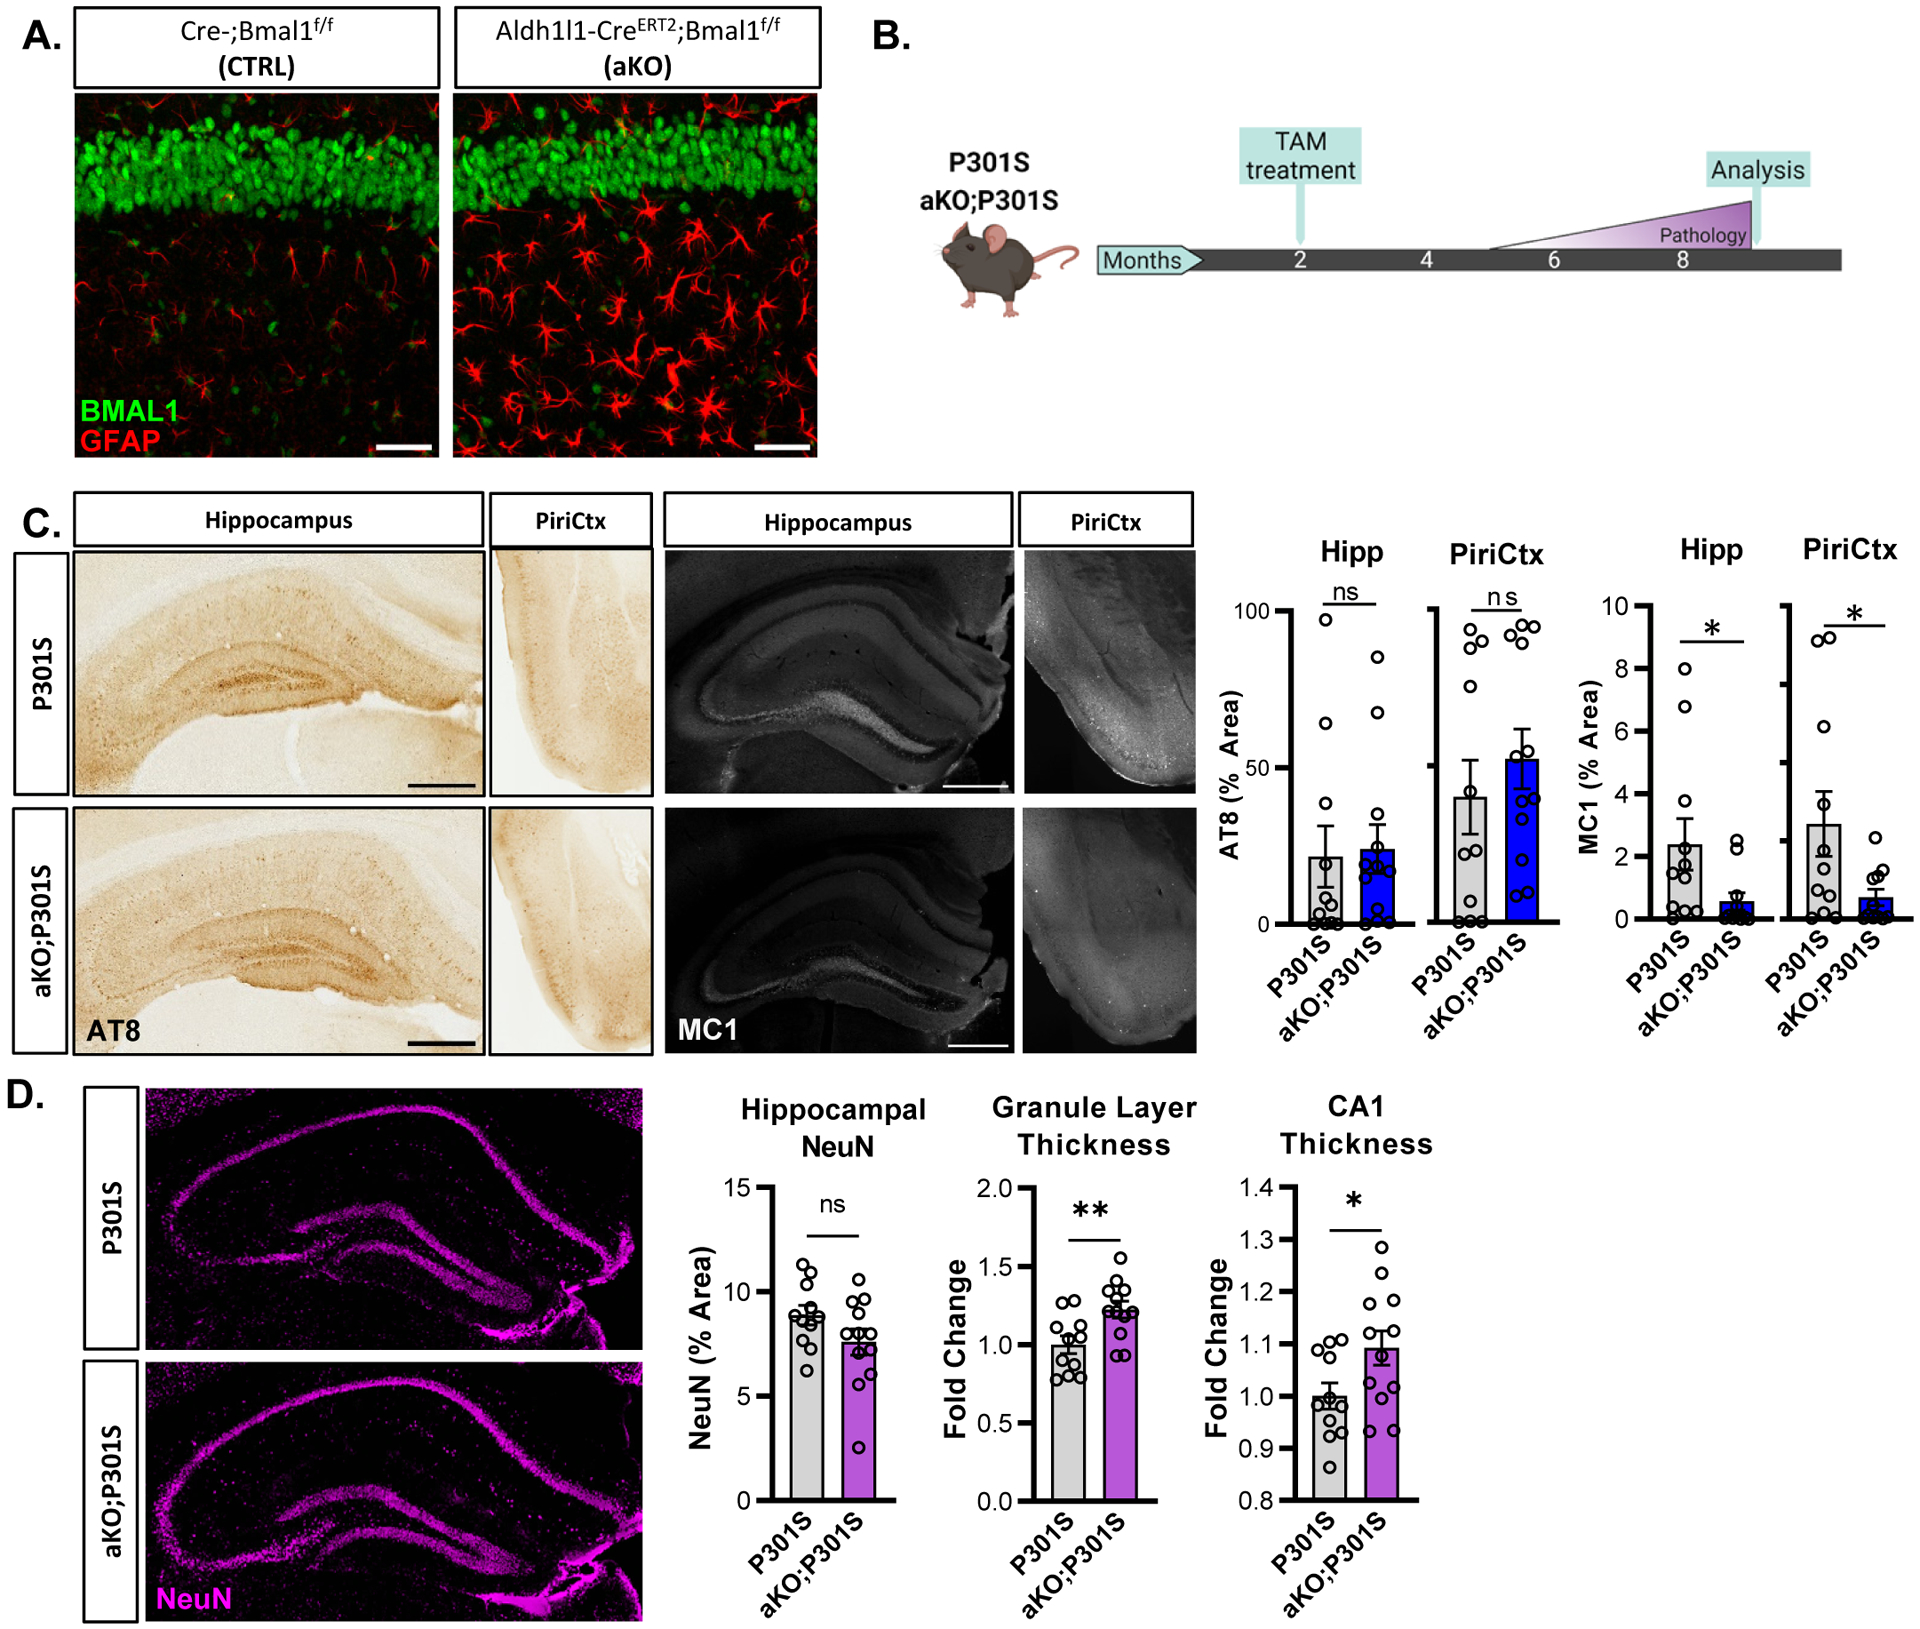
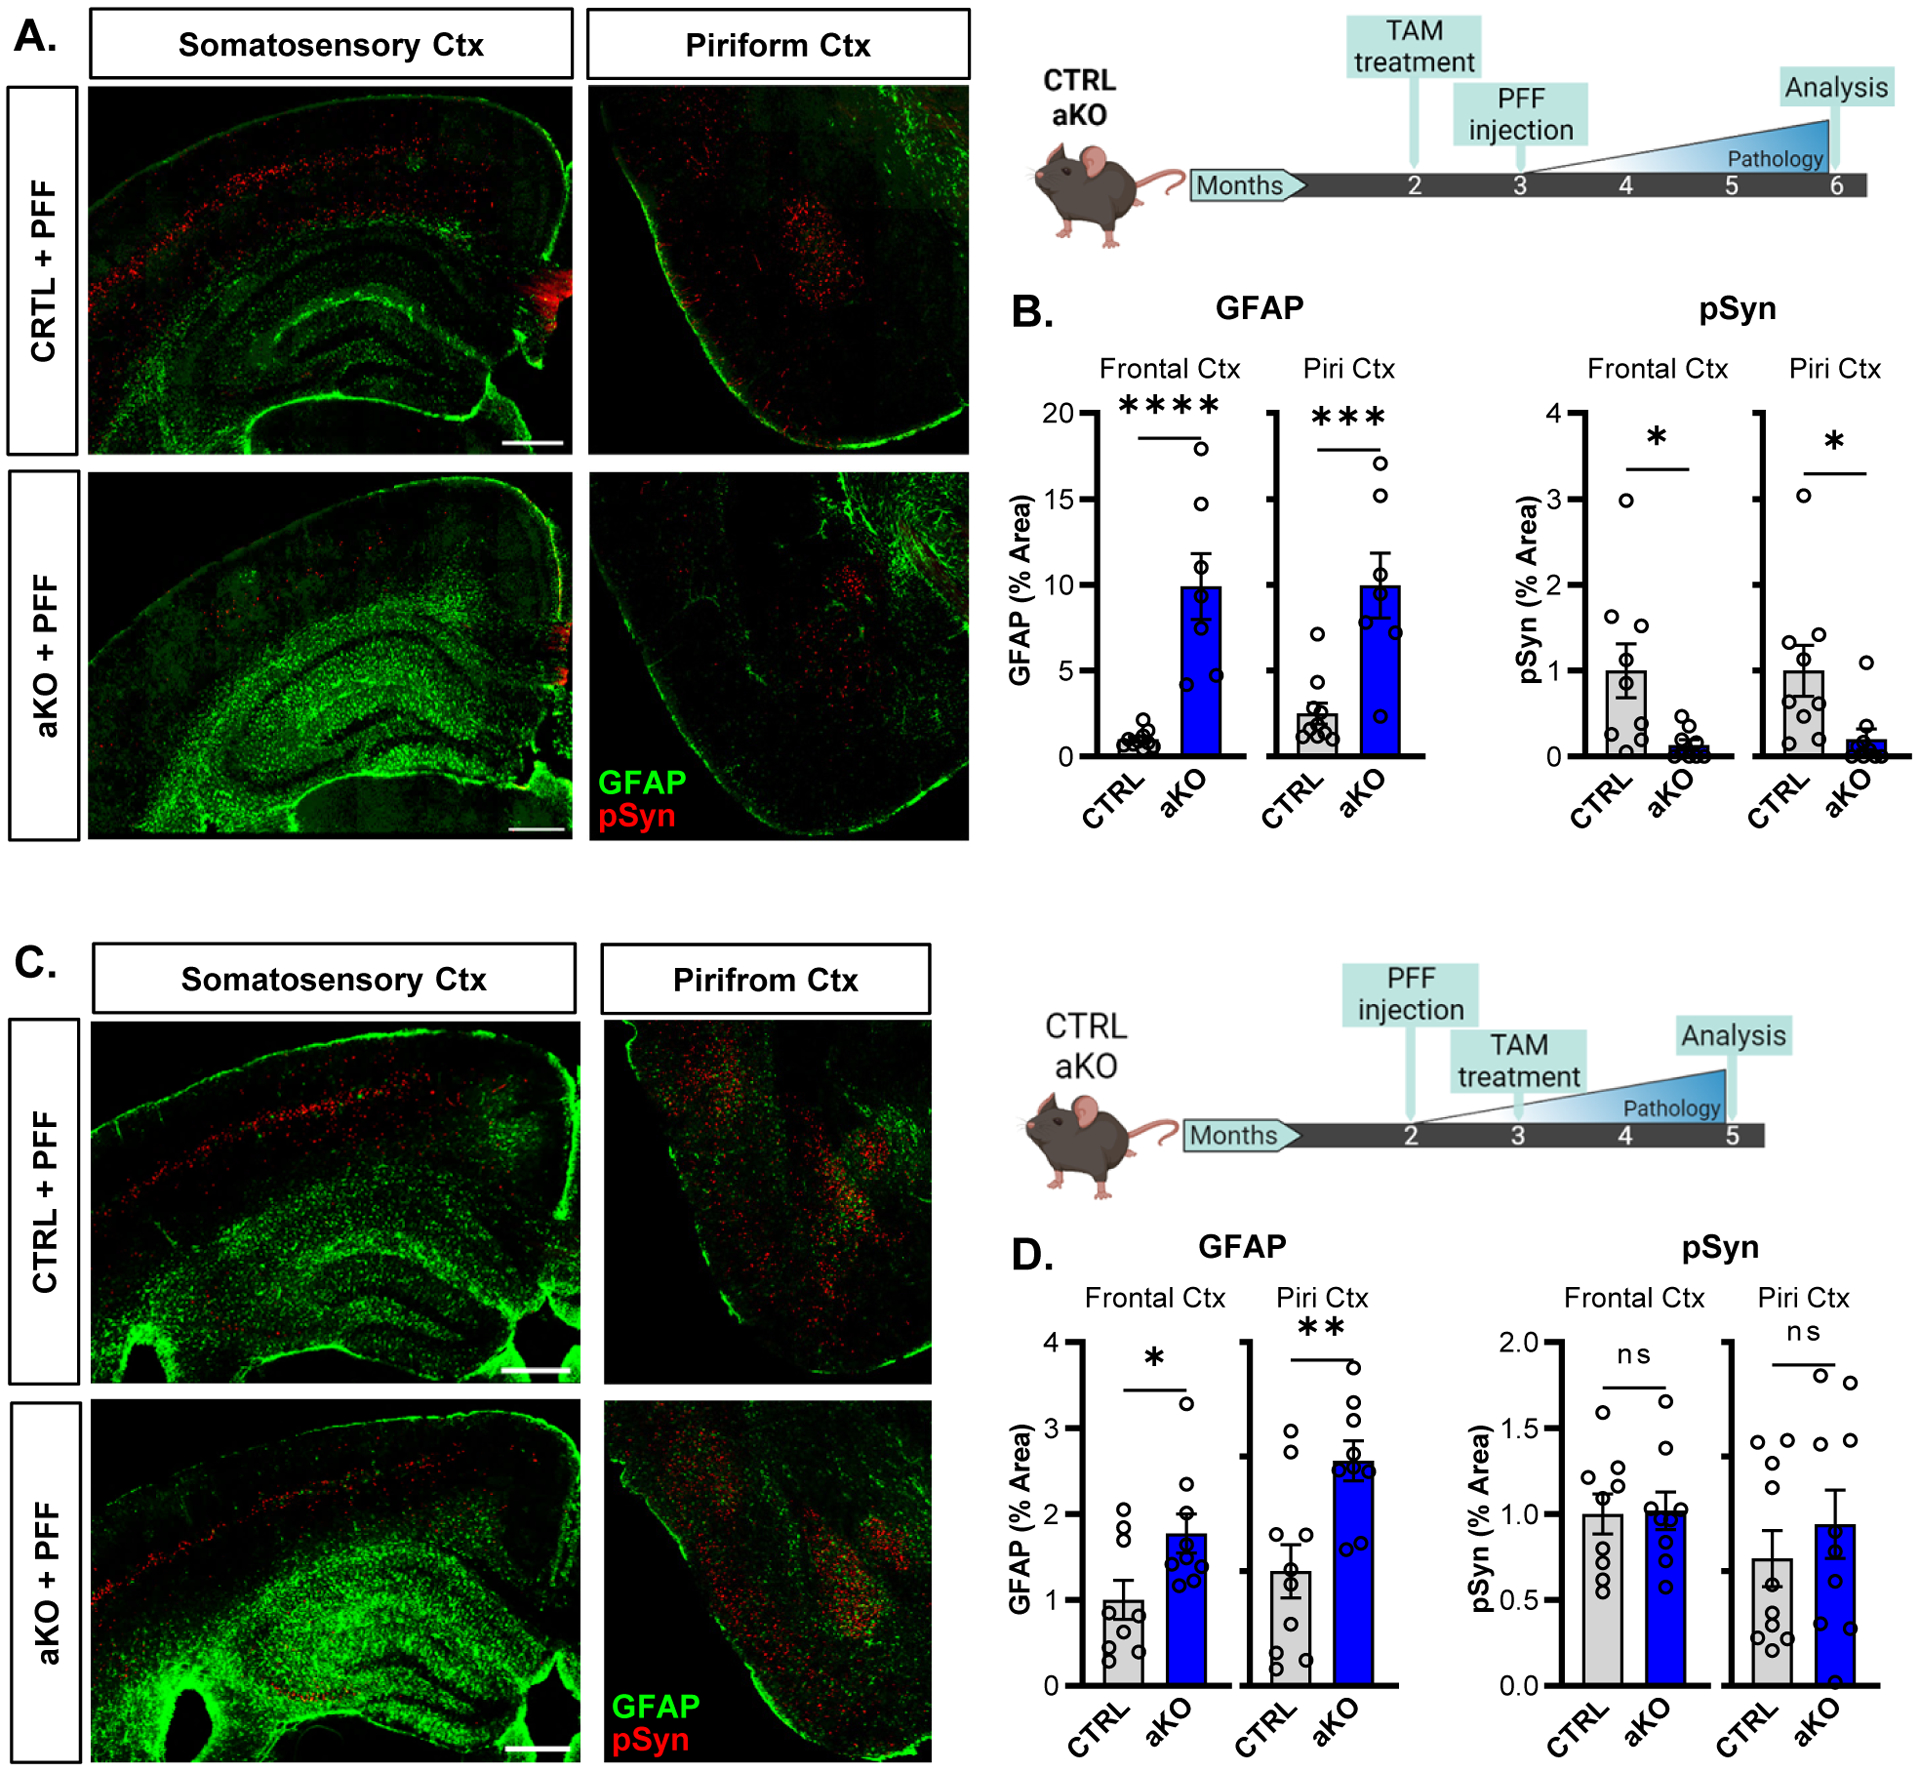
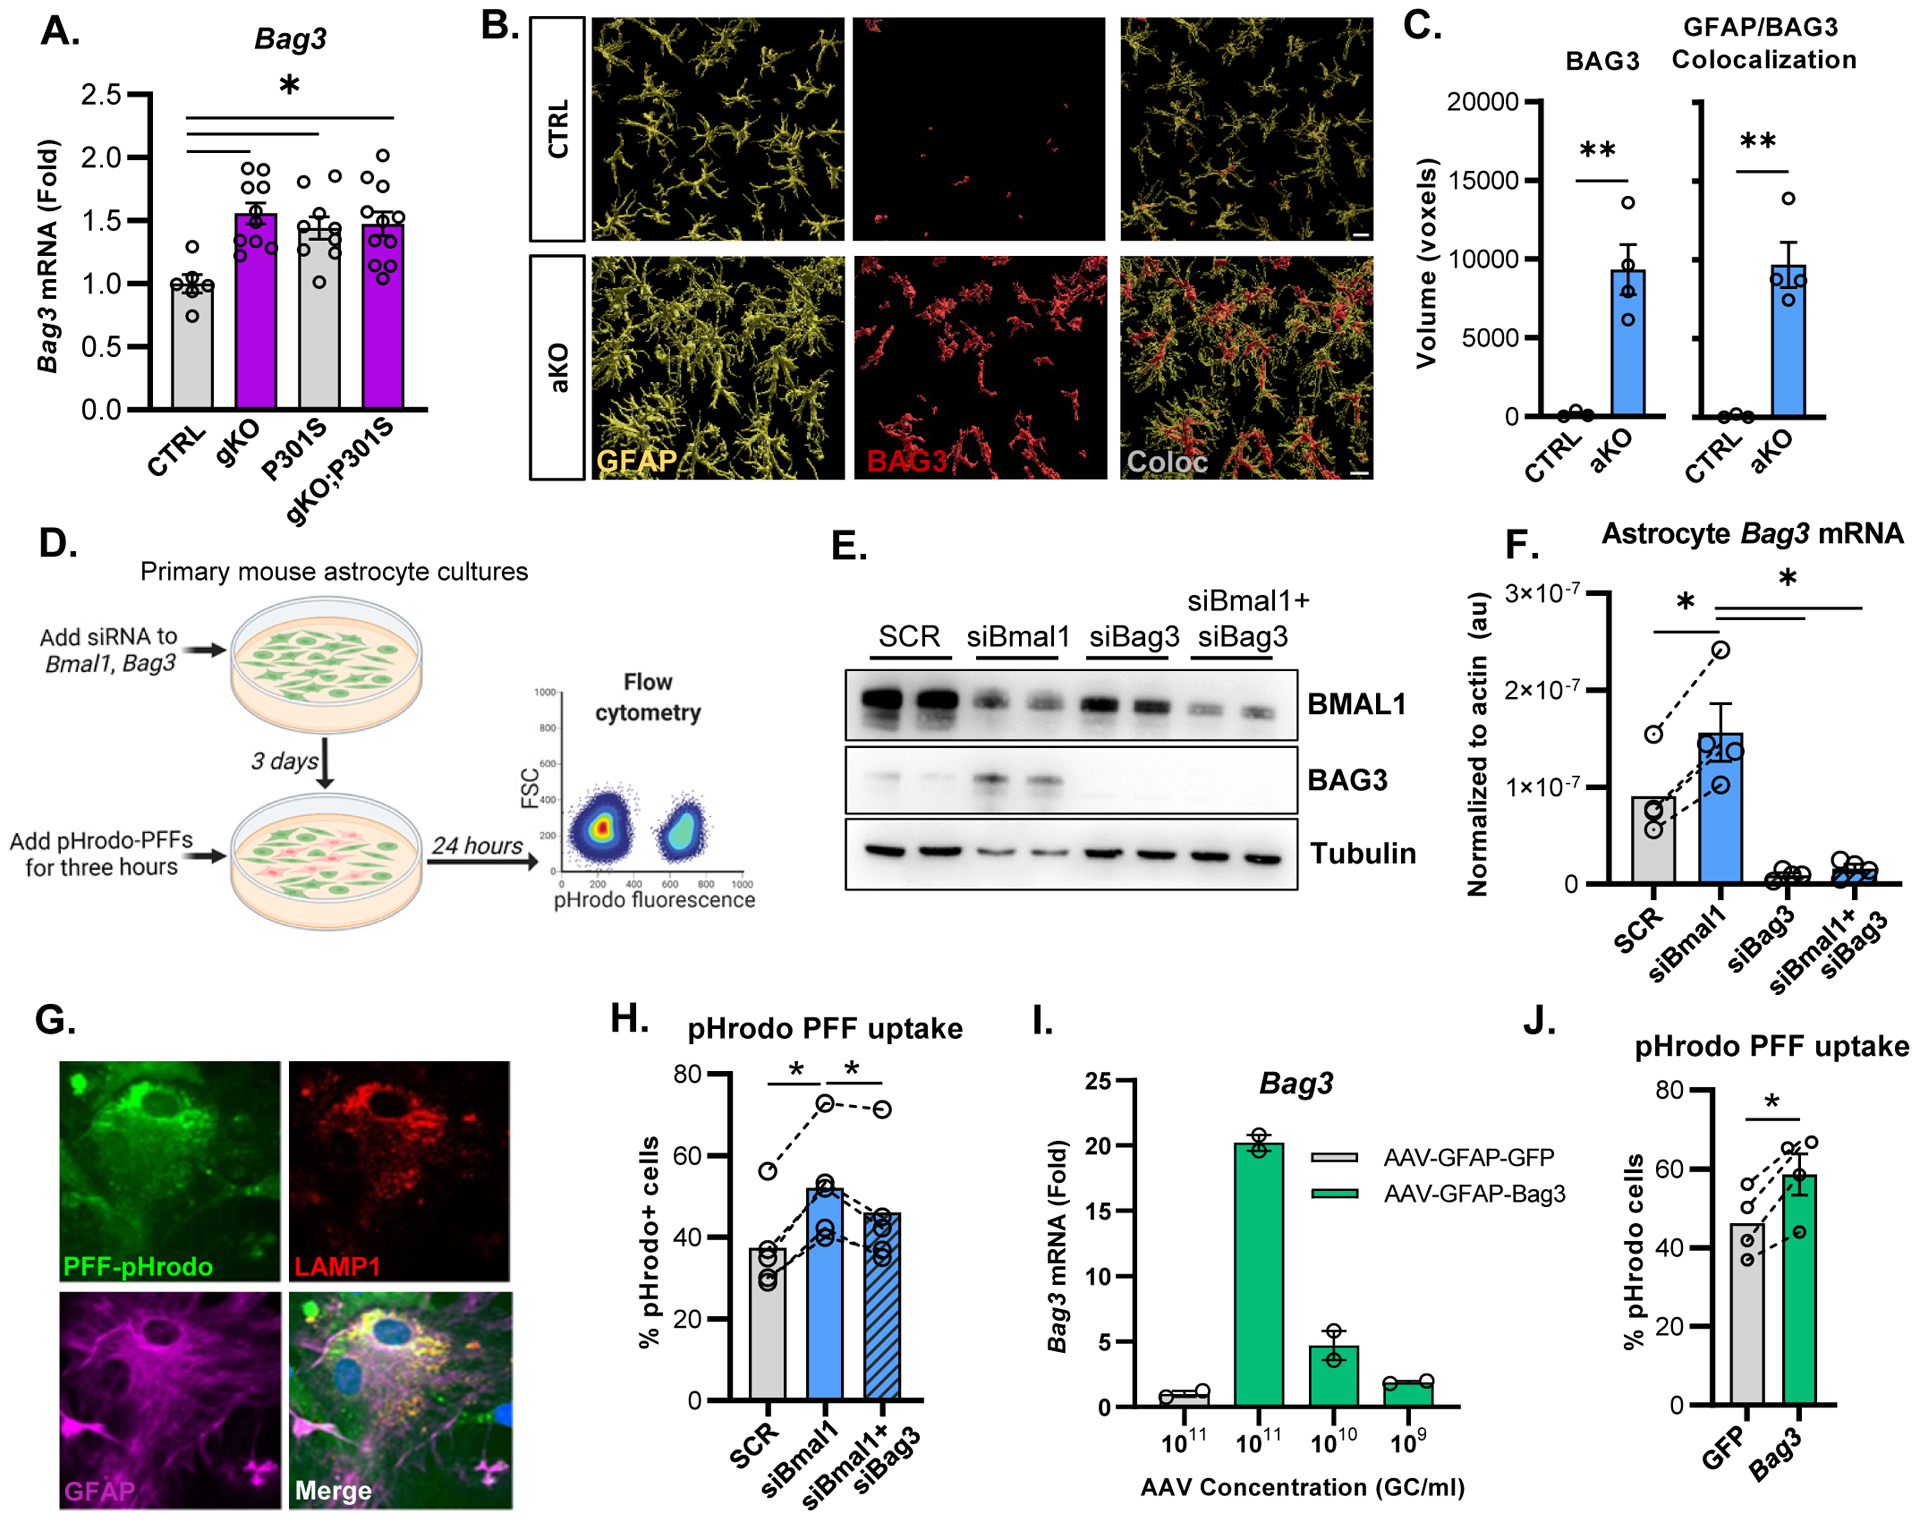
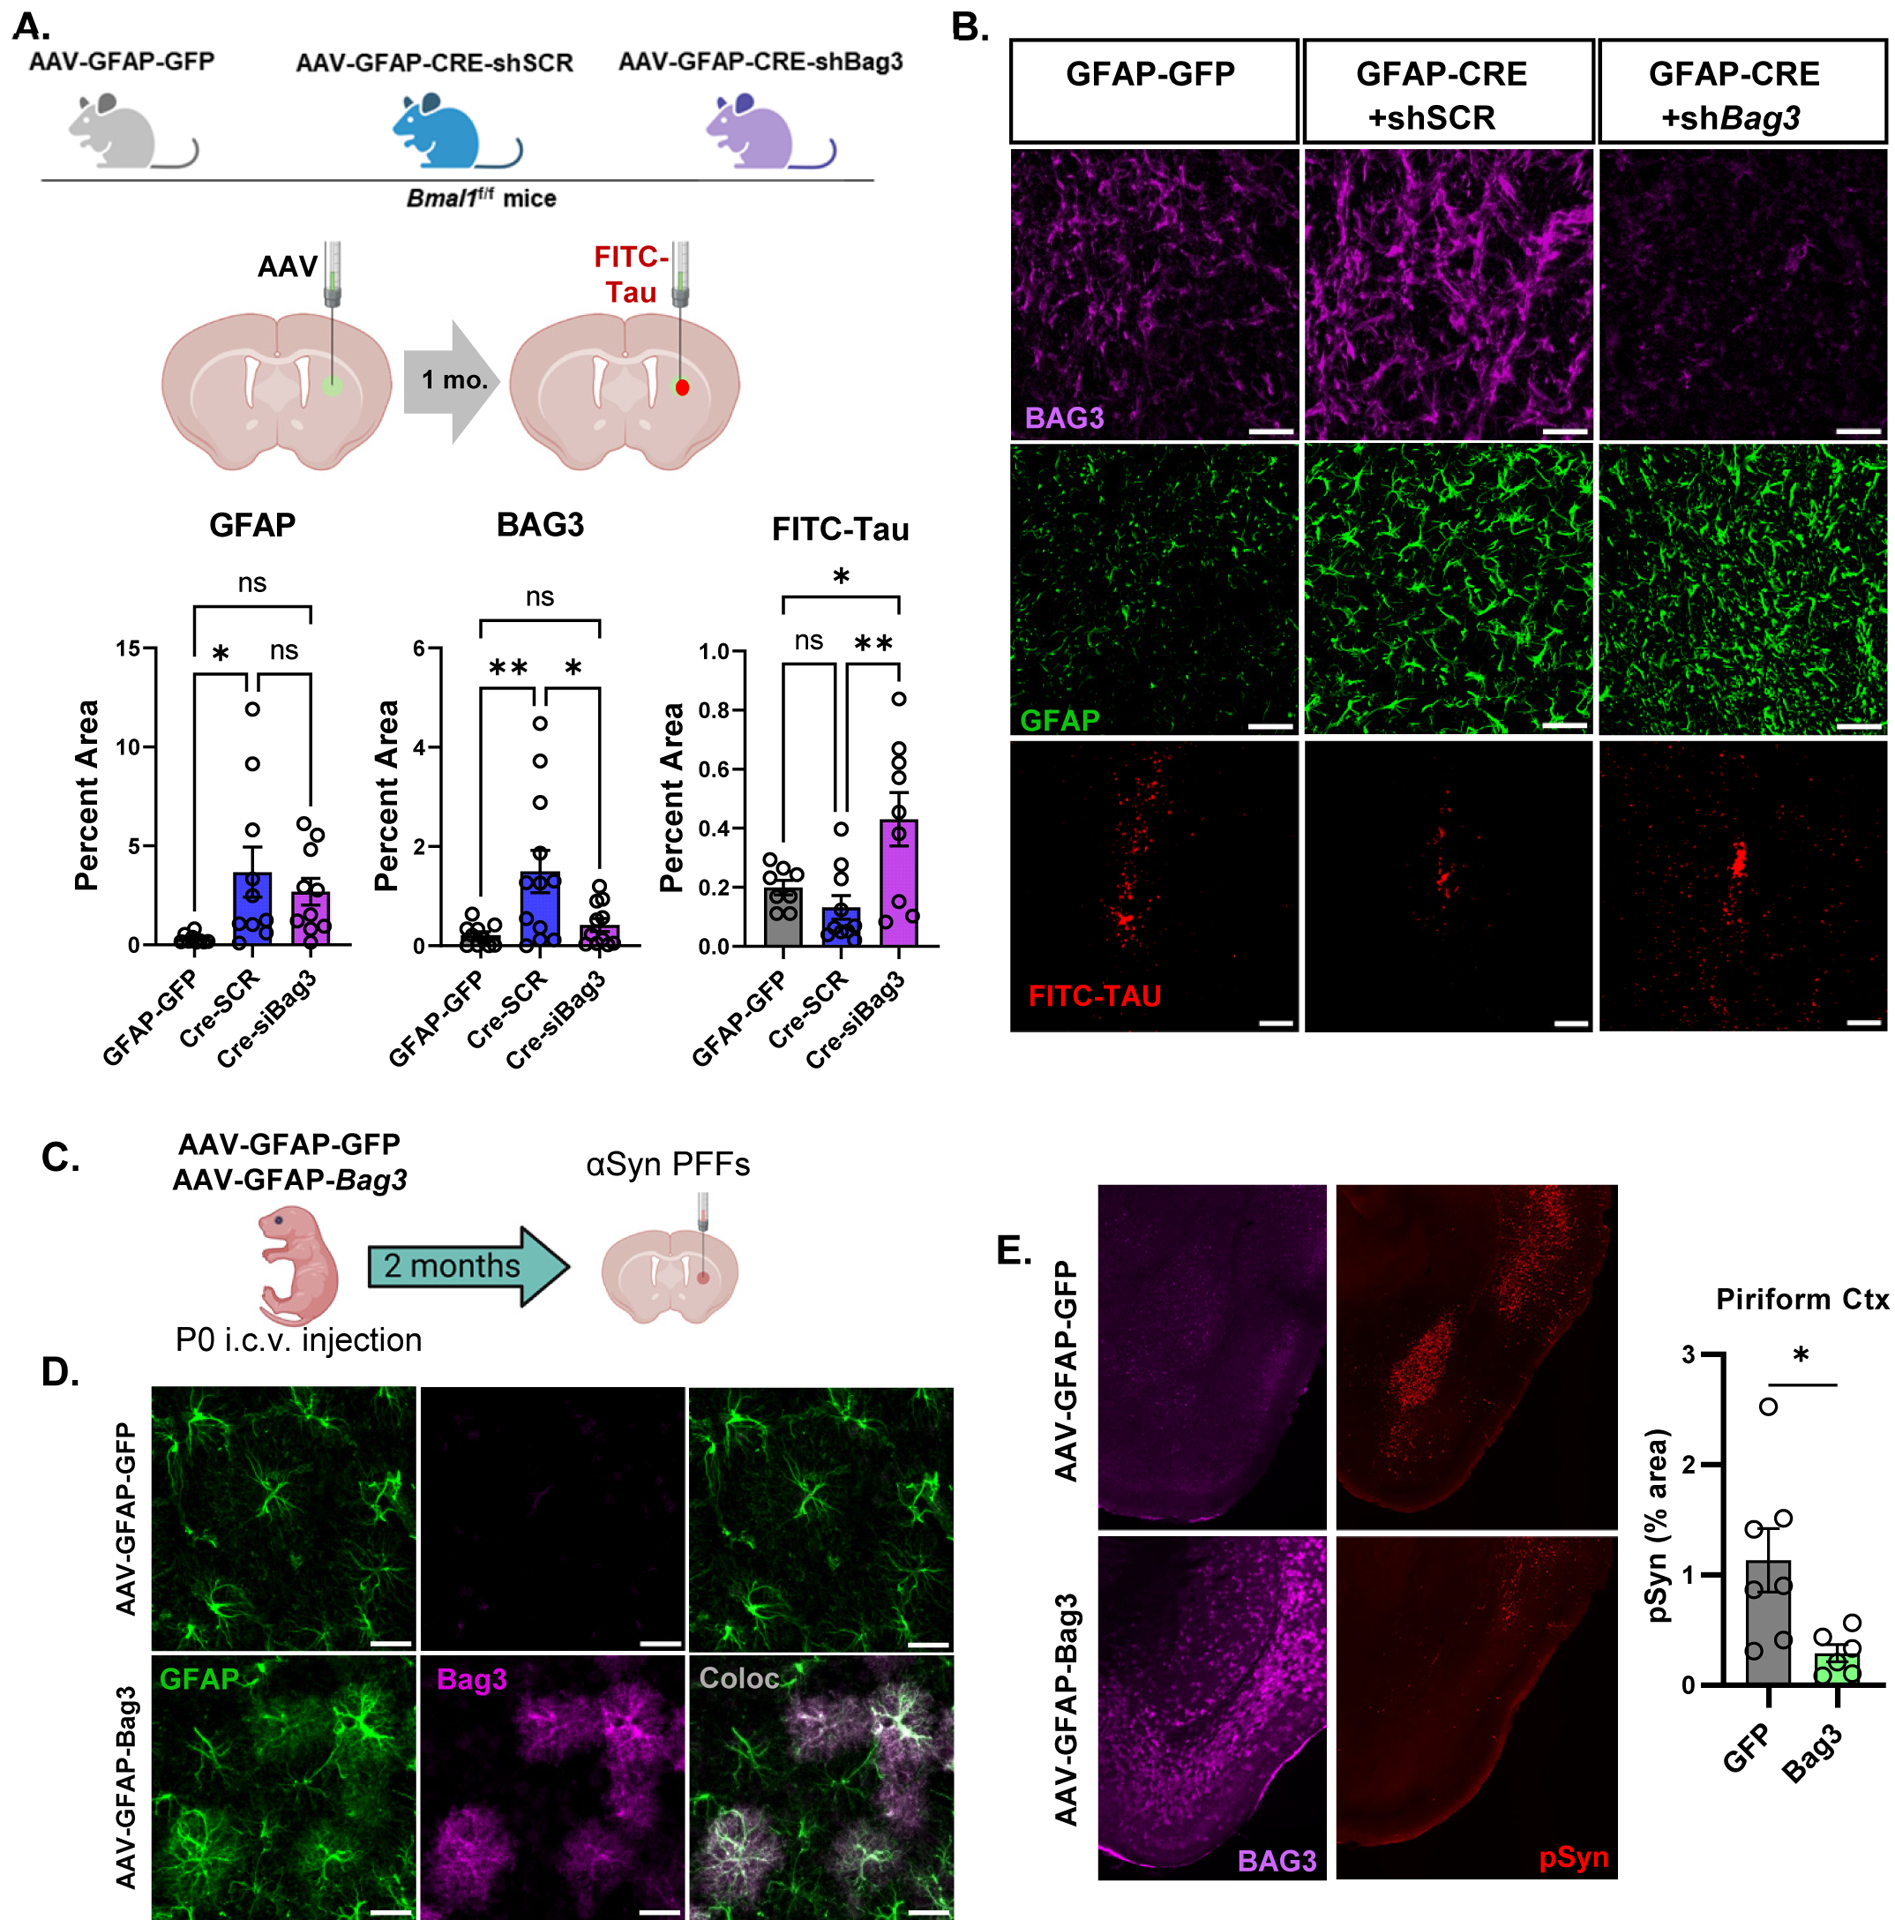
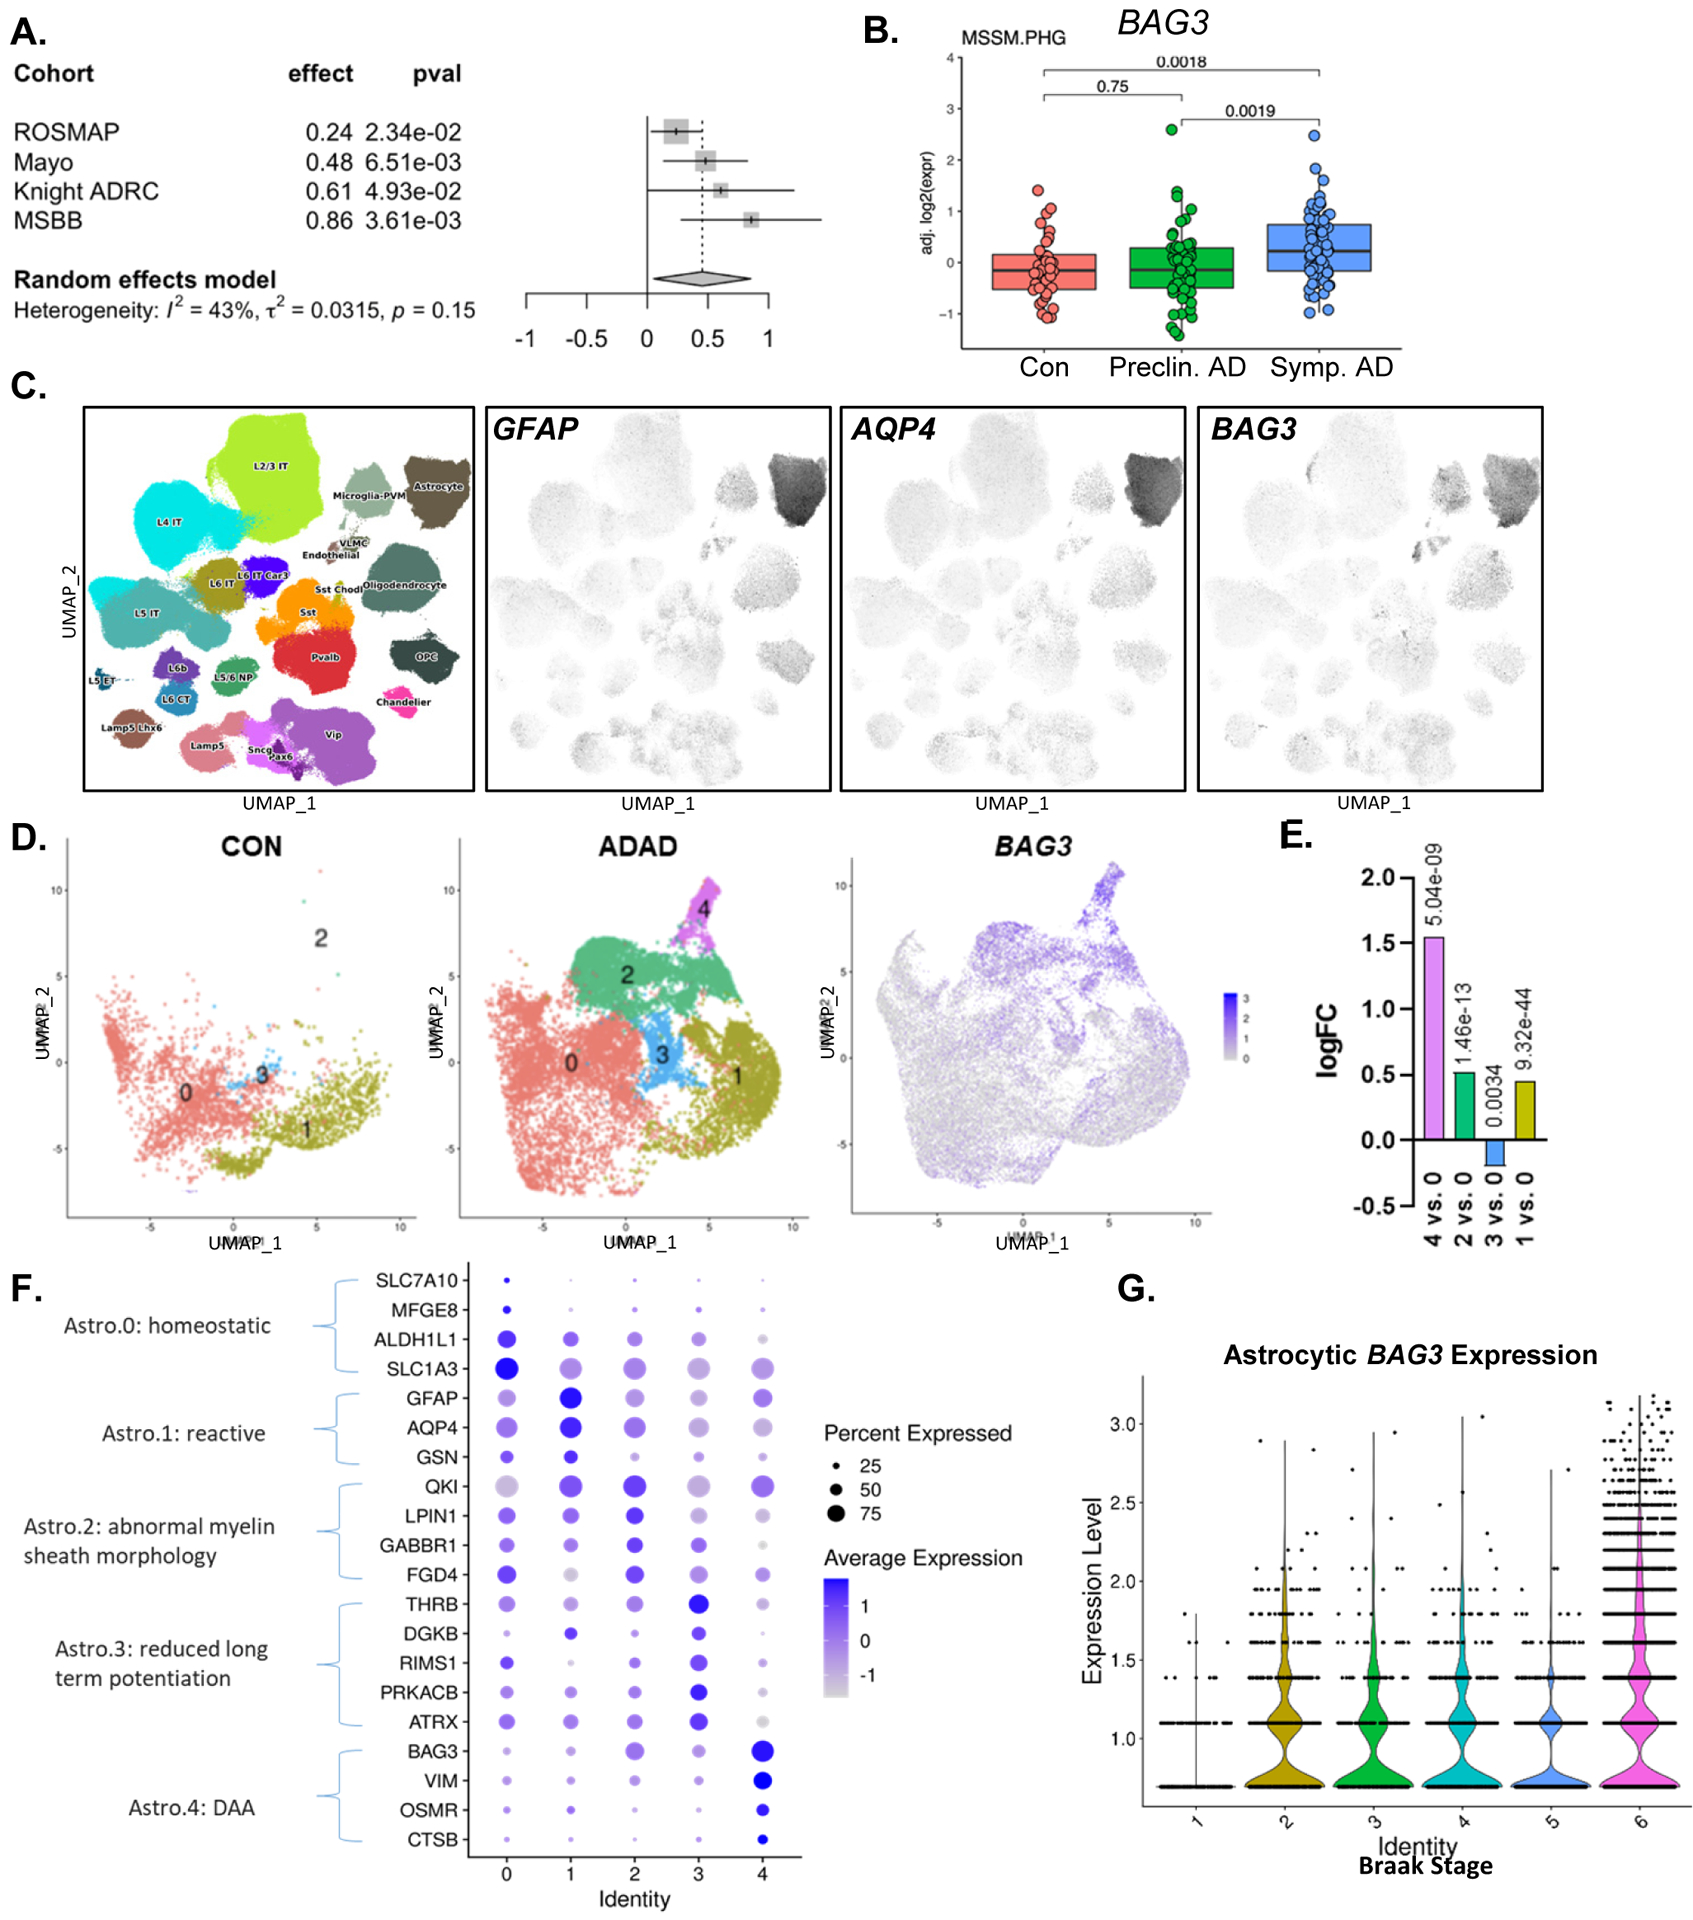
The circadian clock protein BMAL1 modulates glial activation and amyloid-beta deposition in mice. However, the effects of BMAL1 on other aspects of neurodegenerative pathology are unknown. Here, we show that global post-natal deletion of Bmal1 in mouse tauopathy or alpha-synucleinopathy models unexpectedly suppresses both tau and alpha-synuclein (αSyn) aggregation and related pathology. Astrocyte-specific Bmal1 deletion is sufficient to prevent both αSyn and tau pathology in vivo and induces astrocyte activation and the expression of Bag3, a chaperone critical for macroautophagy. Astrocyte Bmal1 deletion enhances phagocytosis of αSyn and tau in a Bag3-dependent manner, and astrocyte Bag3 overexpression is sufficient to mitigate αSyn spreading in vivo. In humans, BAG3 is increased in patients with AD and is highly expressed in disease-associated astrocytes (DAAs). Our results suggest that early activation of astrocytes via Bmal1 deletion induces Bag3 to protect against tau and αSyn pathologies, providing new insights into astrocyte-specific therapies for neurodegeneration.

Keywords: Alzheimer disease; BAG3; BMAL1; Parkinson’s disease; alpha-synuclein; astrocytes; circadian; neuroinflammation; tau.


Conflict of interest statement

Declaration of interests The authors declare no competing interests.

Figures

Figure 1:
Figure 1:. Global Bmal1 deletion mitigates tau pathology.
(A) Representative images of hippocampal CA1 from CTRL (Cre-) and gKO (CAG-CreERT2+) mice stained for GFAP (red) and BMAL1 (green). (B) Schematic of the experimental paradigm used for global Bmal1 deletion in P301S mice. (C) Representative images and quantification of AT8 staining in piriform cortex region of P301S and gKO;P301S mice. N = 8–11 mice per group. (D) Quantification of fractionated tau between RAB (soluble tau), RIPA (slightly insoluble tau) and 70% formic acid (insoluble/aggregated tau) cortical fractions. N = 6–9 mice per group. (E) Representative images of MC1 immunoreactivity with quantification in the piriform cortex of P301S (left) and gKO;P301S mice (right). N = 6–7 mice per group. Inset shows higher magnification view. (E) Thioflavin-S staining/quantification of piriform cortex in P301S and gKO;P301S mice. All graphs in all Figures show mean±SEM unless otherwise noted. N = 9–11 mice per group. *p<0.05 or **p<0.01 by unpaired 2-tailed T-test (C,D) or Mann-Whitney test (E, F). Scale bars= 50μm (A), 200μm (C,E,F) or 20μm (E-inset).
Figure 2:
Figure 2:. Global Bmal1 deletion in P301S mice induces chronic astrogliosis and prevents microglial activation.
(A) Transcriptional analysis of inflammatory transcripts related to microglial activation in bulk cortex tissue from all four mouse genotypes. N = 6–11 mice per genotype. Averages for each genotype shown on right. (B) Representative Iba1 images and skeletonized microglia from hippocampus and quantification of branching. N = 5–6 mice per genotype with 6–9 microglia quantified per mouse. (C) Representative confocal images and quantification of CD68 immunoreactivity in the hippocampus and piriform cortex of P301S (top) and gKO;P301S mice (bottom). N = 9–11 mice per group. (D) Representative images of hippocampal GFAP immunoreactivity and quantification. (E) qPCR analysis of astrogliosis-related transcripts C4b and Aqp4 across genotypes. N=5–12 mice per group. *p<0.05, **p<0.01, ***p<0.005 by 2-tailed T-test (B), Mann-Whitney U test (C) or one-way ANOVA (D,E). Scale bars = 10μm (B), 20μm (C), or 500μm (D).
Figure 3:
Figure 3:. Global Bmal1 deletion suppresses α-synuclein pathology and prevents microglia activation.
(A) Schematic of the experimental paradigm showing intra-striatal injection of α-Syn PFFs one month post-tamoxifen administration. (B) Representative images and quantification of astrogliosis one month after tamoxifen administration in CTRL (top) and gKO (bottom) mice. N=4 mice per group. (C) Representative images and quantification of phosphorylated αSyn (pSyn) pathology in CTRL and gKO mice at 6mo., N = 8 mice per group. (D) Representative images and quantification of pSyn (red) and GFAP (cyan) immunoreactivity in mice from C. N = 5 mice per group. (E) 3D reconstruction of confocal images of IBA1 (green) and CD68 (red) staining, with quantification of Iba1/CD68 colocalization, in mice from C. N = 6 mice per group. (F) Representative microglial Iba1 images and branching analysis with quantification in cortex from mice from C. N = 6 mice per group, n = 4–7 microglia per mouse. *p<0.05, **p<0.01 by 2-tailed T-test (B,D,E-ctx,F) or Mann-Whitney U test (C,E-str). Scale bars = 500μm (B), 200μm (C-str) or 500μm (C-ctx), 50μm (D), 20μm (E), or 10μm (F).
Figure 4:
Figure 4:. Astrocyte-specific Bmal1 deletion is sufficient to induce astrogliosis and prevent tau pathology in P301S mice.
(A) Representative images of GFAP (red) and BMAL1 (green) from WT and aKO mice, CA1 region, 4 months after tamoxifen. (B) Experimental paradigm used in the tauopathy model with P301S and aKO;P301S mice. (C) Representative images and quantification of AT8 and MC1 in P301S and aKO;P301S mouse hippocampus and piriform cortex. N = 11–12 mice per group, 9 months old. (D) Hippocampal NeuN staining in P301S and aKO;P301S mice from C. with quantification of total % area and thickness of dentate gyrus granule and CA1 neuronal cell layers. *p<0.05, **p<0.01, by 2-tailed T-test (C-AT8, D) or Mann-Whitney U test (C-MC1). Scale bars = 500μm.
Figure 5:
Figure 5:. Astrocyte-specific Bmal1 deletion prior to, but not after, α-synuclein PFF injection is sufficient to prevent spreading.
(A,B) Representative images (A) and quantification (B) of pSyn pathology (red) and astrogliosis (GFAP, green) in WT and aKO mice in the frontal cortex and piriform cortex at 6mo. Mice were treated with tamoxifen 1 month prior to PFF injection, as shown in experimental diagram to the right. (C,D) Representative images (A) and quantification (B) of pSyn pathology (red) and astrogliosis (GFAP, green) in WT and aKO mice in the frontal cortex and piriform cortex at 6mo. Mice were treated with tamoxifen 1 month after PFF injection, as shown in experimental diagram to the right. N= 7–9 mice per group for all experiments. *p<0.05, **p<0.01, ***p<0.001, ****p<0.0005 by Mann-Whitney U test (B) or 2-tailed T-test (D). Scale bars = 500μm.
Figure 6:
Figure 6:. Astrocytic BAG3 modulates α-synuclein uptake downstream of Bmal1.
(A) qPCR analysis of Bag3 in cortex of mice from Figure 2. (B) Representative confocal images of GFAP and BAG3 immunofluorescence in aKO mice. Scale bar = 10μm (C) Quantification of BAG3 immunofluorescence and co-localization of GFAP with BAG3 in aKO mice, using Imaris reconstruction. N = 3–4 mice per group. (D) Schematic representation of the experimental paradigm used for analyzing uptake of pHrodo-labeled αSyn PFFs. (E) Representative Western blot showing BMAL1 and BAG3 protein after siRNA treatment in astrocyte cultures. (F) qPCR analysis of Bmal1 and Bag3 mRNA after siRNA knockdown in primary astrocytes. (G) Representative images of primary astrocytes with phrodo-labeled PFFs and co-stained with LAMP1 and GFAP. Scale bar = 10μm (H) Flow cytometry analysis of the percent of phrodo-labeled PFF+ astrocytes after a 24 hour incubation. N = 5 independent experiments (I) qPCR analysis of AAV-mediated Bag3 overexpression in primary astrocytes using a serial dilution of virus concentrations. N = 2 independent experiments. (J) pHrodo-PFF uptake in primary astrocyte culture after AAV-mediated Bag3 overexpression. N=4 independent experiments. For F, H, and J, each circle represents the average from one independent experiment, with dotted lines connecting datapoints from that experiment. *p<0.05, **p<0.01, ***p<0.005 by 2-tailed T-test (C,J), one-way ANOVA (A,H), or repeated measures one-way ANOVA (F, H, J).
Figure 7:
Figure 7:. Astrocytic BAG3 reduces tau and αSyn pathology in vivo.
(A) Diagram depicting sequential striatal injection of viral vectors into 2 month old mice, followed by FITC-tau fibril injection 1 month later. (B) Representative images and quantification of BAG3, GFAP, and FITC-tau immunofluorescence in ipsilateral striatum 6 days after FITC-tau injection. P values in B are from one-way ANOVA with Tukey’s multiple comparisons test, and are listed if <0.1. Main effect was significant with p=0.014 (BAG3) and p=0.006 (Tau). Scale bar = 100μm (C) Diagram depicting P0 i.c.v. injection of control (AAV-GFAP-GFP) or astrocyte Bag3 overexpression vectors, followed by striatal αSyn PFF injection at 2mo, and harvest at 5 mo. (D) Images and quantification of BAG3 expression in astrocytes from (C). Scale bar = 50μm. (E) Images and quantification of BAG3 and pSyn immunofluorescence in piriform cortex of mice from (C). Scale bar = 500μm. In (C) and (D), 8p<0.05 by 2-tailed t-test.
Figure 8:
Figure 8:. BAG3 is expressed in disease-associated astrocytes in human AD.
(A) BAG3 mRNA expression in post-mortem brain tissue from human AD patients from multiple longitudinal studies of AD. (B) BAG3 mRNA is increase in post-mortem parahippocampal gyrus samples from patients with symptomatic AD vs. healthy controls, but not in preclinical AD. Data from Mt. Sinai Brain Bank. (C) BAG3 is expressed primarily in human astrocytes in snRNAseq control and AD patients in the Seattle AD Brain Cell Atlas. GFAP and AQP4 are shown to define the astrocyte cluster. (D) UMAP plots showing the astrocyte subclusters from control and autosomal dominant AD (ADAD) patients from the Knight ADRC. BAG3 expression is shown on the right. (E) Dot plot showing expression levels of transcripts which define each astrocyte subcluster from (D). The subcluster number (Identity) is on the x-axis. (F) Differential expression of BAG3 between astrocyte subclusters from (D). The log fold change is shown on the y-axis, with each subcluster compared to Astro.0 (homeostatic) cluster. Benjamani-Hochberg-corrected p values are shown above each bar. G. Violin plot showing BAG3 expression in astrocytes based on Braak stage (1= no pathology, 6= severe tau pathology).

Comment in

References

    1. Arranz AM, and De Strooper B (2019). The role of astroglia in Alzheimer’s disease: pathophysiology and clinical implications. Lancet Neurol 18, 406–414. 10.1016/s1474-4422(18)30490-3. - DOI - PubMed
    1. Escartin C, Galea E, Lakatos A, O’Callaghan JP, Petzold GC, Serrano-Pozo A, Steinhauser C, Volterra A, Carmignoto G, Agarwal A, et al. (2021). Reactive astrocyte nomenclature, definitions, and future directions. Nat Neurosci 24, 312–325. 10.1038/s41593-020-00783-4. - DOI - PMC - PubMed
    1. Musiek ES, Lim MM, Yang G, Bauer AQ, Qi L, Lee Y, Roh JH, Ortiz-Gonzalez X, Dearborn JT, Culver JP, et al. (2013). Circadian clock proteins regulate neuronal redox homeostasis and neurodegeneration. J Clin Invest 123, 5389–5400. 10.1172/JCI70317 - DOI - PMC - PubMed
    1. Lananna BV, Nadarajah CJ, Izumo M, Cedeno MR, Xiong DD, Dimitry J, Tso CF, McKee CA, Griffin P, Sheehan PW, et al. (2018). Cell-Autonomous Regulation of Astrocyte Activation by the Circadian Clock Protein BMAL1. Cell Rep 25, 1–9 e5. 10.1016/j.celrep.2018.09.015. - DOI - PMC - PubMed
    1. Bunger MK, Wilsbacher LD, Moran SM, Clendenin C, Radcliffe LA, Hogenesch JB, Simon MC, Takahashi JS, and Bradfield CA (2000). Mop3 is an essential component of the master circadian pacemaker in mammals. Cell 103, 1009–1017. - PMC - PubMed

Publication types

LinkOut - more resources