. 2023 Jul 12;31(7):1185-1199.e10.
doi: 10.1016/j.chom.2023.05.018. Epub 2023 Jun 13.

SINE RNA of the imprinted miRNA clusters mediates constitutive type III interferon expression and antiviral protection in hemochorial placentas

Affiliations

SINE RNA of the imprinted miRNA clusters mediates constitutive type III interferon expression and antiviral protection in hemochorial placentas

Ishani Wickramage et al. Cell Host Microbe. .

Erratum in

Abstract

Hemochorial placentas have evolved defense mechanisms to prevent the vertical transmission of viruses to the immunologically underdeveloped fetus. Unlike somatic cells that require pathogen-associated molecular patterns to stimulate interferon production, placental trophoblasts constitutively produce type III interferons (IFNL) through an unknown mechanism. We demonstrate that transcripts of short interspersed nuclear elements (SINEs) embedded in miRNA clusters within the placenta trigger a viral mimicry response that induces IFNL and confers antiviral protection. Alu SINEs within primate-specific chromosome 19 (C19MC) and B1 SINEs within rodent-specific microRNA cluster on chromosome 2 (C2MC) produce dsRNAs that activate RIG-I-like receptors (RLRs) and downstream IFNL production. Homozygous C2MC knockout mouse trophoblast stem (mTS) cells and placentas lose intrinsic IFN expression and antiviral protection, whereas B1 RNA overexpression restores C2MCΔ/Δ mTS cell viral resistance. Our results uncover a convergently evolved mechanism whereby SINE RNAs drive antiviral resistance in hemochorial placentas, placing SINEs as integral players in innate immunity.

Keywords: C19MC; C2MC; antiviral immunity; convergent evolution; placenta; retrotransposons; vertical transmission.


Conflict of interest statement

Declaration of interests H.T.-J. is listed as inventor on patent application related to this project.

Figures
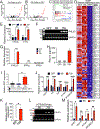
Figure 1.
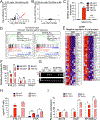
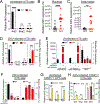
Figure 1.. Transcriptional activation of C19MC induces a strong type III IFN response.
(A-D) AD-293 cells transfected with 759-SAM (759), 620-SAM (620) or GFP for 72 hours. Differential expression analysis of major strand mature miRNAs (>±10-fold, adjusted p<0.05) with C19MC miRNA marked in red and other miRNA in blue (A, B), hallmark GSEA plot of IFNa response (C), heat map representing gene ontology biological process of defense response to virus (D). (E-J) AD-293 cells transfected with BB-SAM (BB), 759, or GFP for 72 hours. RT-qPCR for representative C19MC miRNAs normalized to U18 (E), representative agarose gels of IFNL2/3 and GAPDH RT-PCR (F), RT-qPCR for IFNL2/3, IFNA2 and IFNB1 normalized to GAPDH (G), ELISA-based quantification of IFNL1/3 in the supernatant (H), representative immunoblot and densitometric quantification of IRF7 normalized to GAPDH (I) and RT-qPCR of representative ISGs normalized to GAPDH (J) (One-way ANOVA with Dunnett’s multiple comparison test). (K-M) HTR8/SVneo cells transfected with 759 or BB for 72 hours. Representative RT-qPCR for miR-517a normalized to U18 (K), agarose gels of IFNL2/3 and GAPDH RT-PCR (L) and RT-qPCR of representative ISGs normalized to GAPDH (M) (Unpaired two-tailed t-test with Welch’s correction). Data represent the mean ± SEM of a representative experiment performed in triplicate performed in at least three independent experiments (A-J). *p<0.05, **p<0.01, ***p<0.001 and ****p<0.0001, versus BB. ns, not significant and ND, not detected. See also Figure S1, S2, Tables S1 and S2.
Figure 2.
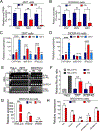
Figure 2.. Activation of C19MC preferentially induces IFNL in a miRNA independent fashion.
(A-I) 293T and DICER-Ko (Ko) cells transfected with 759-SAM (759) or BB-SAM (BB) for 72 hours. Differential expression analysis of mature miRNAs (>±10-fold, adjusted p<0.05) with C19MC miRNA marked in red and other miRNA in blue (A, B), RT-qPCR for miR-517a normalized to U18 (C), hallmark GSEA plot of IFNa response (D), heat map representing gene ontology biological process of negative regulation of viral process (E), RT-qPCR for IFNL2/3, IFNA2 and IFNB1 normalized to GAPDH (F), representative agarose gels of IFNL2/3 and GAPDH RT-PCR (G), ELISA-based quantification of IFNL1/3 and IFNA (H) and RT-qPCR of representative ISGs normalized to GAPDH (I) (Unpaired two-tailed t-test with Welch’s correction). Data represent the mean ± SEM of at least three independent experiments each performed in triplicate (C, F, G and I), or at least two independent experiments performed in triplicate (H). *p<0.05 and **p<0.01 versus BB. ns, not significant and ND, not detected. See also Figure S3, Tables S1 and S3.
Figure 3.
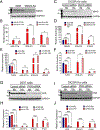
Figure 3.. C19MC activation increase Alu dsRNA and protects against viral infection in a miRNA independent fashion.
(A, B) RT-qPCR for the indicated viral RNA normalized to GAPDH in 293T (A) and DICER-Ko cells (B) transfected with 759-SAM (759) or BB-SAM (BB) for 60 – 72 hours and infected with either VSV for 8 hours or with ZIKV or RSV for 24 hours (Unpaired two-tailed t-test). (C, D) RT-qPCR for CYP19A1 and IFNL2/3 normalized to GAPDH and miR-519 normalized to U18 in 293T (C) and DICER-Ko (D) cells transfected with 125.3-SAM (125.3), 759 or BB for 72 hours. (One-way ANOVA with Dunnett’s multiple comparison test). (E, F) Representative agarose gels of Alu and GAPDH RT-PCR with control Alu PCR products using total RNA (bottom panel) (E) and densitometric quantification of fl-Alu to sc-Alu ratio normalized to GAPDH (F) of 293T and DICER1-Ko cells transfected with 759 or BB for 72 hours and control HeLa cells after heat shock recovery (Unpaired two-tailed t-test). (G, H) RT-qPCR of indicated genes normalized to GAPDH of DROSHA-Ko 293T cells transfected with 759 or BB for 72 hours (Unpaired two-tailed t-test with Welch’s correction). Data represent the mean ± SEM of at least three independent experiments each performed in triplicate (E, F), two independent experiments performed in triplicate (C and G) or a representative experiment performed in triplicate (A, B, D and H). *p<0.05, **p<0.01, ***p<0.001 and ****p<0.0001 vs BB transfected cells. See also Figure S4, Tables S4 and S5.
Figure 4.
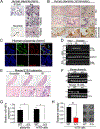
Figure 4.. C19MC Alu RNA induce IFN through RLR and PKR signaling pathways.
(A) Representative immunoblot for MAVS and GAPDH in 293T and MAVS-Ko cells. (B) RT-qPCR for miR-517a normalized to U18 and IFNL2/3 and IFNA2 normalized to GAPDH in 293T and MAVS-Ko 293T cells transfected with 759-SAM (759) or BB-SAM (BB) for 72 hours. (C, D) Representative immunoblot for MAVS and GAPDH (C) and RT-qPCR for MAVS, IFNL2/3 and IFNA2 normalized to GAPDH (D) in DICER-Ko cells transfected with MAVS-specific siRNA or control siRNA for 24 hours followed by 759 or BB transfection for 48 hours. (E, F) RT-qPCR for miR-517a normalized to U18 (E) and TLR3, IFNL2/3 and IFNA2 normalized to GAPDH (E, F) in 293T (E) and DICER-Ko (F) cells transfected with TLR3-specific siRNA or control siRNA for 24 hours followed by 759 or BB transfection for 48 hours. (G-J) Representative immunoblot for PKR and GAPDH (G, I), RT-qPCR for miR-517a normalized to U18 (H), and PKR, IFNL2/3 and IFNA2 normalized to GAPDH (H, J) in 293T (G, H) and DICER-Ko (I, J) cells transfected with PKR-specific siRNA or control siRNA for 24 hours followed by transfection with 759 or BB for 48 hours. Data represent the mean ± SEM of a representative experiment of three independent experiments performed in triplicate. One-way ANOVA with Tukey’s multiple comparison test. *p<0.05 and ***p<0.001 vs 759 transfected 293T cells (B). *p<0.05, **p<0.01 and ****p<0.0001 vs control-siRNA and 759 transfected cells (D-F, H and J). ns, not significant.
Figure 5.
Figure 5.. SINE RNA colocalize with C19MC and C2MC miRNAs in human and mouse placentas.
(A) Representative in situ hybridization images of miR-517a/b (purple), Alu (purple) or control scramble probes in term human placentas (n=3) pretreated with DNase I, RNase A or vehicle control. Nuclei were counterstained with nuclear fast red. Scale bars: 100μm; original magnification, x40 (A). (B) Representative in situ hybridization images of miR-517a/b, Alu or control scramble probes and immunostaining for cytokeratin-7 (brown) and vimentin (pink) in 1st trimester human placentas. Scale bars: 200μm; original magnification, x10 and insets x20 and x40. (C) Representative immunofluorescent staining of human term placental sections with dsRNA-specific J2, mitochondria marker HSP60 or control secondary antibody. Nuclei were counterstained with DAPI. Scale bars: 50μm; original magnification, 120x.

(D) Representative agarose gels of Alu and GAPDH RT-PCR and control Alu PCR products using total RNA (bottom panel) in term human placenta (PL), human adult cardiac left ventricle (LV) (n=4 each) and control HeLa cells after heat shock recovery. (E) Representative in situ hybridization images of miR-669a-3p (purple), B1 (purple) or control scramble probes in WT E18.5 mouse placentas. Nuclei were counterstained with nuclear fast red. Scale bars: 500 μm; original magnification, x3 and x20 (insets). (F) Representative agarose gels of B1 and Polra2 RT-PCR product of E11.5 mouse placentas (top) and mTS cells derived from WT and C2MCΔ/Δ (bottom). (G) RT-qPCR of miR-467a normalized to snoRNA202 of E11.5 mouse placentas and mTS cells derived from WT and C2MCΔ/Δ mice (Unpaired two-tailed t-test with Welch’s correction). (H) Representative dot-blot and densitometric quantification of dsRNA detected by J2 antibody in total RNA extracted from WT and C2MCΔ/Δ derived mTS cells (Unpaired two-tailed t-test). Data represent the mean ± SEM of a representative experiment of three placentas and three independent experiments performed in triplicate using a single clone of WT or C2MCΔ/Δ mTS cells (G) and in triplicate using a single clone of WT or C2MCΔ/Δ mTS cells (H). *p<0.05 and **p<0.01 vs WT. STB, syncytiotrophoblast; CTB, cytotrophoblast; EVT, extravillous trophoblasts; st, spongiotrophoblast; la, labyrinth; ma, maternal decidua. See also Table S5.
Figure 6.
Figure 6.. C2MC B1 RNA induce IFN and antiviral protection in mTS cells in a miRNA independent manner and restricts placental vertical transmission in vivo
(A) RT-qPCR for Ifnl3, Ifna2 and Ifnb1 normalized to Polr2a in WT and C2MCΔ/Δ mTS cells (Unpaired two-tailed t-test). (B, C) RT-qPCR for ZIKV normalized to Polr2a in E14.5 WT (n=17) and C2MCΔ/Δ (n=14) placentas (B) and fetal heads (C) obtained from pregnant dams infected with ZIKV on E9.5, after IP injection of anti-mouse IFNAR1 mAb a day prior (Mann-Whitney non-parametric test). (D) RT-qPCR for Ifnl3, Ifna2, Ifnb1 and ZIKV normalized to Polr2a in WT and C2MCΔ/Δ mTS cells infected with ZIKV for 24 hours (Unpaired two-tailed t-test). (E) RT-qPCR of indicated C2MC miRNA normalized to snoRNA202 and Ifnl3 normalized to Polr2a in C2MCΔ/Δ mTS cells transfected with miR-467b-, miR-466b/c/p- or control miR-mimic compared to WT mTS cells transfected with control miR-mimic for 24 hours (One-way ANOVA with Dunnett’s multiple comparison test). (F) RT-qPCR for Ifnl3 and for ZIKV normalized to Polr2a in C2MCΔ/Δ mTS cells transfected as in (E) for 4 hours and then infected with ZIKV for 24 hours (One-way ANOVA with Dunnett’s multiple comparison test). (G) RT-qPCR for Ifnl3, Ifna2 and Ifnb1 normalized to Polr2a in C2MCΔ/Δ mTS cells transfected for 24 hours with either IVT GFP-mRNA (Control) or B1 SINE RNA in the forward direction (B1) (Unpaired two-tailed t-test). (H) RT-qPCR for Ifnl3, Ifna2, Ifnb1 and ZIKV normalized to Polr2a in C2MCΔ/Δ mTS cells transfected as in (G) for 4 hours followed by ZIKV infection for 24 hours (Unpaired two-tailed t-test with Welch’s correction). Data represent the mean ± SEM of a representative experiment performed in triplicate of at least three independent experiments. *p<0.05, **p<0.01, *** p<0.001 and ****p<0.0001 vs C2MCΔ/Δ mTS cells (A, D), vs WT (B, C), vs C2MCΔ/Δ mTS cells transfected with control miR-mimic (E, F) or control GFP-mRNA (G, H). See also Figure S5.

References

    1. Ander SE, Diamond MS, and Coyne CB (2019). Immune responses at the maternal-fetal interface. Sci Immunol 4. 10.1126/sciimmunol.aat6114. - DOI - PMC - PubMed
    1. Soares MJ, Varberg KM, and Iqbal K (2018). Hemochorial placentation: development, function, and adaptations. Biol Reprod 99, 196–211. 10.1093/biolre/ioy049. - DOI - PMC - PubMed
    1. Megli CJ, and Coyne CB (2022). Infections at the maternal–fetal interface: an overview of pathogenesis and defence. Nature Reviews Microbiology 20, 67–82. 10.1038/s41579-021-00610-y. - DOI - PMC - PubMed
    1. Goubau D, Deddouche S, and Reis e Sousa C (2013). Cytosolic sensing of viruses. Immunity 38, 855–869. 10.1016/j.immuni.2013.05.007. - DOI - PMC - PubMed
    1. Rehwinkel J, and Gack MU (2020). RIG-I-like receptors: their regulation and roles in RNA sensing. Nat Rev Immunol 20, 537–551. 10.1038/s41577-020-0288-3. - DOI - PMC - PubMed