. 2023 Jul 24;58(14):1266-1281.e7.
doi: 10.1016/j.devcel.2023.05.009. Epub 2023 Jun 13.

LC3B is lipidated to large lipid droplets during prolonged starvation for noncanonical autophagy

Affiliations

LC3B is lipidated to large lipid droplets during prolonged starvation for noncanonical autophagy

Mohyeddine Omrane et al. Dev Cell. .

Abstract

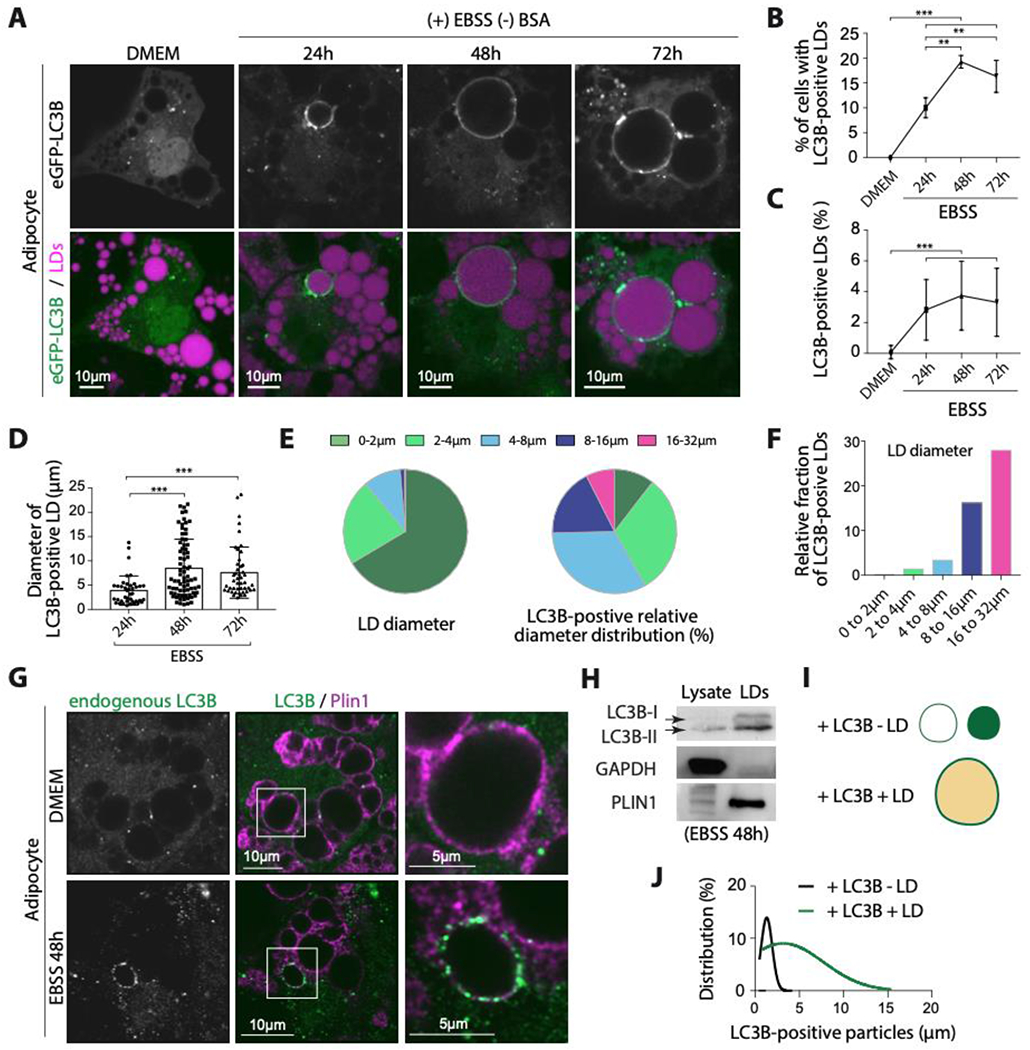
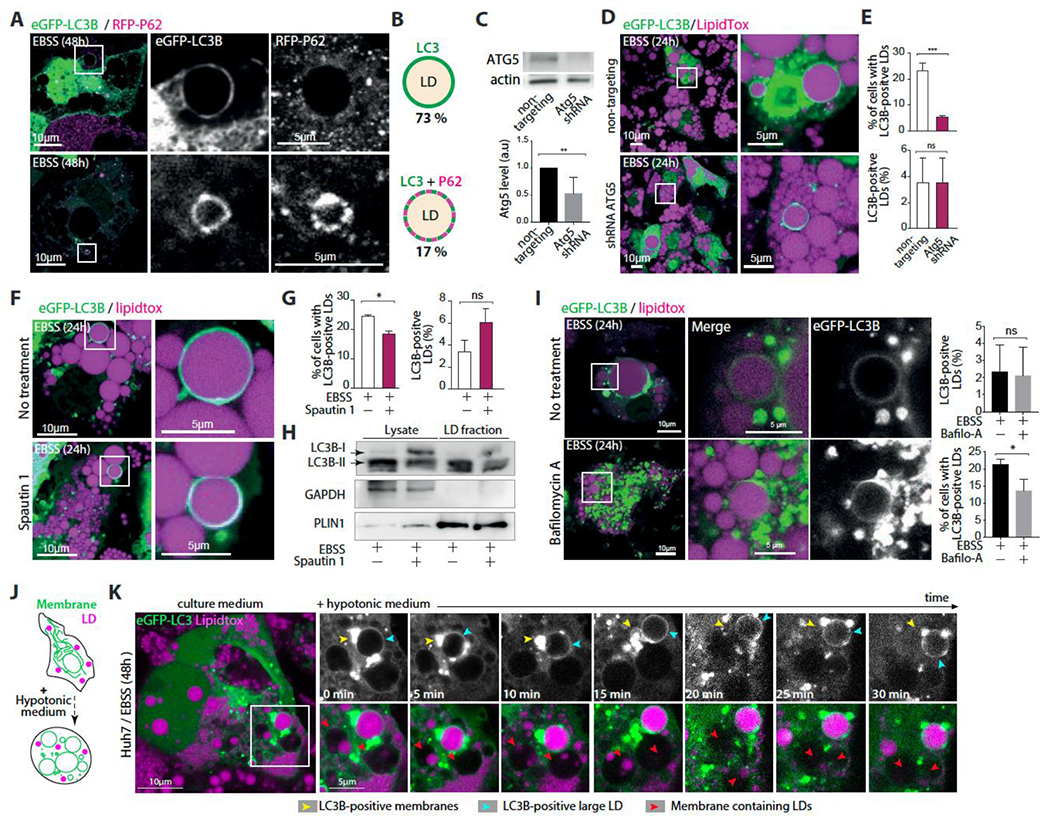
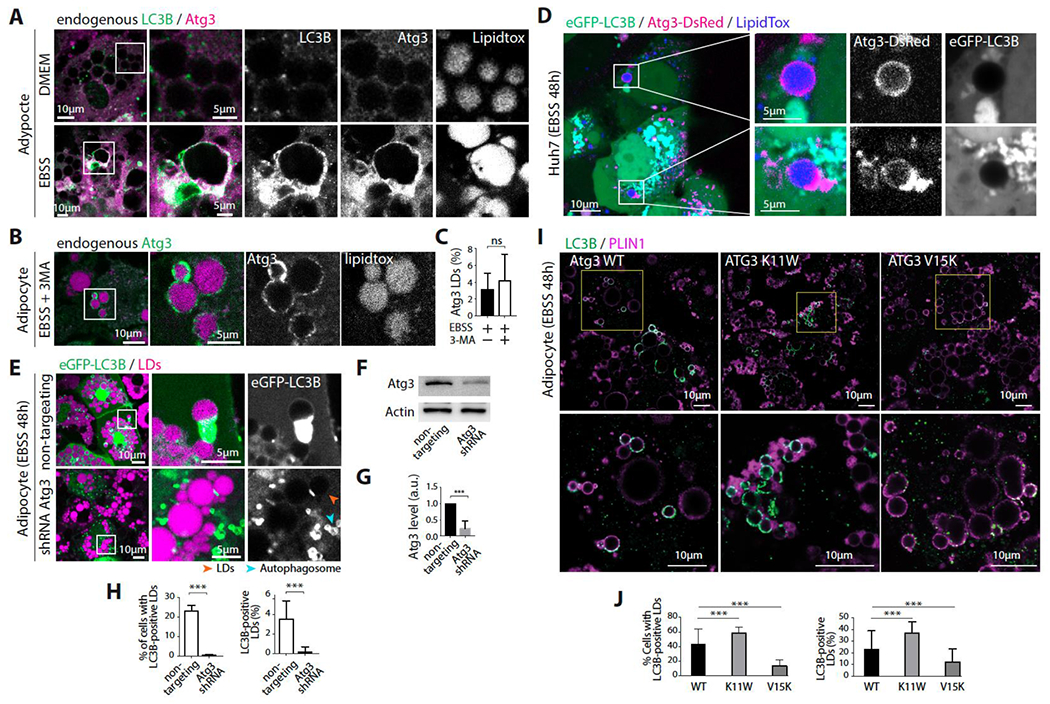
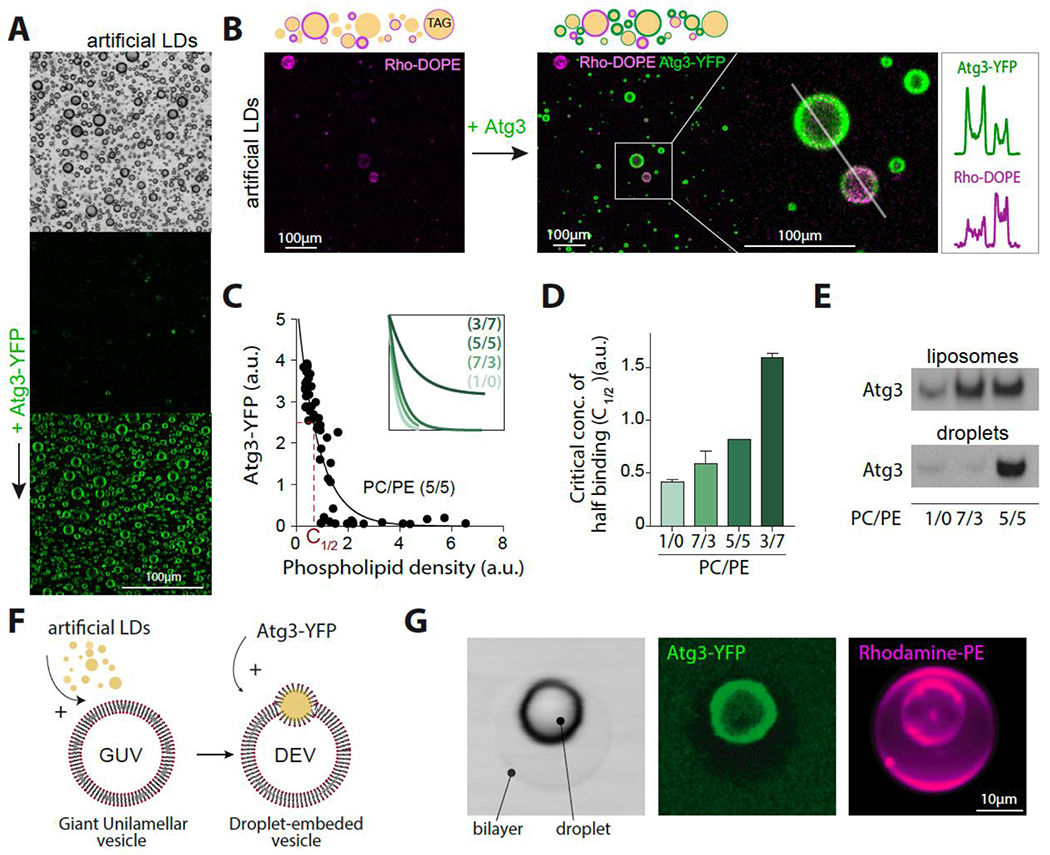
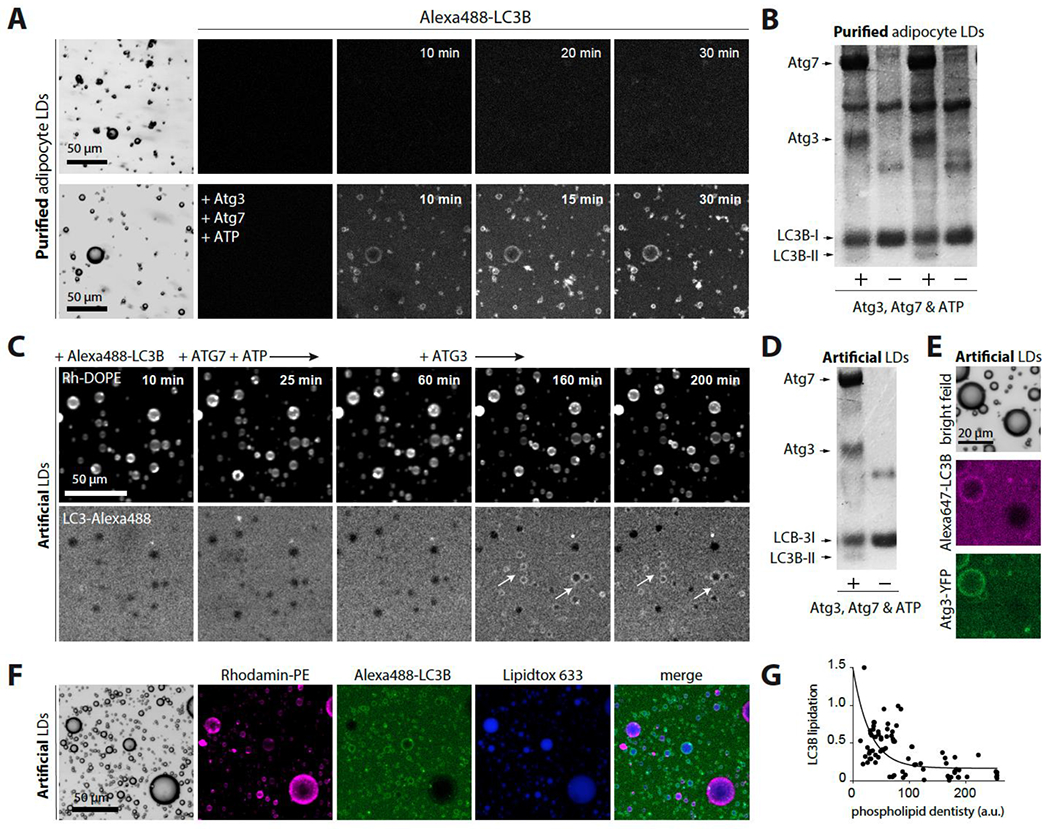
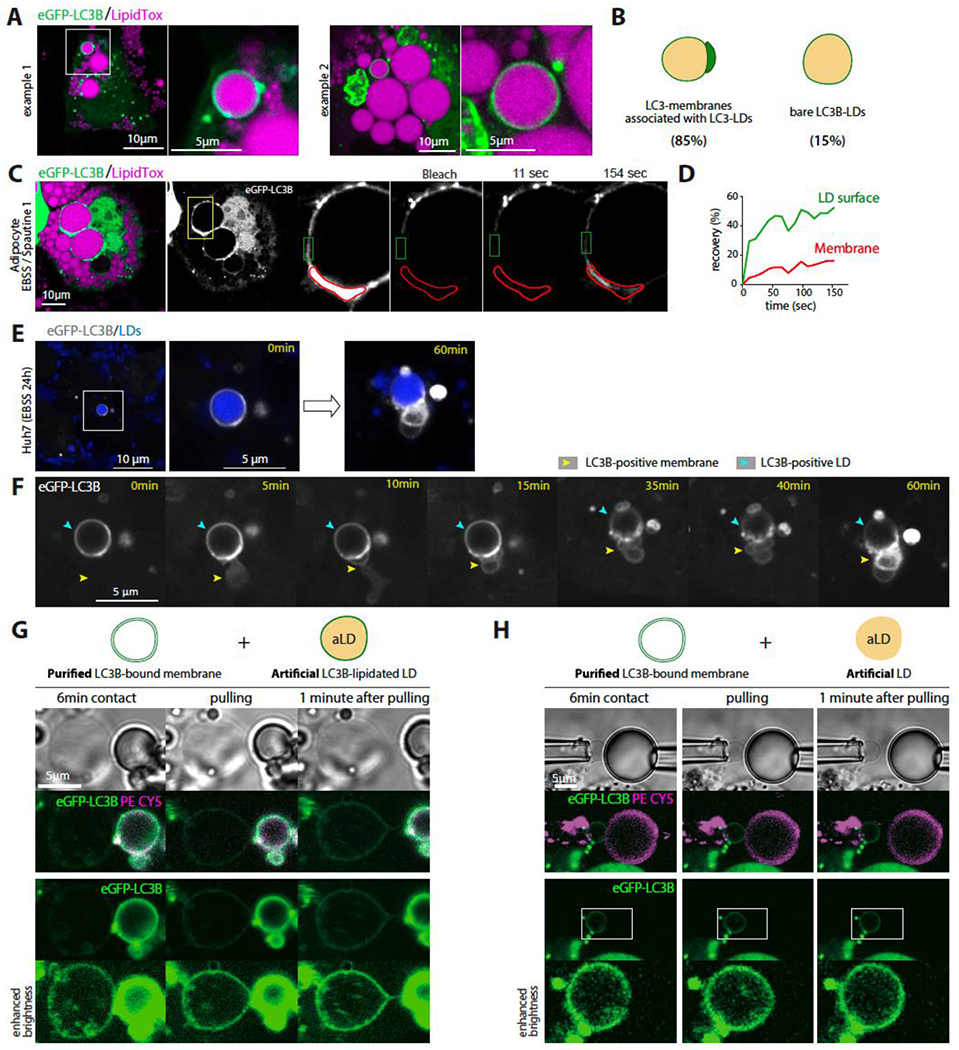
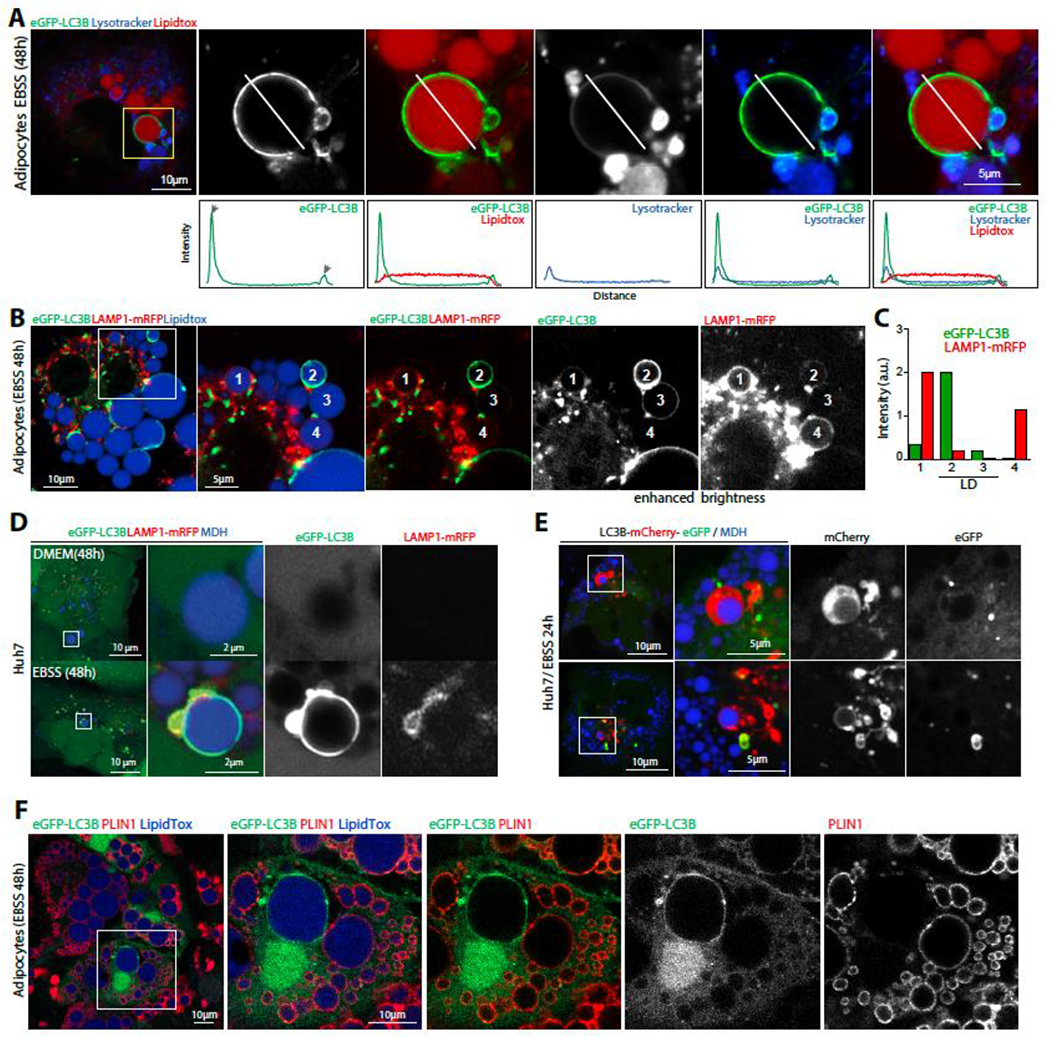
Lipid droplets (LDs) store lipids that can be utilized during times of scarcity via autophagic and lysosomal pathways, but how LDs and autophagosomes interact remained unclear. Here, we discovered that the E2 autophagic enzyme, ATG3, localizes to the surface of certain ultra-large LDs in differentiated murine 3T3-L1 adipocytes or Huh7 human liver cells undergoing prolonged starvation. Subsequently, ATG3 lipidates microtubule-associated protein 1 light-chain 3B (LC3B) to these LDs. In vitro, ATG3 could bind alone to purified and artificial LDs to mediate this lipidation reaction. We observed that LC3B-lipidated LDs were consistently in close proximity to collections of LC3B-membranes and were lacking Plin1. This phenotype is distinct from macrolipophagy, but it required autophagy because it disappeared following ATG5 or Beclin1 knockout. Our data suggest that extended starvation triggers a noncanonical autophagy mechanism, similar to LC3B-associated phagocytosis, in which the surface of large LDs serves as an LC3B lipidation platform for autophagic processes.

Keywords: Atg3; LC3B; lipid droplets; noncanonical autophagy; organelle biogenesis; prolonged starvation.


Conflict of interest statement

Declaration of interests The authors declare no competing interests.

Figures

Figure 1.
Figure 1.. LC3B is recruited to LDs during long-term nutrient deprivation
A. Confocal imaging of eGFP-LC3B and LDs in differentiated 3T3-L1 adipocytes virally transfected with eGFP-LC3B. Cells were incubated in EBSS for the indicated time after transfection. Scale bar, 10 μm. B. Percentage of cells with eGFP-LC3B-positive LDs. Data were obtained from three independent experiments done as described in A. An ordinary one-way ANOVA test was used (** P < 0.001, *** P<0.0001). C. Percentage of eGFP-LC3B-positive LDs per cell. Data were obtained from three independent experiments done as described in A. An ordinary one-way ANOVA test was used (*** P<0.0001). D. Diameter of eGFP-LC3B-positive LDs quantified from three independent experiments done as described in A. An ordinary one-way ANOVA test was used (*** P<0.0001). E. Left: sector graph shows the size distribution of LDs in differentiated 3T3-L1 adipocytes, transfected with eGFP-LC3B and incubated in EBSS for 48hs. Three independent experiments n=10 cells were collapsed. The right sector graph shows the size distribution of eGFP-LC3B-positive LDs. Quantifications are from 4 independent experiments. F. The relative fraction of eGFP-LC3B-positive LDs in a size range (i.e. per size distribution, normalization of E). G. Immunofluorescence staining of LC3B and PLIN1 in differentiated 3T3-L1 adipocytes incubated in EBSS for 48hs. H. Western blot of lysate and LDs fractions of cells treated as described in G. I. Schematic representation of LC3B puncta with or without LD. J. eGFP-LC3B puncta size distribution with or without LDs. The data were obtained from 10 cells from three independent experiments. See also Figure S1.
Figure 2.
Figure 2.. LC3B is not recruited to LDs by known factors
A. Confocal imaging of eGFP-LC3B, mRFP-P62 and LDs in differentiated 3T3-L1 adipocytes. Cells were virally transfected with eGFP-LC3B and mRFP-P62 and incubated in EBSS for 48hs. Scale bar,10 μm (5 μm in insets). B. Schematic representation illustrating the recruitment of eGFP-LC3B alone or with mRFP-P62 on LDs. The percentage of LDs of each phenotype is written below the corresponding schematic representation. Quantifications are the average from three independent experiments. C. Top: western blot of differentiated 3T3-L1 adipocytes virally co-transfected with eGFP-LC3B and with either ATG5 shRNA or non-targeting shRNA for 24h, and then incubated in EBSS for 24h. Bottom: quantification of ATG5 expression from three independent experiments Student’s unpaired t-test is used (**P<0,001). D. Confocal imaging of LDs in differentiated 3T3-L1 adipocytes treated as described in C. Scale bar,10 μm (5 μm in insets). E. Top: Percentage of cells with eGFP-LC3B-positive LDs. Bottom, Percentage of eGFP-LC3B-positive LDs per cell. Quantifications are from three independent experiments. Student’s unpaired t-test is used (***P<0,0001, ns P>0,05) F. Confocal imaging of eGFP-LC3B and LDs in differentiated 3T3-L1 adipocytes virally transfected with eGFP-LC3B and incubated in EBSS alone or EBSS containing Spautin-1 for 48hs. Scale bar,10 μm (5 μm in insets). G. Left, percentage of cells with eGFP-LC3B-positive LDs. Right, Percentage of eGFP-LC3B-positive LDs in the cell. Quantifications are from three independent experiments done as described in F. Student’s unpaired t-test is used (**P<0,001, ns P>0,05). H. Western blot of lysate and LD fractions of differentiated adipocytes incubated in EBSS alone or EBSS containing Spautin-1 for 48hs. I. Confocal imaging of eGFP-LC3B and LDs in differentiated 3T3-L1 adipocytes virally transfected with eGFP-LC3B and incubated in EBSS alone or EBSS containing bafilomycin A for 48hs. Scale bar,10 μm (5 μm in insets). To Right, Up: percentage of eGFP-LC3B-positive LDs in the cell. Down: Percentage of cells with eGFP-LC3B-positive LDs. Quantifications are from three independent experiments. Student’s unpaired t-test is used (* P<0,05, ns P>0,05). J. Schematic representation of the impact of swelling of intracellular organelles by incubating the cells with a hypotonic media. K. Time-lapse imaging experiment performed on Huh7 cells that were transfected with eGFP-LC3B and treated with oleic acid for 24hs, and then incubated in EBSS for 48 hs. At time 0, a hypotonic media was added to induce cell swelling. Imaging was done at the indicated times. See also Figure S2.
Figure 3.
Figure 3.. ATG3 is recruited to lipid droplets during long-term nutrient starvation
A. Immunofluorescence staining of LC3B, ATG3, and LDs in differentiated 3T3-L1 adipocytes incubated in DMEM or EBSS for 48hs. B. Immunofluorescence staining of ATG3 and LDs in differentiated 3T3-L1 adipocytes incubated in EBSS containing 3MA for 48hs. C. Percentage of ATG3-positive LDs per cell. Student’s unpaired t-test is used (ns P>0,05). D. Confocal imaging of Huh7 cells co-transfected with eGFP-LC3B and ATG3-dsRED. Cells were treated with OA to induce LDs and then incubated in EBSS for 48hs. Scale bar, 10 μm (5 μm in insets). E. Confocal imaging of LDs in differentiated 3T3-L1 adipocytes virally co-transfected with eGFP-LC3B and an ATG3 shRNA or eGFP-LC3B and the non-targeting shRNA. Cells were incubated in EBSS for 48hs after transfection. Scale bar, 10 μm (5 μm in insets). F. Western blot of cells treated as described in E. G. The bar graph shows the quantification of ATG3 expression from three Western blots of cells treated as described in E. Student’s unpaired t-test is used (*** P<0,0001). H. Right, percentage of cells with eGFP-LC3B-positive LDs. Left, percentage of eGFP-LC3B-positive LDs per cell. Quantifications are from three independent experiments. Student’s unpaired t-test is used (*** P<0,0001). I. Immunofluorescence staining of LC3B and PLIN1 in differentiated adipocytes stably transfected with mATG3 WT, mATG3 K11W, or mATG3 V15K. Cells were incubated in EBSS for 48hs then fixed and stained (LC3B in green, PLIN1 in magenta). Scale bar, 10 μm (5 μm in insets). J. Right, percentage of cells with LC3B-positive LDs. Left, percentage of LC3B-positive LDs per cell. Quantifications are from three independent experiments. An ordinary one-way ANOVA test was used (*** P<0,0001) See also Figure S3.
Figure 4.
Figure 4.. ATG3 better binds to model LDs enriched in PE
A. Confocal imaging of triolein droplets before and after ATG3-YFP addition. Scale bare (100 μm). B. Top: Schematic illustration of triolein-in-buffer droplets decorated by different phospholipid densities ((1/1) PC/PE), reported by rhodamine-PE (Rho-PE). Bottom: confocal imaging of triolein-in-buffer droplets with different phospholipid coverage, ranging from 0.005% to 0.2% (w/w to triolein) before and after ATG3 addition. Scale bare (100 μm). Line profiles show the intensity levels of ATG3-YFP and Rho-PE on droplets depicted in the inset. C. ATG3-YFP recruitment to triolein droplets as a function of the phospholipid density, reported by Rho-PE. The concentration at half of maximum binging is depicted in the main figure. Concentration at half of maximum binding C1/2 is shown in red. The inset figure shows the different recruitment profiles of Atg3-YPF depending on the PC/PE ratio. D. The characteristic concentration C1/2 of ATG3-YFP binding from experiments done as described in B for the indicated PC/PE ratio. E. Western blot of untagged ATG3 recombinant protein bound to liposomes and artificial LDs in the top fraction of flotation assays. F. Schematic representation of the droplet-embedded vesicle (DEV) system. G. Confocal imaging of a DEV made of 7/3 PC/PE and incubated with ATG3-YFP. Scale bare (10 μm). See also Figure S4.
Figure 5.
Figure 5.. ATG3 lipidates LC3 to purified and artificial LDs
A. Confocal imaging of purified adipocyte LDs in HKM buffer containing Alexa488-LC3B, in the presence or absence of the lipidation reaction components ATG7, ATG3, ATP. B. LDs from the previous experiment are collected and analyzed using SDS–PAGE in a stained Coomassie blue. C. Confocal imaging of triolein-in-buffer droplets decorated by PC/PE (7/3) incubated with Alexa488-LC3B, then ATG7 and ATP. No lipidation occurred. When ATG3 was subsequently added, lipidation occurred on the artificial LDs (arrows show examples). D. Artificial LDs from the previous experiment are collected and analyzed using SDS–PAGE in a stained Coomassie blue. E. Triolein-in-buffer droplets decorated with PC/PE at different monolayer phospholipid densities (based on Rho-PE signal) are imaged using confocal microscopy after being incubated with Alexa647-LC3B and Atg3/Atg3-YFP (80/20), ATP, and ATG7. F. Confocal imaging of triolein-in-buffer droplets decorated by PC/PE (7/3) at different monolayer phospholipid densities varied from 0.005% to 0.2% (w/w to triolein). They are incubated with Alexa488-LC3B and Atg3 (80/20), ATP and ATG7. G. Quantification of F. LC3B-Alexa488 lipidation to triolein droplets as a function of the phospholipid density. See also Figure S5.
Figure 6.
Figure 6.. LC3B-positive LDs exhibit interaction with organelles that also contain LC3B
A. Confocal imaging of differentiated 3T3-L1 adipocytes virally transfected with eGFP-LC3B. Cells are incubated in EBSS for 48hs after transfection. Scale bar, 10 μm. B. Schematic illustration of eGFP-LC3B-positive LDs with or without eGFP-LC3B puncta associated. The fraction of each phenotype is indicated beneath each case. Quantifications are from three independent experiments. C. FRAP analysis of eGFP-LC3B in differentiated 3T3-L1 adipocytes virally transfected with eGFP-LC3B and incubated in EBSS containing Spautin-1 for 48hs. The insets indicate the bleached region: red for the autophagosome area and green for the LD surface. Scale bar, 10 μm. D. Recovery kinetics of eGFP-LC3B in the different regions depicted in C. The signals were corrected for the bleach. E. Confocal imaging of Huh7 cells virally transfected with eGFP-LC3B and treated with oleic acid for 24h and then incubated in EBSS for 24h. eGFP-LC3B positive LDs are shown at 0 and 60 minutes. F. Time-lapse from confocal live imaging of Huh7 cells presented in E at the indicated times. The cyan arrowhead indicates the eGFP-LC3B-positive LD region and the yellow one an LC3B-positive membrane being recruited to the LD. G. Top: Schematic representation of a purified eGFP-LC3B-bound membrane and an eGFP-LC3B-lipidated artificial LD (PE-Cy5 report for phospholipids decorating the artificial LD). Bottom, confocal imaging of eGFP-LC3B bound membrane extracted from Huh7 cells and an eGFP-LC3B-lipidated artificial LD, each captured by a micropipette and put in contact for 6 minutes. Afterward, the two objects are slowly pulled away from each other. H. Top: Schematic representation of a purified eGFP-LC3B-bound membrane and an artificial LD solely decorated by phospholipids. Bottom, confocal imaging of eGFP-LC3B-bound membrane extracted from Huh7 cells and an artificial LD with the same lipid composition as in G. Both objects are captured by a micropipette and put in contact for 6 minutes before they are slowly pulled away from each other. See also Figure S6.
Figure 7.
Figure 7.. LC3B-positive LDs interact with acidified autophagosome-like membranes
A. Confocal imaging of eGFP-LC3B, lysotracker (blue) and LDs (LipidTox) in differentiated 3T3-L1 adipocytes virally transfected with eGFP-LC3B. Cells are incubated in EBSS for 48hs after transfection. Scale bar,10 μm (5 μm in insets). Bottom panels are intensity profiles of the line drawn in each image. B. Confocal imaging of eGFP-LC3B (green), LAMP1-mRFP (red) and LDs (LipidTox) in differentiated 3T3-L1 adipocytes virally transfected with eGFP-LC3B and LAMP1-mRFP, incubated in EBSS for 48hs. Example LDs at different stages of eGFP-LC3B and LAMP1-mRFP recruitment are numbered. C. Relative intensity of eGFP-LC3B and LAMP1-mRFP on the different LDs. D. Confocal imaging of eGFP-LC3B, LAMP1-mRFP and LDs in Huh7 virally transfected with eGFP-LC3B and LAMP1-mRFP, loaded with oleic acid for 24hs, and starved or not. Scale bar,10 μm (2 μm in insets) E. Confocal imaging of LC3B-mCherry-eGFP and LDs in Huh7 loaded with oleic acid for 24h and then placed in EBSS for 24h. Scale bar,10 μm (5 μm in insets). F. Immunofluorescence staining of PLIN1 in differentiated 3T3-L1 adipocytes transfected with eGFP-LC3B and incubated in EBSS for 48hs. See also Figure S7.

Similar articles

Cited by

  • LC3 conjugation to lipid droplets.
    Omrane M, Melia TJ, Thiam AR. Omrane M, et al. Autophagy. 2023 Dec;19(12):3251-3253. doi: 10.1080/15548627.2023.2249390. Epub 2023 Aug 23. Autophagy. 2023. PMID: 37599471 Free PMC article.
  • Membrane atg8ylation in Canonical and Noncanonical Autophagy.
    Deretic V, Duque T, Trosdal E, Paddar M, Javed R, Akepati P. Deretic V, et al. J Mol Biol. 2024 Aug 1;436(15):168532. doi: 10.1016/j.jmb.2024.168532. Epub 2024 Mar 12. J Mol Biol. 2024. PMID: 38479594 Free PMC article. Review.
  • Giant organelle vesicles to uncover intracellular membrane mechanics and plasticity.
    Santinho A, Carpentier M, Lopes Sampaio J, Omrane M, Thiam AR. Santinho A, et al. Nat Commun. 2024 May 4;15(1):3767. doi: 10.1038/s41467-024-48086-7. Nat Commun. 2024. PMID: 38704407 Free PMC article.
  • Lipid droplets and cellular lipid flux.
    Mathiowetz AJ, Olzmann JA. Mathiowetz AJ, et al. Nat Cell Biol. 2024 Mar;26(3):331-345. doi: 10.1038/s41556-024-01364-4. Epub 2024 Mar 7. Nat Cell Biol. 2024. PMID: 38454048 Free PMC article. Review.
  • An update on autophagy disorders.
    Dafsari HS, Martinelli D, Saffari A, Ebrahimi-Fakhari D, Fanto M, Dionisi-Vici C, Jungbluth H. Dafsari HS, et al. J Inherit Metab Dis. 2025 Jan;48(1):e12798. doi: 10.1002/jimd.12798. Epub 2024 Oct 17. J Inherit Metab Dis. 2025. PMID: 39420677 Free PMC article. Review.

References

    1. Mizushima N, and Komatsu M (2011). Autophagy: renovation of cells and tissues. Cell 147, 728–741. - PubMed
    1. Feng Y, He D, Yao Z, and Klionsky DJ (2014). The machinery of macroautophagy. Cell Res. 24, 24–41. - PMC - PubMed
    1. Mizushima N, Ohsumi Y, and Yoshimori T (2002). Autophagosome formation in mammalian cells. Cell Struct. Funct 27, 421–429. - PubMed
    1. Mizushima N (2020). The ATG conjugation systems in autophagy. Curr. Opin. Cell Biol 63, 1–10. - PubMed
    1. Sawa-Makarska J, Baumann V, Coudevylle N, von Bülow S, Nogellova V, Abert C, Schuschnig M, Graef M, Hummer G, and Martens S (2020). Reconstitution of autophagosome nucleation defines Atg9 vesicles as seeds for membrane formation. Science 369. - PMC - PubMed

Publication types

MeSH terms

Substances