. 2023 Jun 14;14(1):3513.
doi: 10.1038/s41467-023-39174-1.

Dimethyl fumarate and 4-octyl itaconate are anticoagulants that suppress Tissue Factor in macrophages via inhibition of Type I Interferon

Affiliations

Dimethyl fumarate and 4-octyl itaconate are anticoagulants that suppress Tissue Factor in macrophages via inhibition of Type I Interferon

Tristram A J Ryan et al. Nat Commun. .

Erratum in

Abstract

Excessive inflammation-associated coagulation is a feature of infectious diseases, occurring in such conditions as bacterial sepsis and COVID-19. It can lead to disseminated intravascular coagulation, one of the leading causes of mortality worldwide. Recently, type I interferon (IFN) signaling has been shown to be required for tissue factor (TF; gene name F3) release from macrophages, a critical initiator of coagulation, providing an important mechanistic link between innate immunity and coagulation. The mechanism of release involves type I IFN-induced caspase-11 which promotes macrophage pyroptosis. Here we find that F3 is a type I IFN-stimulated gene. Furthermore, F3 induction by lipopolysaccharide (LPS) is inhibited by the anti-inflammatory agents dimethyl fumarate (DMF) and 4-octyl itaconate (4-OI). Mechanistically, inhibition of F3 by DMF and 4-OI involves suppression of Ifnb1 expression. Additionally, they block type I IFN- and caspase-11-mediated macrophage pyroptosis, and subsequent TF release. Thereby, DMF and 4-OI inhibit TF-dependent thrombin generation. In vivo, DMF and 4-OI suppress TF-dependent thrombin generation, pulmonary thromboinflammation, and lethality induced by LPS, E. coli, and S. aureus, with 4-OI additionally attenuating inflammation-associated coagulation in a model of SARS-CoV-2 infection. Our results identify the clinically approved drug DMF and the pre-clinical tool compound 4-OI as anticoagulants that inhibit TF-mediated coagulopathy via inhibition of the macrophage type I IFN-TF axis.


Conflict of interest statement

The authors declare no competing interests.

Figures
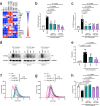
Fig. 1
Fig. 1. DMF and 4-OI inhibit LPS-mediated F3 induction and TF-dependent thrombin generation in macrophages.
a Heatmap from RNA sequencing of selected inflammation-associated coagulation genes in LPS-stimulated mouse macrophages (BMDMs) pre-treated (3 h) with DMF compared to DMSO control prior to LPS stimulation (4 h). b BMDMs (n = 3) and c PBMCs (n = 4) were pre-treated with DMSO, DMF, or 4-OI (1 h) prior to LPS stimulation (3 h) and harvesting cell lysates. Quantification of F3 mRNA by qRT-PCR in b BMDMs (DMSO–250 μM 4-OI, P = 0000178) and c PBMCs. d Western blot and e densitometry analysis of TF in BMDM cell lysates pre-treated with DMSO, DMF, or 4-OI (1 h) prior to LPS stimulation (3 h), with GAPDH as loading control. fh BMDMs were pre-treated with DMSO, f DMF, or g 4-OI (1 h) before LPS priming (3 h). Thrombin generation was measured in BMDMs in situ in plate wells using FXII-deficient plasma. h Lagtime represents time-to-clot formation. NS–DMSO, P = 0.000015; DMSO–5 μM DMF, P = 0.00001; DMSO–10 μM DMF, P = 0.0000006. Data from b, c are mean ± SEM from 3, 4 independent experiments. Blot from d is three mice from three independent experiments. Data from eh are mean ± SD from three independent experiments. P values calculated one-way ANOVA for multiple comparisons. Source data are provided as a Source Data file.
Fig. 2
Fig. 2. F3 is a type I IFN-stimulated gene with JAK-STAT-dependency, and DMF and 4-OI suppress TF release from macrophages via inhibition of type I IFN- and caspase-11-mediated pyroptosis.
a BMDMs were pre-treated with DMSO, DMF, or 4-OI (3 h) before LPS priming (16 h) and harvesting cell lysates (n = 6). Ifnb1 mRNA was quantified by qRT-PCR. DMSO–250 μM 4-OI, P = 0.00004. b BMDMs were pre-treated with DMSO, DMF, or 4-OI (3 h) prior to LPS priming (6 h). IFN-β in the supernatant was measured by enzyme-linked immunosorbent assay (ELISA) (n = 3). c BMDMs from WT and Ifnar−/− mice (n = 4) were stimulated with LPS (3 h). F3 mRNA was quantified by qRT-PCR. LPS 3 h, WT–KO, P = 0.0000000488. d BMDMs were stimulated with recombinant mouse IFN-β for a timecourse as indicated (n = 3). F3 mRNA was quantified by qRT-PCR. e BMDMs pre-treated with DMSO, DMF, or 4-OI (1 h) before stimulation with recombinant mouse IFN-β (4 h) and harvesting cell lysates (n = 9). F3 mRNA was quantified by qRT-PCR. DMSO–4-OI, P = 0.00000018. f BMDMs (n = 4) were pre-treated with DMSO, DMF, 4-OI, or baricitinib (1 h) before LPS stimulation (3 h). F3 mRNA was quantified by qRT-PCR. DMSO–DMF, P = 0.0000144; DMSO–4-OI, P = 0.0000133; DMSO–baricitinib, P = 0.00000134. g BMDMs (n = 6) were transfected with Ctrl or Jak1 siRNA and stimulated with LPS (3 h). F3 mRNA was quantified by qRT-PCR. h Predicted transcription factor sites in the promoter of the F3 gene via the Interferome database. Data presented shows the predicted location of transcription factors from the region spanning −1500 bp to +500 bp from the start site of the F3 gene promoter. i The location of STAT1- and IRF1-transcription factor sites in the promoter of the human F3 gene, analyzed from enrichment analysis of 6 independent experiments from publicly available data using the ChIP-Atlas. j Representative western blot of CASPASE-11 in BMDM cell lysates pre-treated with DMSO, DMF, or 4-OI (1 h) prior to LPS stimulation (3 h), with α-TUBULIN as loading control. Blot is representative of three independent experiments. k BMDMs (n = 3) were pre-treated with DMSO, DMF, or 4-OI (1 h) before priming with LPS (3 h) and LPS transfection (16 h). Pyroptosis is represented as percentage cell death measured by LDH release in BMDM supernatants. DMSO–10 μM DMF, P = 0.0000247; DMSO–250 μM 4-OI, P = 0.000084. l Representative western blot of TF in BMDMs pre-treated with DMSO, DMF, or 4-OI (1 h) prior to LPS priming (3 h) and LPS transfection (16 h). Blots are representative of three independent experiments. Densitometry analysis of TF in BMDM (m) supernatants and n cell lysates, with GAPDH as loading control. oq BMDMs were pre-treated with DMSO, o DMF, or p 4-OI (1 h) before priming with LPS (3 h) and LPS transfection (16 h). Thrombin generation was measured in BMDMs in situ in plate wells using FXII-deficient plasma. q Lagtime represents time-to-clot formation. NS–DMSO, P = 0.000017; DMSO–5 μM DMF, P = 0.000044; DMSO–10 μM DMF, P = 0.0000019; DMSO–250 μM 4-OI, P = 0.00007985. Data from ag, k are mean ± SEM from 3–6 independent experiments. Data from mq are mean ± SD from 3 independent experiments. P values calculated using two-tailed Student’s t test for paired comparisons or one-way ANOVA for multiple comparisons. Source data are provided as a Source Data file.
Fig. 3
Fig. 3. Therapeutic treatment with DMF and 4-OI suppresses thrombin generation in vivo induced by LPS, E. coli, and S. aureus, improving survival in mice.
af Mice were intraperitoneally injected with 1 mg/kg LPS (2 h) followed by treatment with PBS, a 50 mg/kg DMF, b 50 mg/kg 4-OI, c 50 mg/kg baricitinib, or d 15 mg/kg 1H1 anti-TF antibody (for a further 4 h) via intraperitoneal injection. Citrated plasma was harvested and thrombin generation was assessed (n = 4 per group). Thrombin generation in ad is compared relative to PBS-treated mice ±LPS challenge. e Peak thrombin in mouse citrated plasma treated as in ad. PBS–LPS + PBS, P = 0.00000637; LPS + PBS–LPS + DMF, P = 0.0000008; LPS + PBS–LPS + 4-OI, P = 0.0000167; LPS + PBS–LPS + 1H1, P = 0.0000000055. f Total thrombin generation (ETP = endogenous thrombin potential) in mouse citrated plasma treated as in ad. LPS + PBS–LPS + 1H1, P = 0.00000135. g Kaplan–Meier survival curve of mice injected intraperitoneally with 15 mg/kg LPS (24 h) followed by treatment with PBS, 50 mg/kg DMF, 50 mg/kg 4-OI, or 200 IU/kg heparin (for a further 48 h) (n = 10 per group). LPS + PBS–treatment groups, P = 0.0000003. h Mice from g were scored clinically (assessing weight loss, activity level, eye closure, and appearance of fur and posture) every 6 h for the duration of the 72 h experiment. LPS + PBS–LPS + DMF, P = 0.00000001997. Data points indicate individual mice in g, h. For g, h Mantel–Cox survival analysis was performed. i Mice were intraperitoneally injected with 1 × 107 CFU E. coli (CFT073) and co-treated with PBS, 50 mg/kg DMF, or 50 mg/kg 4-OI (6 h), followed by supplemental treatment via intraperitoneal injection with PBS, 50 mg/kg DMF, or 50 mg/kg 4-OI (for a further 18 h). Citrated plasma was harvested and thrombin generation was assessed (n = 5 per group). j Peak and k total thrombin generation in mouse citrated plasma treated as in i (n = 5 per group). l BMDMs were pre-treated with DMSO, DMF, or 4-OI (1 h) before infection with 5 × 106 CFU S. aureus (USA300-LAC) (3 h) and harvesting cell lysates. F3 mRNA was quantified by qRT-PCR. m Mice were intraperitoneally injected with 5 × 108 CFU S. aureus (PS80) and co-treated with PBS, 50 mg/kg DMF, or 50 mg/kg 4-OI (6 h), followed by supplemental treatment via intraperitoneal injection with PBS, 50 mg/kg DMF, or 50 mg/kg 4-OI (for a further 18 h). Citrated plasma was harvested and thrombin generation was assessed (n = 5 per group). n Peak thrombin generation in mouse citrated plasma treated as in m. o TF-positive regions (red) in the lungs of mice treated as in m. Representative lung tissue sections are shown. Magnification ×20. Scale bar = 10 μm. Data from ak and m, n are mean ± SD. Data from l are mean ± SEM from three independent in vitro experiments. P values were calculated using a two-tailed Student’s t test for paired comparisons or one-way ANOVA for multiple comparisons. Source data are provided as a Source Data file.
Fig. 4
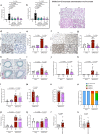
Fig. 4. 4-OI suppresses lung inflammation with associated coagulopathy after SARS-CoV-2 infection.
a, b BMDMs were pre-treated with DMSO, DMF, or 4-OI (1 h) before poly(I:C) stimulation (3 h) and harvesting cell lysates. a F3 and b Casp4 (caspase-11) mRNA was quantified by qRT-PCR. c Representative images of H&E staining examining histological changes in lung structure and inflammatory cell infiltration in the primary airways, parenchyma, and vasculature from male K18-hACE2 mice infected with 103 PFU SARS-CoV-2 (Wuhan isolate; VIC01/2020) or mock infection and intranasally treated with PBS or 4-OI (10 mg/kg) from 1 day post infection, with daily treatments continuing until the termination of the experiment at day 6 post infection (n = 5–6 per group). d Representative images and e quantification of vWF staining in lung sections from mice treated as in c (n = 5–6 per group). Mock+PBS–SARS-CoV-2 + PBS, P = 0.00000000002; SARS-CoV-2 + PBS–SARS-CoV-2 + 4-OI, P = 0.00000000002. f Representative images and g quantification of fibrinogen staining in lung sections from mice treated as in c (n = 5, 6 per group). Mock+PBS–SARS-CoV-2 + PBS, P = 0.000016; SARS-CoV-2 + PBS–SARS-CoV-2 + 4-OI, P = 0.000002887. h Representative images and i quantification of collagen deposition in lung sections from mice treated as in c. Total numbers of j neutrophils, k lymphocytes, and l leukocytes (Mock+PBS–SARS-CoV-2 + PBS, P = 0.000078) in the bronchoalveolar lavage fluid (BALF) of mice treated as in c. Viral titers in the m BALF and in n lung homogenates from SARS-CoV-2-infected mice treated as in c, detected using plaque assays. n = 5, 6 per group for in. o Clinical scoring of mice (assessed for weight loss, activity level, eye closure, and appearance of fur and posture) treated as in c. Clinical scoring of mice assigned SARS-CoV-2-infected mice to both categories 2 and 3 (83% to category 2, 17% mice to category 3), while SARS-CoV-2-infected mice that received therapeutic administration of 4-OI were dispersed across no clinical score, category 1, and category 2 groups (33% mice to no clinical score, 50% mice to category 1, and 17% mice to category 2). Quantification of p Ifnb1 (Mock+PBS–SARS-CoV-2 + PBS, P = 0.00003) and q Nfe2l2 mRNA by qRT-PCR in PBMCs of mice treated as in c (n = 5, 6 per group). Human PBMCs from healthy controls (HC) (n = 5, 6) and SARS-CoV-2-infected patients (n = 9–11) were assessed for quantification of r F3 and s CASP4 mRNA by qRT-PCR. Data from a, b and r, s are mean ± SEM from three independent in vitro experiments. Data from e, g, in, and p, q are mean ± SD. Scale bar for c, d, f, and h = 50 μm. P values calculated using two-tailed Student’s t test for paired comparisons or one-way ANOVA for multiple comparisons. Source data are provided as a Source Data file.

References

    1. Delvaeye M, Conway EM. Coagulation and innate immune responses: can we view them separately? Blood. 2009;114:2367–2374. - PubMed
    1. Engelmann B, Massberg S. Thrombosis as an intravascular effector of innate immunity. Nat. Rev. Immunol. 2013;13:34–45. - PubMed
    1. Seymour CW, et al. Assessment of clinical criteria for sepsis: for the third international consensus definitions for sepsis and septic shock (Sepsis-3) JAMA. 2016;315:762–774. - PMC - PubMed
    1. Reinhart K, et al. Recognizing sepsis as a global health priority - a WHO resolution. N. Engl. J. Med. 2017;377:414–417. - PubMed
    1. Rudd KE, et al. Global, regional, and national sepsis incidence and mortality, 1990-2017: analysis for the Global Burden of Disease Study. Lancet. 2020;395:200–211. - PMC - PubMed

Publication types