

Local and wide-scale livestock movement networks inform disease control strategies in East Africa
- PMID: 37316521
- PMCID: PMC10267211
- DOI: 10.1038/s41598-023-35968-x
Local and wide-scale livestock movement networks inform disease control strategies in East Africa
Abstract
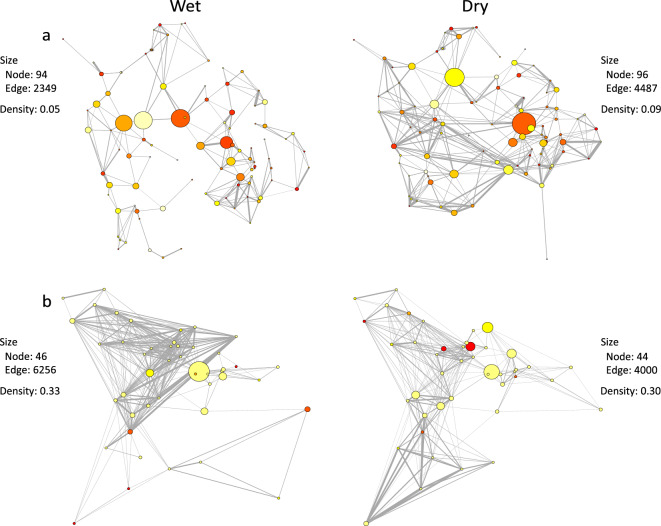
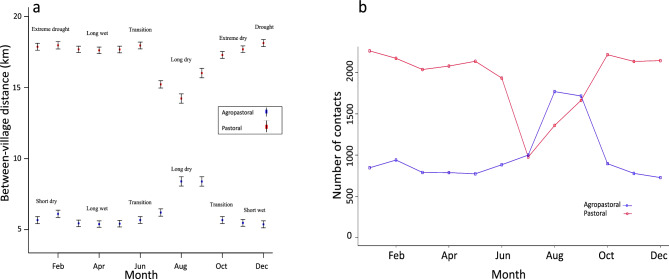
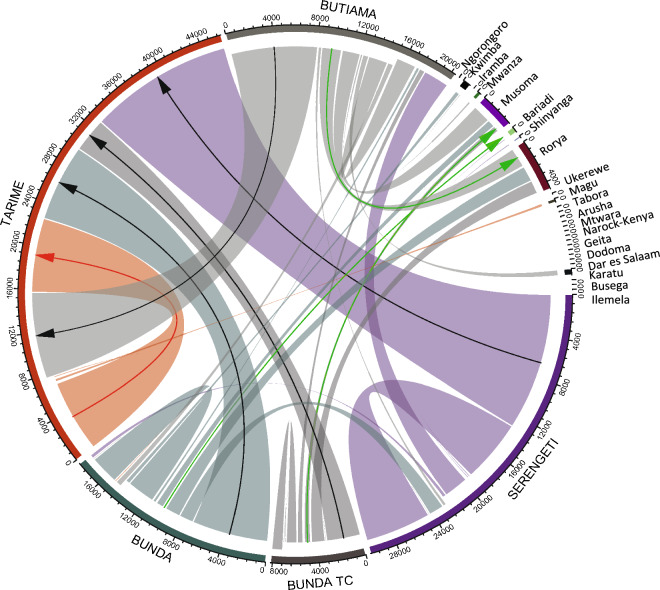
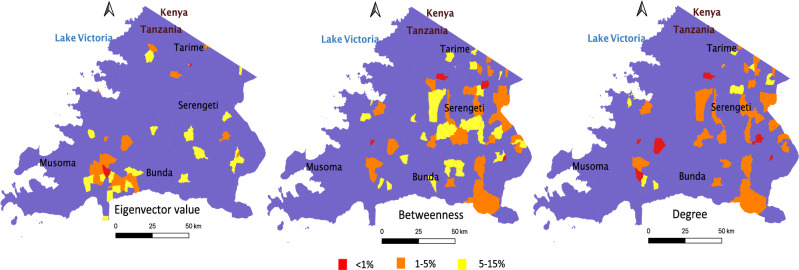
Livestock mobility exacerbates infectious disease risks across sub-Saharan Africa, but enables critical access to grazing and water resources, and trade. Identifying locations of high livestock traffic offers opportunities for targeted control. We focus on Tanzanian agropastoral and pastoral communities that account respectively for over 75% and 15% of livestock husbandry in eastern Africa. We construct networks of livestock connectivity based on participatory mapping data on herd movements reported by village livestock keepers as well as data from trading points to understand how seasonal availability of resources, land-use and trade influence the movements of livestock. In communities that practise agropastoralism, inter- and intra-village connectivity through communal livestock resources (e.g. pasture and water) was 1.9 times higher in the dry compared to the wet season suggesting greater livestock traffic and increased contact probability. In contrast, livestock from pastoral communities were 1.6 times more connected at communal locations during the wet season when they also tended to move farther (by 3 km compared to the dry season). Trade-linked movements were twice more likely from rural to urban locations. Urban locations were central to all networks, particularly those with potentially high onward movements, for example to abattoirs, livestock holding grounds, or other markets, including beyond national boundaries. We demonstrate how livestock movement information can be used to devise strategic interventions that target critical livestock aggregation points (i.e. locations of high centrality values) and times (i.e. prior to and after the wet season in pastoral and agropastoral areas, respectively). Such targeted interventions are a cost-effective approach to limit infection without restricting livestock mobility critical to sustainable livelihoods.
© 2023. The Author(s).
Conflict of interest statement
The authors declare no competing interests.
Figures
Similar articles
-
Cattle transhumance and agropastoral nomadic herding practices in Central Cameroon.BMC Vet Res. 2018 Jul 3;14(1):214. doi: 10.1186/s12917-018-1515-z. BMC Vet Res. 2018. PMID: 29970084 Free PMC article.
-
Livestock movement informs the risk of disease spread in traditional production systems in East Africa.Sci Rep. 2021 Aug 12;11(1):16375. doi: 10.1038/s41598-021-95706-z. Sci Rep. 2021. PMID: 34385539 Free PMC article.
-
Trade-offs for climate-resilient pastoral livelihoods in wildlife conservancies in the Mara ecosystem, Kenya.Pastoralism. 2017;7(1):10. doi: 10.1186/s13570-017-0085-1. Epub 2017 May 23. Pastoralism. 2017. PMID: 32055390 Free PMC article.
-
Epidemiological Dynamics of Foot-and-Mouth Disease in the Horn of Africa: The Role of Virus Diversity and Animal Movement.Viruses. 2023 Apr 14;15(4):969. doi: 10.3390/v15040969. Viruses. 2023. PMID: 37112947 Free PMC article. Review.
-
Resilient livelihoods in Africa's pastoral-agropastoral transition zones will increasingly depend on heat stress adaptation and systemic change.Nat Food. 2024 Dec;5(12):976-981. doi: 10.1038/s43016-024-01079-7. Epub 2024 Nov 25. Nat Food. 2024. PMID: 39587364 Review.
Cited by
-
Assessing the risk of diseases with epidemic and pandemic potential in a changing world.Sci Adv. 2025 Jul 25;11(30):eadw6363. doi: 10.1126/sciadv.adw6363. Epub 2025 Jul 23. Sci Adv. 2025. PMID: 40700491 Free PMC article.
-
Network Analysis of Small Ruminant Movements in Uganda: Implications for Control of Transboundary Animal Diseases.Transbound Emerg Dis. 2025 May 14;2025:7474495. doi: 10.1155/tbed/7474495. eCollection 2025. Transbound Emerg Dis. 2025. PMID: 40400717 Free PMC article.
References
-
- Herrero M, et al. The roles of livestock in developing countries. Animal. 2013;7:3–18. - PubMed
-
- Casey-Bryars M, et al. Waves of endemic foot-and-mouth disease in eastern Africa suggest feasibility of proactive vaccination approaches. Nat. Ecol. Evol. 2018;2:1449–1457. - PubMed
-
- Otte M, Chilonda P. Cattle and Small Ruminant Production Systems in Sub-Saharan Africa. Food and Agriculture Organization Livestock Information and Policy Branch; 2002. pp. 1–105.
Publication types
MeSH terms
Grants and funding
LinkOut - more resources
Full Text Sources
