. 2023 Jun 14;13(1):9622.
doi: 10.1038/s41598-023-36551-0.

Functional connectivity discriminates epileptogenic states and predicts surgical outcome in children with drug resistant epilepsy

Affiliations

Functional connectivity discriminates epileptogenic states and predicts surgical outcome in children with drug resistant epilepsy

Sakar Rijal et al. Sci Rep. .

Abstract

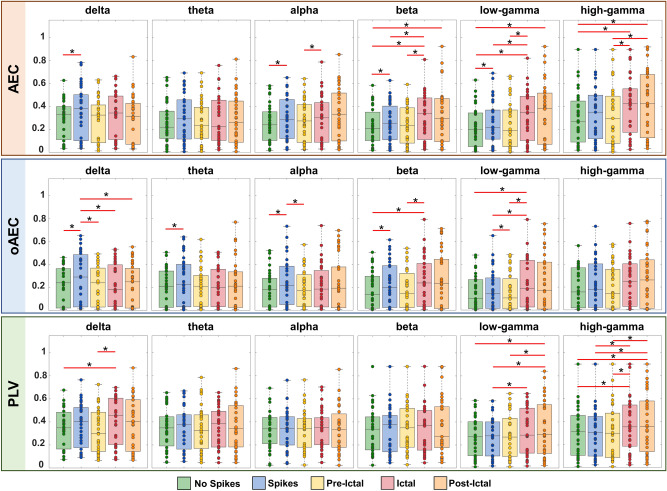
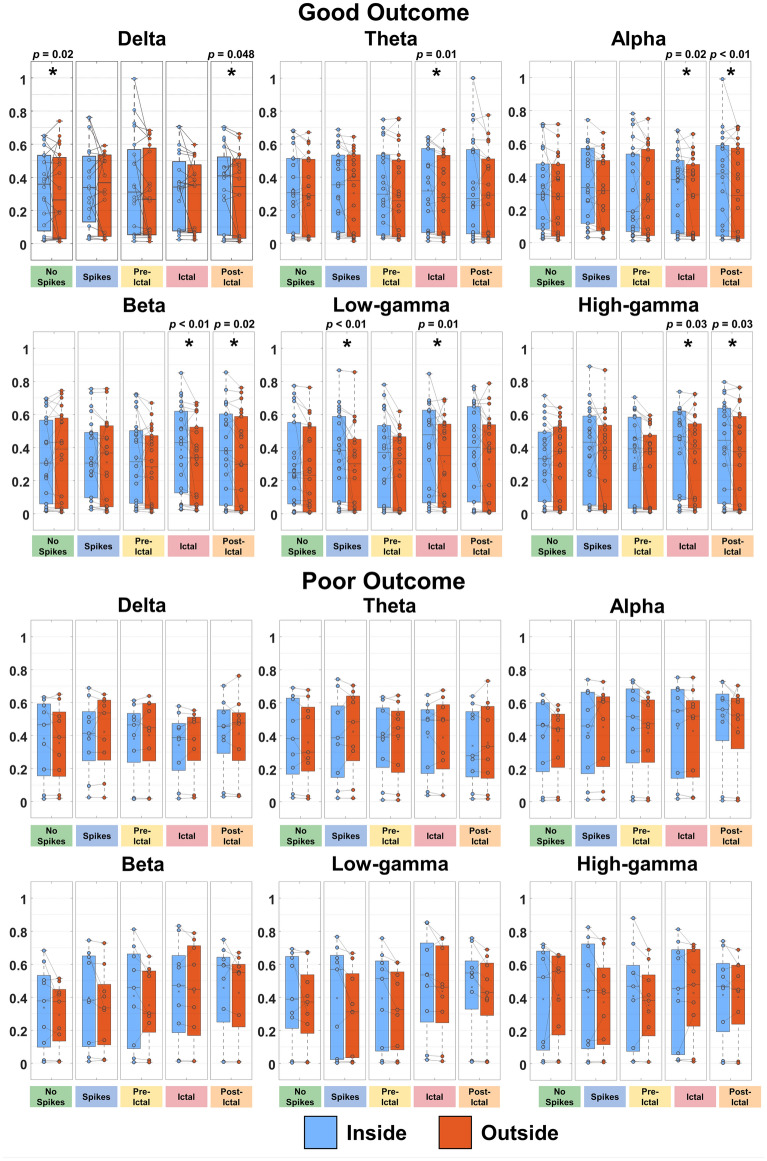
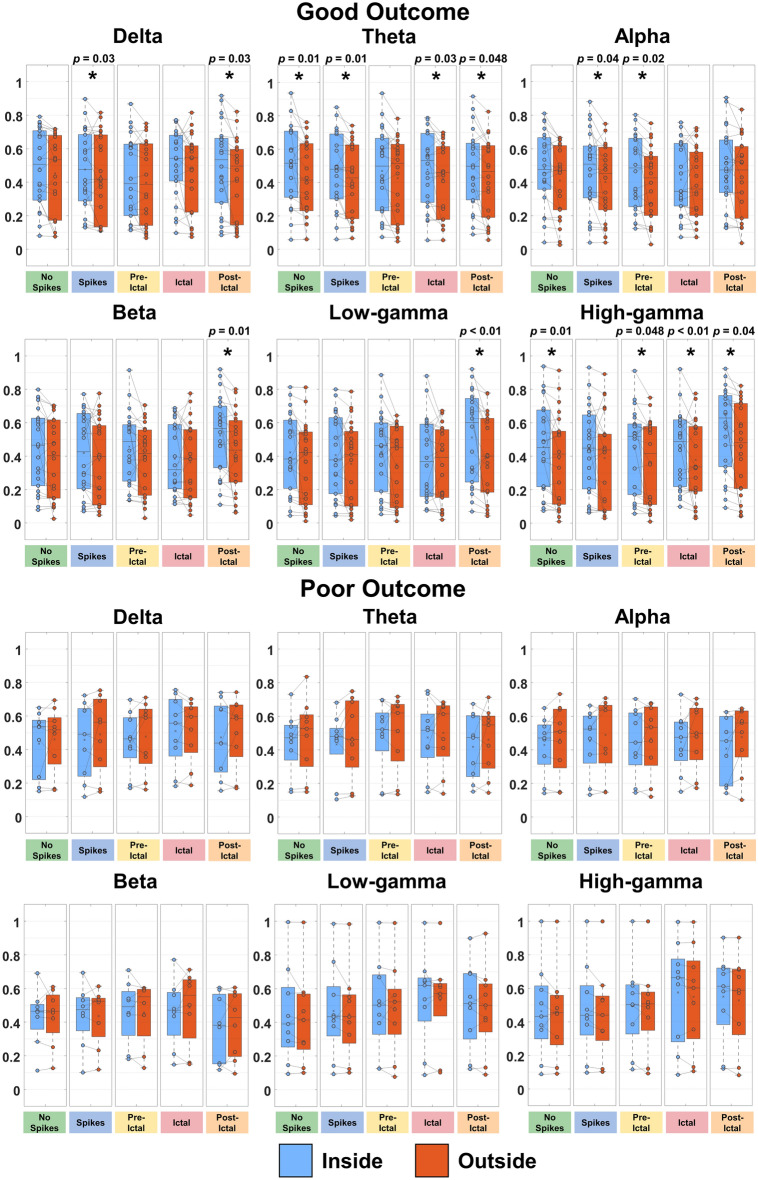
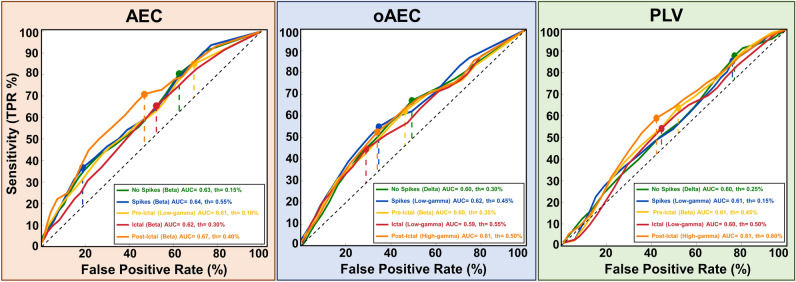
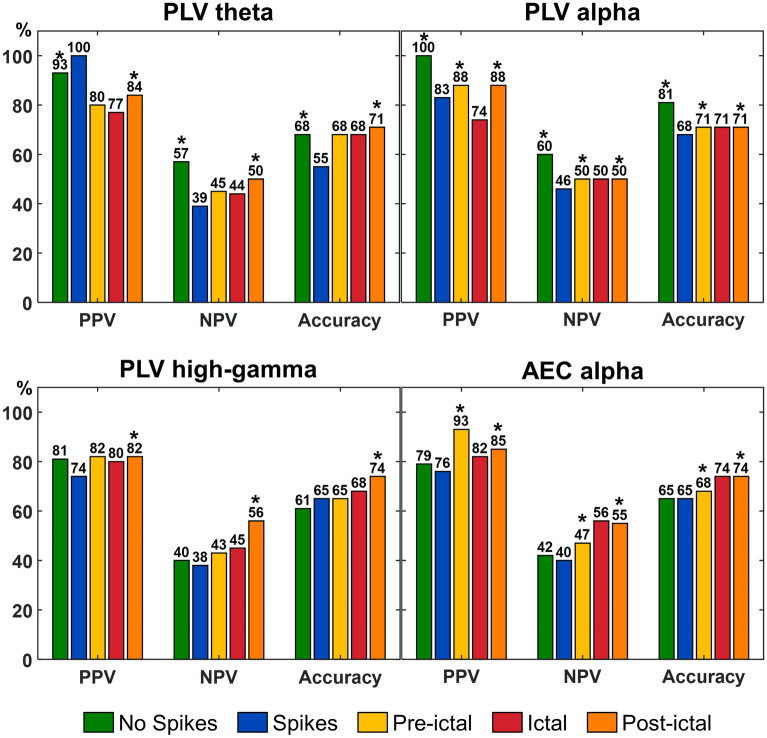
Normal brain functioning emerges from a complex interplay among regions forming networks. In epilepsy, these networks are disrupted causing seizures. Highly connected nodes in these networks are epilepsy surgery targets. Here, we assess whether functional connectivity (FC) using intracranial electroencephalography can quantify brain regions epileptogenicity and predict surgical outcome in children with drug resistant epilepsy (DRE). We computed FC between electrodes on different states (i.e. interictal without spikes, interictal with spikes, pre-ictal, ictal, and post-ictal) and frequency bands. We then estimated the electrodes' nodal strength. We compared nodal strength between states, inside and outside resection for good- (n = 22, Engel I) and poor-outcome (n = 9, Engel II-IV) patients, respectively, and tested their utility to predict the epileptogenic zone and outcome. We observed a hierarchical epileptogenic organization among states for nodal strength: lower FC during interictal and pre-ictal states followed by higher FC during ictal and post-ictal states (p < 0.05). We further observed higher FC inside resection (p < 0.05) for good-outcome patients on different states and bands, and no differences for poor-outcome patients. Resection of nodes with high FC was predictive of outcome (positive and negative predictive values: 47-100%). Our findings suggest that FC can discriminate epileptogenic states and predict outcome in patients with DRE.


Conflict of interest statement

The authors declare no competing interests.

Figures

Figure 1
Figure 1
Functional connectivity (FC) measures extracted from intracranial EEG (iEEG) recordings. (a) Left: Placement of iEEG electrodes on a 2-year-old male (patient #4, Engel IA), which are defined as non-resected (displayed in green), resected (displayed in red), and identified as the seizure onset zone (displayed in blue); Right: Selection of 1-minute duration clips (20 non-overlapping segments of 3 s duration each) from the five epileptogenic states: interictal with no frank epileptiform activity (“No Spikes”, green-colored), interictal with frank epileptiform activity (“Spikes”, blue-colored), pre-ictal before the onset of a clinical seizure (“Pre-Ictal”, yellow-colored), ictal activity during a clinical seizure (“Ictal”, red-colored), and post-ictal activity after the end of a clinical seizure (“Post-Ictal”, orange-colored). (b) For each patient and epileptogenic state, Amplitude Envelope Correlation (AEC), orthogonalized Amplitude Envelope Correlation (oAEC), and Phase Locking Value (PLV) measures were computed for each segment and physiologically relevant frequency band. Rows and columns of each FC matrix represent the iEEG channels (or nodes) and each pixel represents the FC between pairs of channels; here, the FC between the FP12 and FP22 iEEG electrodes is highlighted. Each FC matrix is color-coded from low (displayed in blue) to high values (displayed in yellow). (c) For each channel, nodal strength was computed as the median of all the edges connected to the channel itself, across twenty segments. The FC graph is displayed as an example to highlight FC values between the FP25 iEEG channel with the others. (d) Left: Slow seizure onset (SSO) was recorded from the iEEG data of a 7-year-old female (patient #1, Engel IA); Right: Time-frequency analysis of iEEG time-series shows the theta-alpha sharp activity pattern characteristic of the SSO for this patient. (e) Left: Fast seizure onset (FSO) was recorded from the iEEG data of a 15-year-old male (patient #6, Engel IA); Right: Time-frequency analysis of iEEG time series shows the beta-gamma sharp activity pattern characteristic of the FSO for this patient.
Figure 2
Figure 2
Nodal strength for different epileptogenic states in physiologically relevant frequency bands. Amplitude Envelope Correlation (Top), orthogonalized Amplitude Envelope Correlation (middle), and Phase Locking Value (PLV) (bottom) nodal strength computed for delta, theta, alpha, beta, low- and high-gamma bands on different epileptogenic states. Each epileptogenic state is color-coded: interictal activity with no spikes (“No Spikes”, green-colored), interictal activity with spikes (“Spikes”, blue-colored), pre-ictal activity before the onset of a clinical seizure (“Pre-Ictal”, yellow-colored), ictal activity during a clinical seizure (“Ictal”, red-colored), post-ictal activity after the end of a clinical seizure (“Post-Ictal”, orange-colored). Significant differences are marked with an asterisk (*) (< 0.05, Wilcoxon’s signed-rank test). P-values are corrected for multiple comparisons using the false discovery rate method. In the box-plot diagrams, the horizontal line indicates the median value, lower and upper edges represent the 25th and 75th percentiles, whiskers extend to the minimum and maximum values (excluding outliers) and points outside the whiskers represent the outliers (i.e., values that are at least 1.5 times the interquartile range below the 25th percentile or above the 75th percentile).
Figure 3
Figure 3
Orthogonalized amplitude envelope correlation (oAEC) nodal strength inside and outside resection for good- and poor-outcome patients in physiologically relevant frequency bands. oAEC nodal strength values computed from electrodes located inside vs. outside resection for all epileptogenic states in physiologically relevant frequency bands for good (n=22, Engel I) and poor (n=9, Engel II–IV) surgical outcomes, separately. Nodal strength values inside the resection are blue-colored; nodal strength values outside the resection are orange-colored. Significant differences are marked with an asterisk (*) (< 0.05, Wilcoxon signed-rank test). In the box-plot diagrams, the horizontal line indicates the median value, the cross (×) sign indicates the mean, the lower and upper edges represent the 25th and 75th percentiles, and the whiskers extend to the minimum and maximum values.
Figure 4
Figure 4
Phase locking values (PLV) nodal strength inside and outside resection for good- and poor-outcome patients in physiologically relevant frequency bands. PLV nodal strength values computed from electrodes located inside vs. outside resection for all epileptogenic states in physiologically relevant frequency bands for good (n=22, Engel I) and poor (n=9, Engel II–IV) surgical outcomes, separately. Nodal strength values inside the resection are blue-colored; nodal strength values outside the resection are orange-colored. Significant differences are marked with an asterisk (*) (< 0.05, Wilcoxon signed-rank test). In the box-plot diagrams, the horizontal line indicates the median value, the cross (×) sign indicates the mean, the lower and upper edges represent the 25th and 75th percentiles, and the whiskers extend to the minimum and maximum values.
Figure 5
Figure 5
Orthogonalized amplitude envelope correlation (oAEC) nodal strength across different epileptogenic states at the patient level. Using the magnetic resonance imaging scans of a 5-year-old seizure-free male (patient #7, Engel IA) (top) and a 16-year-old not seizure-free male (patient #26, Engel IIIA) (bottom), we displayed the oAEC nodal strength computed for all epileptogenic states (for the delta band) from interictal state with no spikes (“No Spikes”, left) to the post-ictal state (“Post-Ictal”, right). The oAEC nodal strength values are color-coded: high oAEC nodal strength values are displayed in red; low oAEC nodal strength values are displayed in blue. Resection zone is displayed as a green volume. “Spikes”: interictal activity with spikes; “Pre-Ictal”: pre-ictal activity before the onset of a clinical seizure; “Ictal”: ictal activity during a clinical seizure; “Post-Ictal”: post-ictal activity after the end of a clinical seizure.
Figure 6
Figure 6
Classification between epileptogenic and non-epileptogenic nodes in good-outcome patients. For each frequency band, the receiver operating characteristic (ROC) curves estimated from the amplitude envelope correlation (AEC), orthogonalized AEC (oAEC), and phase locking value (PLV)-based nodal strength computed for each node in patients with good surgical outcome (n=22, Engel I) in different epileptogenic states. The highest areas under the ROC curve (AUC) for each epileptogenic state obtained only in specific frequency bands are color-coded: interictal activity with no spikes (“No Spikes”, green-colored), interictal activity with spikes (“Spikes”, blue-colored), pre-ictal activity before the onset of a clinical seizure (“Pre-Ictal”, yellow-colored), ictal activity during a clinical seizure (“Ictal, red-colored), post-ictal activity after the end of a clinical seizure (“Post-Ictal”, orange-colored). The black-colored dash diagonal line represents the performance of FC measures in discriminating the epileptogenicity of nodes that is no better than a random chance. The colored dash diagonal lines represent the maximum Youden index (J) for each epileptogenic state, respectively. The colored-points on the ROC curves represent the cut-off thresholds for each epileptogenic state, respectively. FPR= false positive rate (i.e., 1- specificity); TPR true positive rate (i.e., sensitivity); th threshold.
Figure 7
Figure 7
Surgical outcome prediction results for different epileptogenic states. Resection of highly connected hubs (i.e., nodes with high nodal strength) computed from phase locking value (PLV) (for the theta, alpha, and high-gamma bands) and amplitude envelope correlation (AEC) (for the alpha band) was associated with good surgical outcome for different epileptogenic states. Each epileptogenic state is color-coded: interictal activity with no spikes (“No Spikes”, green-colored), interictal activity with spikes (“Spikes”, blue-colored), pre-ictal activity before the onset of a clinical seizure (“Pre-Ictal”, yellow-colored), ictal activity during a clinical seizure (“Ictal, red-colored), post-ictal activity after the end of a clinical seizure (“Post-Ictal”, orange-colored). Significant differences are marked with an asterisk (*) (< 0.05, Fisher’s exact test). PPV positive predictive value, NPV negative predictive value.

References

    1. Kundap UP, Paudel YN, Shaikh MF. Animal models of metabolic epilepsy and epilepsy associated metabolic dysfunction: A systematic review. Pharmaceuticals. 2020;13:106. doi: 10.3390/ph13060106. - DOI - PMC - PubMed
    1. Hutchison RM, et al. Dynamic functional connectivity: Promise, issues, and interpretations. Neuroimage. 2013;80:360–378. doi: 10.1016/j.neuroimage.2013.05.079. - DOI - PMC - PubMed
    1. Stacey W, et al. Emerging roles of network analysis for epilepsy. Epilepsy Res. 2020;159:106255. doi: 10.1016/j.eplepsyres.2019.106255. - DOI - PMC - PubMed
    1. Bertoglio D, et al. In vivo measurement of brain network connectivity reflects progression and intrinsic disease severity in a model of temporal lobe epilepsy. Neurobiol. Dis. 2019;127:45–52. doi: 10.1016/j.nbd.2019.02.012. - DOI - PubMed
    1. Khambhati AN, Davis KA, Lucas TH, Litt B, Bassett DS. Virtual cortical resection reveals push-pull network control preceding seizure evolution. Neuron. 2016;91:1170–1182. doi: 10.1016/j.neuron.2016.07.039. - DOI - PMC - PubMed

Publication types

Substances