. 2023 Jun 14;13(1):9667.
doi: 10.1038/s41598-023-36207-z.

Predicting vasovagal reactions to needles with anticipatory facial temperature profiles

Affiliations

Predicting vasovagal reactions to needles with anticipatory facial temperature profiles

Judita Rudokaite et al. Sci Rep. .

Abstract

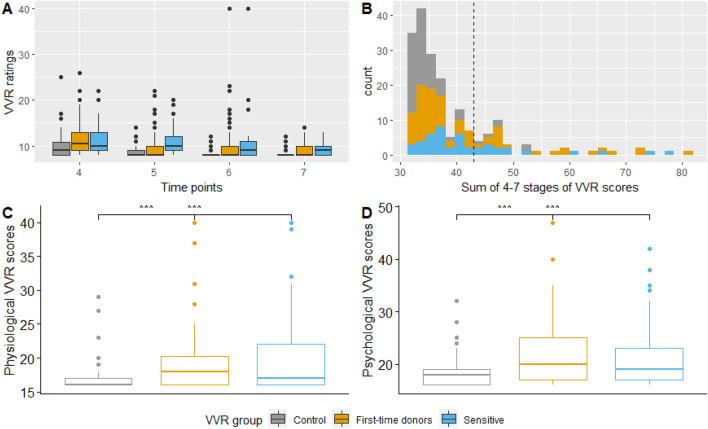
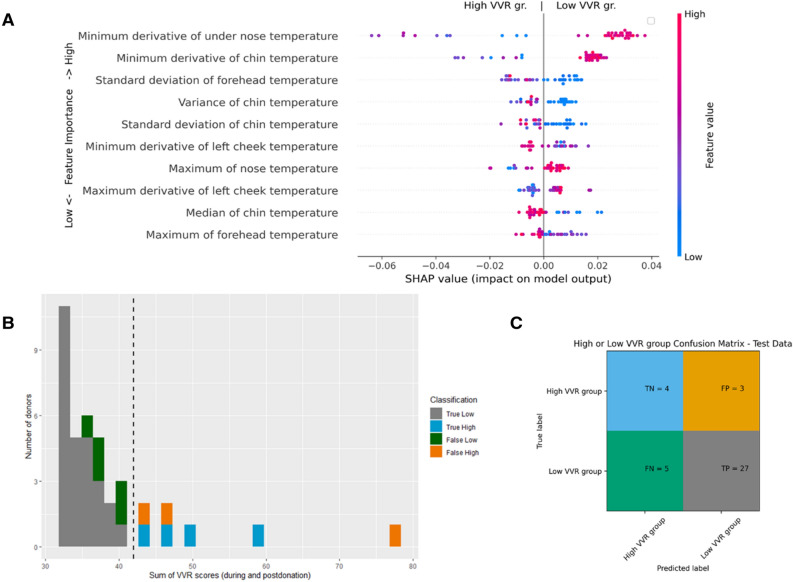
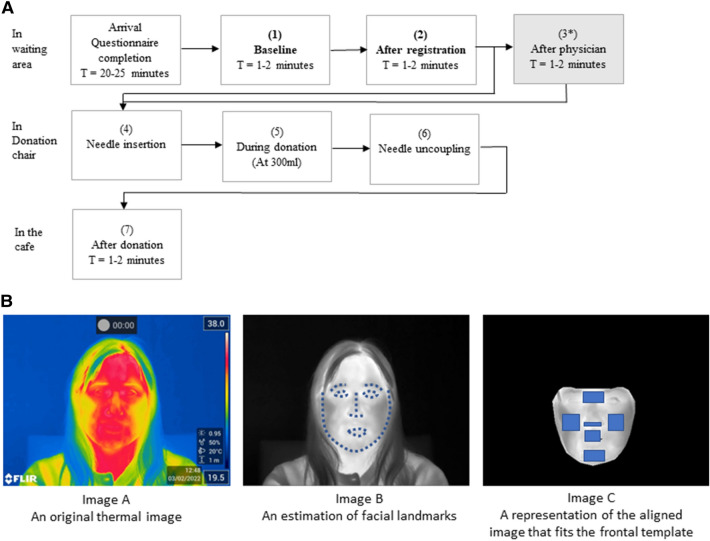
Around one-third of adults are scared of needles, which can result in adverse emotional and physical responses such as dizziness and fainting (e.g. vasovagal reactions; VVR) and consequently, avoidance of healthcare, treatments, and immunizations. Unfortunately, most people are not aware of vasovagal reactions until they escalate, at which time it is too late to intervene. This study aims to investigate whether facial temperature profiles measured in the waiting room, prior to a blood donation, can be used to classify who will and will not experience VVR during the donation. Average temperature profiles from six facial regions were extracted from pre-donation recordings of 193 blood donors, and machine learning was used to classify whether a donor would experience low or high levels of VVR during the donation. An XGBoost classifier was able to classify vasovagal groups from an adverse reaction during a blood donation based on this early facial temperature data, with a sensitivity of 0.87, specificity of 0.84, F1 score of 0.86, and PR-AUC of 0.93. Temperature fluctuations in the area under the nose, chin and forehead have the highest predictive value. This study is the first to demonstrate that it is possible to classify vasovagal responses during a blood donation using temperature profiles.


Conflict of interest statement

Authors Dr. E.M.J. Huis in ‘t Veld and J. Rudokaite are founders of AINAR B.V. The other authors declare no competing interests.

Figures

Figure 1
Figure 1
Distribution of self-reported VVR scores during and after the donation procedure. (A) Distribution of VVR ratings per time point and group. The dots above the box represent the outliers per group. (B) Distribution of total VVR scores. The black dashed line represents the mean of the sample and the cut-off level for the low vs high VVR groups. (C,D) The spread of psychological, physiological and total VVR scores per group. Physiological VVR symptoms consist of faintness, dizziness, weakness and lightheadedness. Psychological VVR symptoms consist of fear, stress, tension, and nervousness. The line in the box represents the mean of each group and the dots above the box represent the outliers per group.
Figure 2
Figure 2
The XGboost performance evaluation on the test set using feature-selected facial temperature dataset (number of features used: 40, number of participants in the test set: 39). The performance evaluation on the test set using XGboost classifier (number of features used: 40, F1 score: 0.86). (A) Represents the feature impact on the model output based on the game theoretic SHAP (SHapley Additive exPlanations) approach. The SHAP summary plot combines feature importance (y-axis) with feature effect (x-axis) where each point represents a SHAP value. All features are sorted by importance from the highest to the lowest. A blue color indicates a low and a red color a high value per feature. The negative score on the x-axis is associated with the ‘high-VVR’ group and a positive score on the x-axis is associated with the ‘low-VVR’ group. For example, the higher the minimum derivative value in the ‘under the nose area’ temperature, the higher the chance that the blood donor is classified in the low-VVR group. In contrast, the lower the standard deviation of the temperature in the forehead area, the higher the chance the blood donor will be classified as being in the low-VVR group. (B) shows correctly (grey and blue shade) and incorrectly (orange and green shade) classified samples on the test set. (C) represents a confusion matrix, which gives a summary of prediction results.
Figure 3
Figure 3
An overview of the blood donation testing procedure and the extraction of mean temperature from the facial regions of interest. (A) Overview of the procedure and stages. At each of the seven stages, donors reported their levels of VVR, and an ITI video recording was made for as long as that stage lasted. From stage 4 to stage 6 the recording is continuous and lasts between 5 and 27 min. *The procedure is slightly different per BCC. At two locations, donors are brought directly to the donation chair after the physician check whilst skipping stage 3. Therefore, the ratings of VVR at stage 3 are not included in the total score. The recordings from stages 1 and 2 were combined into one continuous time series. (B) Image A represents an original thermal image recorded; Image B represents the same image with facial landmarks fitted; Image C represents the aligned image that fits the frontal template.

Similar articles

Cited by

References

    1. McLenon J, Rogers MA. The fear of needles: A systematic review and meta-analysis. J. Adv. Nurs. 2019;75(1):30–42. doi: 10.1111/jan.13818. - DOI - PubMed
    1. Taddio A, Ipp M, Thivakaran S, Jamal A, Parikh C, Smart S, et al. Survey of the prevalence of immunization non-compliance due to needle fears in children and adults. Vaccine. 2012;30(32):4807–4812. doi: 10.1016/j.vaccine.2012.05.011. - DOI - PubMed
    1. Freeman D, Lambe S, Yu LM, Freeman J, Chadwick A, Vaccari C, et al. Injection fears and COVID-19 vaccine hesitancy. Psychol. Med. 2021;194:245–251. - PMC - PubMed
    1. Love AS, Love RJ. Considering needle phobia among adult patients during mass COVID-19 vaccinations. J. Prim. Care Community Health. 2021 doi: 10.1177/21501327211007393. - DOI - PMC - PubMed
    1. Neumann-Böhme S, et al. Once we have it, will we use it? A European survey on willingness to be vaccinated against COVID-19. Eur. J. Health Econ. 2020;21(7):977–982. doi: 10.1007/s10198-020-01208-6. - DOI - PMC - PubMed

Publication types