. 2023 Jul;619(7968):112-121.
doi: 10.1038/s41586-023-06173-7. Epub 2023 Jun 14.

A pangenome reference of 36 Chinese populations

Collaborators, Affiliations

A pangenome reference of 36 Chinese populations

Yang Gao et al. Nature. 2023 Jul.

Abstract

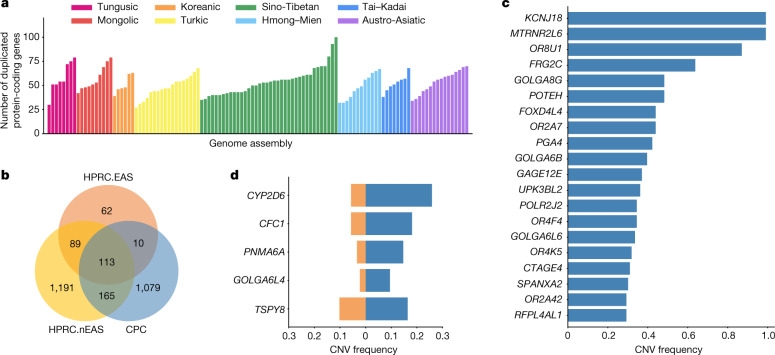
Human genomics is witnessing an ongoing paradigm shift from a single reference sequence to a pangenome form, but populations of Asian ancestry are underrepresented. Here we present data from the first phase of the Chinese Pangenome Consortium, including a collection of 116 high-quality and haplotype-phased de novo assemblies based on 58 core samples representing 36 minority Chinese ethnic groups. With an average 30.65× high-fidelity long-read sequence coverage, an average contiguity N50 of more than 35.63 megabases and an average total size of 3.01 gigabases, the CPC core assemblies add 189 million base pairs of euchromatic polymorphic sequences and 1,367 protein-coding gene duplications to GRCh38. We identified 15.9 million small variants and 78,072 structural variants, of which 5.9 million small variants and 34,223 structural variants were not reported in a recently released pangenome reference1. The Chinese Pangenome Consortium data demonstrate a remarkable increase in the discovery of novel and missing sequences when individuals are included from underrepresented minority ethnic groups. The missing reference sequences were enriched with archaic-derived alleles and genes that confer essential functions related to keratinization, response to ultraviolet radiation, DNA repair, immunological responses and lifespan, implying great potential for shedding new light on human evolution and recovering missing heritability in complex disease mapping.


Conflict of interest statement

The authors declare no competing interests.

Figures

Fig. 1
Fig. 1. CPC panel with diploid assemblies of 58 core samples.
a, Left: the geographical locations and ethnic, linguistic and genetic affiliations of the samples sequenced by CPC (see Supplementary Table 1 for details). The geographical distribution of HPRC samples is shown in the top left. Han-N, Han Chinese from North China; Han-S, Han Chinese from South China; Han-C, Han Chinese from Central China. Top right: the results of principal component (PC) analysis based on whole-genome data of the CPC samples (coloured dots) in the context of East Asian populations (grey dots). The four East Asian samples in HPRC are indicated using triangles in the principal component plot. b, NGx plot showing the assembly contiguity of the 116 CPC core assemblies. The contigs of T2T-CHM13 and GRCh38 (N-masked) are included for comparison. c, Assembly quality of the 116 CPC core assemblies. The x axis shows the quality value of each assembly, and the y axis shows the rate at which the circular consensus sequencing reads were remapped to the assembly contigs. d, Completeness of the 116 CPC core assemblies. The x axis represents the total length of the genome that could not be aligned to the GRCh38 and T2T-CHM13 references, and the y axis shows the proportion of each assembly aligned to GRCh38 and T2T-CHM13. e, Density plot showing the small-scale assembly error distribution of the 116 CPC core assemblies. f, Duplication ratio of the 116 CPC core assemblies. The dark and light colours of each bar represent the duplication rate related to T2T-CHM13 and GRCh38, respectively. The map of China in a was obtained from a standard map service (GS[2020]4618) approved by the Ministry of National Resources of the People’s Republic of China (https://m.mnr.gov.cn).
Fig. 2
Fig. 2. CNVs identified from CPC assemblies.
a, Number of duplicated protein-coding genes per CPC genome assembly compared with the GRCh38 reference. b, Venn diagram showing the number of duplicated genes in CPC, HPRC.EAS and HPRC.nEAS assemblies. c, The top 20 most common CPC-specific CNV-related genes compared with the HPRC assemblies. d, The five overlapped CNV genes showing a higher frequency (≥5%) in CPC assemblies (blue) than in HPRC assemblies (orange). HPRC.EAS, East Asian in HPRC; HPRC.nEAS, non-East Asian in HPRC.
Fig. 3
Fig. 3. CPC pangenome graph and CPC-specific variants compared to the HPRC assemblies.
a, A variation graph representing CHM13.chr11:34,823,712–34,823,777 of the CPC pangenome. Coloured lines represent five haplotype assemblies. b, Pangenome cumulative growth curves for the CPC pangenome graph. Depth in bars measures how often a non-reference segment occurred in the assembled haplotypes. Non-reference sequences were classified into four categories according to the frequency of presence in the haplotypes: core (≥95%), common (≥5% and <95%), polymorphism (≥2 haplotypes but <5%) and singleton (only one haplotype). Different colours indicate a different ethnic group. c, The number of CPC-specific and common variants between CPC and HPRC assemblies from the joint pangenome graph. d, Number of identified CPC-specific small variants and SVs in different populations. e, The distribution of CPC-specific SVs from the joint pangenome graph on autosomes. The colour scale from white to red represents the density of SVs in 1-Mb regions. The orange triangle marks CPC-specific SVs that were significantly enriched in this 1-Mb window compared with HPRC-specific variants and common variants, on the basis of a one-tailed Fisher’s exact test (FDR-correlated P value < 0.05).
Fig. 4
Fig. 4. Visualization of novel and complex SVs in the CPC pangenome graph.
a, The locations of α-globin genes on the CPC pangenome subgraph. b, Allele counts and linear structural visualization of all structural haplotypes from the Minigraph-Cactus graph among 116 CPC haploid assemblies and 94 HPRC haploid assemblies. The size and spacing of genes on the diagram do not represent the actual size of the chromosome. c, Paths of different α-globin gene haplotypes through the joint subgraph. The arrows indicate the direction of the paths. d, The locations of genes in the RASA4 region on the CPC subgraph. e, Paths of different structural haplotypes with diverse copy numbers of RASA4B. ‘partial’ represents a 14.9-kb fragment of RASA4B.
Extended Data Fig. 1
Extended Data Fig. 1. Assembly pipeline and quality control of the CPC samples.
a, Flowchart showing the steps and bioinformatic tools applied in quality control, assembly, and correction of 68 CPC samples used for the pan-genome construction. b, Quality control of the primary assemblies of 68 CPC samples, in which 3 samples (denoted by the red dots) with N50 <20 Mb or contig number ≥2000 were removed in subsequent analyses. c, Quality control of the diploid assemblies of 65 CPC samples, in which 14 haplotype assemblies (denoted by the red dots) of 7 samples with N50 <10 Mb or contig number ≥2000 were removed in subsequent analyses.
Extended Data Fig. 2
Extended Data Fig. 2. Proportion of variant types in the highly repetitive sequences of 58 CPC samples.
The highly repetitive sequences in each assembly were identified using dna-brnn. Proportions of (a) small variants and (b) SVs in these regions are shown for each sample. In each plot, the samples are ordered by the total variant proportion within each language family.
Extended Data Fig. 3
Extended Data Fig. 3. Novel sequences with respect to T2T-CHM13 identified in the CPC assemblies.
a, Number of novel sequences (insertions ≥1 kb) identified by aligning two-phased assemblies of each CPC sample to the T2T-CHM13 reference. b, Chromosome distribution of 115 insertion hotspots of novel sequences.
Extended Data Fig. 4
Extended Data Fig. 4. CSVs in CPC samples.
a, The count of CSVs with different shared sample numbers. b, The length distribution of the final 706 CSVs. We merged CSVs of all 58 samples by considering 80% reciprocal overlap and the same type, and obtained 706 CSVs in total. c, The number of CSVs in each CSV class. We classified the CSVs by the shared sample numbers into Shared (present in all samples), Major (present in ≥50% samples but not all), Polymorphic (present in more than 1 but <50% of all samples), and Singleton (present in only one sample).
Extended Data Fig. 5
Extended Data Fig. 5. CNV genes with higher frequency in CPC than that in two HPRC subsets.
CNV genes observed in both CPC (frequency ≥5%) and HPRC are compared across the two datasets on the frequency. a, CNV genes showing higher frequency in the CPC assemblies than in the HPRC.EAS. b, CNV genes showing higher frequency in the CPC assemblies than in the HPRC.nEAS from HPRC.
Extended Data Fig. 6
Extended Data Fig. 6. Length distribution of SVs in the graph-based pan-genome reference.
The average and median length of SVs are indicated by the two red vertical lines, and both are larger than the read length (usually 150 bp) generated by short-read sequencing. The peaks at 300 bp for Alu insertions and 6 kb for LINE-1 are highlighted.
Extended Data Fig. 7
Extended Data Fig. 7. Ancestry component inference of the CPC cohort.
We randomly selected 10 unrelated high-quality samples from each CPC population, and inferred the genetic ancestry for each sample using ADMIXTURE assuming 2–12 ancestry components (K). Samples used in the pan-genome construction are labeled with short vertical lines.
Extended Data Fig. 8
Extended Data Fig. 8. Growth of non-reference sequences in Han Chinese and multiple populations.
The cumulative length of non-reference (unaligned to the human reference genome GRCh38) sequences in Han Chinese haplotypes (the red boxes) and that in multi-ethnic haplotypes (the green boxes) are calculated based on the CPC graph genome by pangenome-growth software. We randomly ordered the three Han Chinese samples, and conducted 40 replication analyses with randomly selected samples (three samples for each analysis) from the CPC dataset. The multi-ethnic haplotypes show a relatively larger growth rate of the non-reference sequences than the Han Chinese samples. The lower and upper hinges correspond to the first and third quartiles (the 25th and 75th percentiles). The upper whisker extends from the hinge to the largest value no further than 1.5 * IQR from the hinge (where IQR is the inter-quartile range, or distance between the first and third quartiles). The lower whisker extends from the hinge to the smallest value at most 1.5 * IQR of the hinge. Data beyond the end of the whiskers are called “outlying” points and are plotted individually.
Extended Data Fig. 9
Extended Data Fig. 9. Significant enrichment of the CPC-specific SVs identified in the CPC assemblies on the reported GWAS loci.
The proportion of the approximately independent CPC-specific loci (adjacent novel SVs with distance <50 kb are merged) located <50 kb around the GWAS variants (downloaded from https://www.ebi.ac.uk/gwas/) was compared with that estimated for a set of randomly sampled common loci (shared with T2T-CHM13) with matched size distribution. The P-values were obtained based on 100 permutations, and enrichments reaching at least marginal significance (BH-adjusted P-value < 0.1) of CPC-specific SVs around (a) the GWAS loci reported in global populations and (b) those reported in East Asians are shown. In particular, significant enrichments (BH-adjusted P-value < 0.05) are indicated with asterisks (*) on the trait identities. Each boxplot represents the median (thick black line), upper and lower quartiles (box), 1.5× interquartile range (whiskers) of the permutation test statistics (grey dots). The observed statistics are indicated with red dots.
Extended Data Fig. 10
Extended Data Fig. 10. Sharing ratio of the archaic ancestry estimated for pairwise CPC populations.
a, Sharing ratio of the Neanderthal-like introgressed sequences. b, Sharing ratio of the Denisovan-like introgressed sequences. The heatmaps were generated using the R package pheatmap 1.0.12. Warm colors in the heatmap indicate higher levels of ancestry sharing, while cold colors indicate lower levels of ancestry sharing. Populations are clustered using the complete-linkage method, and the branches are colored according to language families.

Comment in

References

    1. Liao, W.-W. et al. A draft human pangenome reference. Preprint at 10.1101/2022.07.09.499321 (2022).
    1. Lou H, et al. Haplotype-resolved de novo assembly of a Tujia genome suggests the necessity for high-quality population-specific genome references. Cell Syst. 2022;13:321–333. doi: 10.1016/j.cels.2022.01.006. - DOI - PubMed
    1. Wang T, et al. The Human Pangenome Project: a global resource to map genomic diversity. Nature. 2022;604:437–446. doi: 10.1038/s41586-022-04601-8. - DOI - PMC - PubMed
    1. Sherman RM, Salzberg SL. Pan-genomics in the human genome era. Nat. Rev. Genet. 2020;21:243–254. doi: 10.1038/s41576-020-0210-7. - DOI - PMC - PubMed
    1. Lu D, Xu S. Principal component analysis reveals the 1000 Genomes Project does not sufficiently cover the human genetic diversity in Asia. Front. Genet. 2013;4:127. doi: 10.3389/fgene.2013.00127. - DOI - PMC - PubMed

Publication types

MeSH terms